


折线图
简单粗暴描点,先上图。


from matplotlib import pyplot
import matplotlib.pyplot as plt
from matplotlib.font_manager import FontProperties
from matplotlib.ticker import MultipleLocator, FormatStrFormatter
font_set = FontProperties(fname=r"c:\windows\fonts\simsun.ttc", size=15)
import matplotlib

%matplotlib inline

plt.rcParams['figure.figsize'] = (12.0, 8.0) # set default size of plots
plt.rcParams['image.interpolation'] = 'nearest'
plt.rcParams['image.cmap'] = 'gray'
plt.rcParams['font.sans-serif']=['SimHei']
plt.rcParams['axes.unicode_minus']=False
# 设置标题大小
plt.rcParams['font.size'] = '16'
#解决画多幅图时出现图形部分重叠
fig = plt.figure()
matplotlib.rcParams.update(
{
'text.usetex': False,
'font.family': 'stixgeneral',
'mathtext.fontset': 'stix',
}
)
myfont = FontProperties(fname='/home/linuxidc/.local/share/fonts/文泉驿正黑.ttf')

# names = range(0,16,1)
#(x轴坐标范围0-15,步长为1)
names = range(0,20,1)

names = [str(x) for x in list(names)]

x = range(len(names))
# y=[pow(10,i) for i in range(-5,1)]

# 可以用numpy的矩阵或者list直接赋值给abc,例如一个一行N列的矩阵matrix,a=matrix
a=[0.02083,0.00974,0.00974,0.00333,0.01091,0.02365,0.07986,0.3069,0.44674,0.64103,0.79791,0.79618,0.89333,0.87147,0.86174,0.90221,0.84588,0.87633,0.84641,0.86218]
b=[0.03147,0.01071,0.03448,0.08553,0.20064,0.4386,0.72973,0.77663,0.84775,0.85473,0.86624,0.94983,0.98276,1,1,1,1,1,1,1]
c=[0.96711,0.93269,0.93559,0.95254,0.91892,0.96181,0.95255,0.97163,0.9402,0.96949,0.96233,0.93972,0.96516,0.94237,0.95302,0.92593,0.94904,0.9614,0.93464,0.95364]

# linestyle: 实线-虚线-- 点线:点横线-.

plt.plot(x, a,linestyle='-',marker='s',label=u'Lisa')
plt.plot(x, b, linestyle='-.',marker='+',label=u'Bb')
plt.plot(x, c,  linestyle=':',marker='*',label=u'Cc')

plt.grid(linestyle='-.')

plt.ylim(0,1)    # 设置x轴的刻度从2到10
# plt.grid(ls='--')
plt.grid(True)
plt.legend()  # 让图例生效
plt.xticks(x, names, rotation=1)


plt.margins(0)
plt.subplots_adjust(bottom=0.001)

plt.xlabel('年龄',fontproperties=font_set) #X轴标签
plt.ylabel("死亡率",fontproperties=font_set) #Y轴标签
要让纵坐标是十的幂次方(一般通信的专业用的多),python和matlab都可以用semilogy方法实现。(matlab画十的幂次方图的可以在出图后把y轴改成对数,也很方便。都可以~)
一样方法,就改那三行代码
plt.semilogy(x, a,linestyle='-',marker='s',label=u'Lisa')
plt.semilogy(x, b, linestyle='-.',marker='+',label=u'Bb')
plt.semilogy(x, c, linestyle=':',marker='*',label=u'Cc')
柱状图
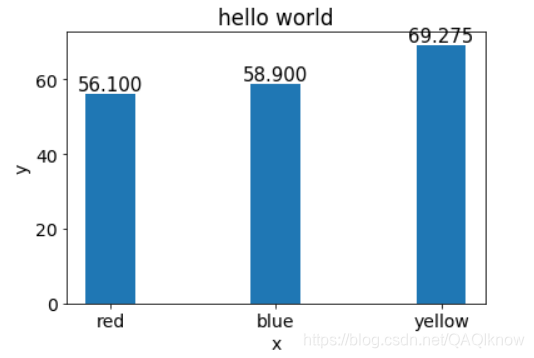
import matplotlib.pyplot as plt
import numpy as np
plt.rcParams['font.size'] = '14'# 设置坐标刻度和title大小
num=[56.1, 58.9,69.275]
width= 0.3
name = ['red','blue','yellow']
plt.bar(name, num,width)
plt.xlabel('x') #横坐标是fpr
plt.ylabel('y')  #纵坐标是tpr
plt.title('hello world')
for a, b in zip(name, num):
    plt.text(a, b, '%.3f' % b, ha='center', va='bottom', fontsize=15)
plt.show()
三维图
from mpl_toolkits.mplot3d import Axes3D
import matplotlib.pyplot as plt
plt.rcParams['figure.figsize'] = (10.0, 10.0) # set default size of plots
fig = plt.figure()
ax = fig.add_subplot(111, projection='3d')
plt.title('Receiver Operating Characteristic')
plt.rcParams['font.sans-serif']=['SimHei']
#下方里面放矩阵或者list都可以
x=[]
y=[]
z=[]


ax.scatter( H,S,z, label='S v H')

ax.set_xlabel('X')
ax.set_ylabel('Y')
ax.set_zlabel('Z')
plt.show()
大致结果如下。打码请见谅


 被折叠的 条评论
为什么被折叠?
被折叠的 条评论
为什么被折叠?
 到【灌水乐园】发言


