


 本文适合新手,通过简单的步骤指导如何在H5中使用ECharts库创建基本的图表。首先介绍如何引入ECharts,然后逐步解释实现ECharts图表的主要步骤,最终展示实际的图表效果。
用echarts的人都知道,有些实例是可以直接复制echarts中实例的代码,然后稍加改动即可
但是新手刚接触的话可能会一脸懵逼
现在我来直接上代码
首先我们需要下载echarts插件,或者直接引入即可
主要需要这几部实现echarts图表:
1.引入echarts文件
2.定义一个容器div,存放图表
3.初始化echarts实例对象
4.指定图表的配置项和数据,即设置option
5.使用刚指定的配置项和数据显示图表
<!DOCTYPE html>
<html lang="en">
<head>
    <meta charset="UTF-8">
    <meta name="viewport" content="width=device-width, initial-scale=1.0">
    <meta http-equiv="X-UA-Compatible" content="ie=edge">
    <title>Document</title>
    <script src="js/jquery-2.1.1.min.js"></script>
    //需要先引入echarts
    <script src="js/echarts.min.js"></script>
</head>
<body>
	//定义一个盒子
    <div id="scales" style=" width: 800px; height: 600px;"></div>

    <script>
     // 函数调用才会生效
      $(function(){
        scales()
      });
        function scales(){
            // 初始化echart实例,获取dom
          let scales1 = echarts.init(document.getElementById('scales'));
        //   以下都是复制图表图例中的,若有其他需要的功能可自行添加
          var option={
            // 图表标题,有的时候可能位置不是很好调整,也可以自己写个标签写标题
                title: {
                    text: '堆叠区域图'
                },
                // 提示信息
                tooltip: {
                    trigger: 'axis',   // 触发类型,默认数据触发,可选为:'item' ¦ 'axis'
                    axisPointer: {    // 坐标轴指示器,坐标轴触发有效
                        type: 'cross',   // 默认为直线,可选为:'line' | 'shadow'
                        label: {
                            backgroundColor: '#6a7985'
                        }
                    }
                },
                // 图例
                legend: {
                    data: ['邮件营销', '联盟广告', '视频广告', '直接访问', '搜索引擎']
                },
				//布局
                toolbox: {
                    feature: {
                        saveAsImage: {}
                    }
                },
                // 网格
                grid: {
                    left: '3%',
                    right: '4%',
                    bottom: '3%',
                    containLabel: true
                },
                // X轴中的数据
                xAxis: [
                    {
                        type: 'category',
                        boundaryGap: false,
                        data: ['周一', '周二', '周三', '周四', '周五', '周六', '周日']
                    }
                ],
                // y轴中的数据
                yAxis: [
                    {
                        type: 'value'
                    }

                ],
                // 数据
                series: [
                    {
                        name: '邮件营销',
                        type: 'line',
                        stack: '总量',
                        areaStyle: {},
                        data: [120, 132, 101, 134, 90, 230, 210]
                    },
                    {
                        name: '联盟广告',
                        type: 'line',
                        stack: '总量',
                        areaStyle: {},
                        data: [220, 182, 191, 234, 290, 330, 310]
                    },
                    {
                        name: '视频广告',
                        type: 'line',
                        stack: '总量',
                        areaStyle: {},
                        data: [150, 232, 201, 154, 190, 330, 410]
                    },
                    {
                        name: '直接访问',
                        type: 'line',
                        stack: '总量',
                        areaStyle: { normal: {} },
                        data: [320, 332, 301, 334, 390, 330, 320]
                    },
                    {
                        name: '搜索引擎',
                        type: 'line',
                        stack: '总量',
                        label: {
                            normal: {
                                show: true,
                                position: 'top'
                            }
                        },

                        areaStyle: { normal: {} },
                        data: [820, 932, 901, 934, 1290, 1330, 1320]
                    }
                ]
            }
            //使用刚指定的配置项和数据显示图表
             scales1.setOption(option);
        }

    </script>
</body>
</html>
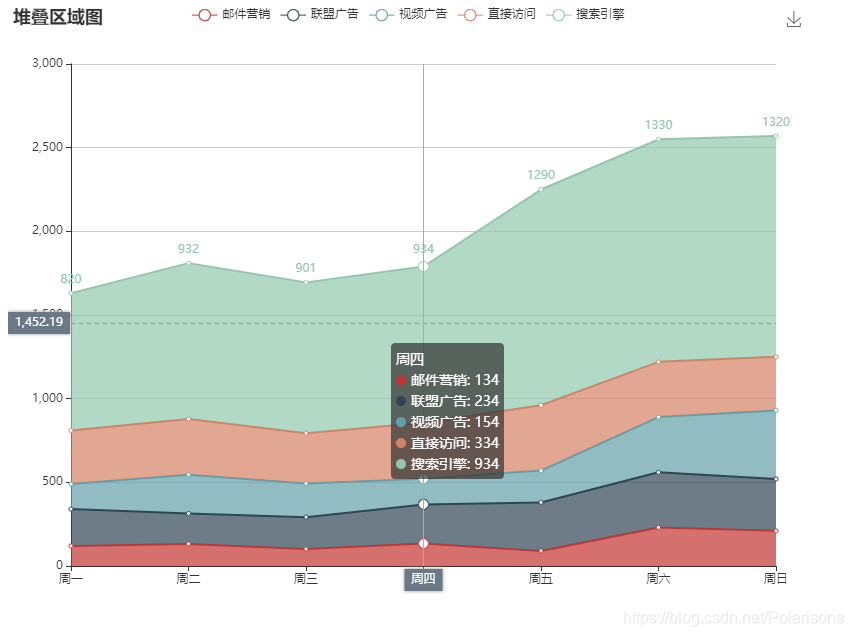
最终显示的结果如图


 2203
2203


 到【灌水乐园】发言


