import numpy as np
import plotly.offline as of
import plotly.graph_objs as go
import plotly.plotly as py
gailv1=[0.0712, 0.1277, 0.1211, 0.1801, 0.0712, 0.088, 0.2824, 0.096, 0.2059, 0.1025, 0.3378, 0.0875, 0.1537, 0.1778, 0.0864, 0.0725, 0.054, 0.1241, 0.1721, 0.1007, 0.1901, 0.0949, 0.0503, 0.2901]
gailv2=[0.0183, 0.1064, 0.1211, 0.1801, 0.017, 0.025, 0.1765, 0.096, 0.0872, 0.0721, 0.0946, 0.0563, 0.0683, 0.0778, 0.016, 0.0213, 0.0373, 0.0966, 0.0505, 0.0432, 0.013, 0.0404, 0.0287, 0.0358]
gailv3=[0.017, 0.0106, 0.0583, 0.0307, 0.0292, 0.0025, 0.0039, 0.0072, 0.0036, 0.0152, 0.0135, 0.0625, 0.0756, 0.0556, 0.0302, 0.03, 0.0553, 0.031, 0.0158, 0.0791, 0.0216, 0.0142, 0.0024, 0.0184]
hours=[1,2,3,4,5,6,7,8,9,10,11,12,13,14,15,16,17,18,19,20,21,22,23,24]
trace0 = go.Scatter(
x = hours,
dx=1,
y = gailv1,
text=gailv1,
marker={'size':10},
mode='lines+markers',
name = '1:我们的推荐'
)
trace1 = go.Scatter(
x = hours,
dx=1,
y = gailv2,
text=gailv2,
marker={'symbol':4,'size':10},
mode = 'lines+markers',
name = '2:最近邻策略推荐'
)
trace2 = go.Scatter(
x = hours,
dx=1,
y = gailv3,
text=gailv3,
marker={'symbol':201,'size':10},
mode = 'lines+markers',
name = '3:随机策略推荐'
)
data = [trace0, trace1,trace2]
layout = go.Layout(title='不同方法打车概率的差异',
titlefont={
'size':20
},
xaxis={
'title':'Hour of Day',
'showgrid' : False,
'zeroline' : True,
'titlefont':{
'size':15
},
'nticks':24
},yaxis={
'title':'乘客打车成功概率',
'zeroline' : True,
'titlefont':{
'size':15
}
})
fig = go.Figure(data=data, layout=layout)
of.plot(fig)
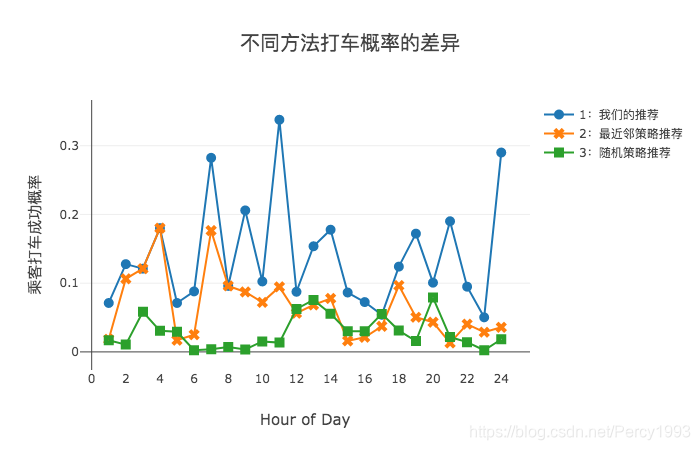


 本文介绍了如何利用Plotly库在Python中绘制图表,并重点讲解了如何设置X轴属性以及自定义标记(marker)的样式,包括颜色、大小和形状,以增强图表的可读性和美观性。


 1035
1035

 被折叠的 条评论
为什么被折叠?
被折叠的 条评论
为什么被折叠?
 到【灌水乐园】发言


