


 本文介绍了五个用于展示事件在不同时间尺度(天/月/年/小时/周)分布的函数:get_events_distribution,以及两个图表视图函数view_case_duration_graph和view_events_per_time_graph,帮助用户理解和分析数据的时间特性。
有五种展示图标。
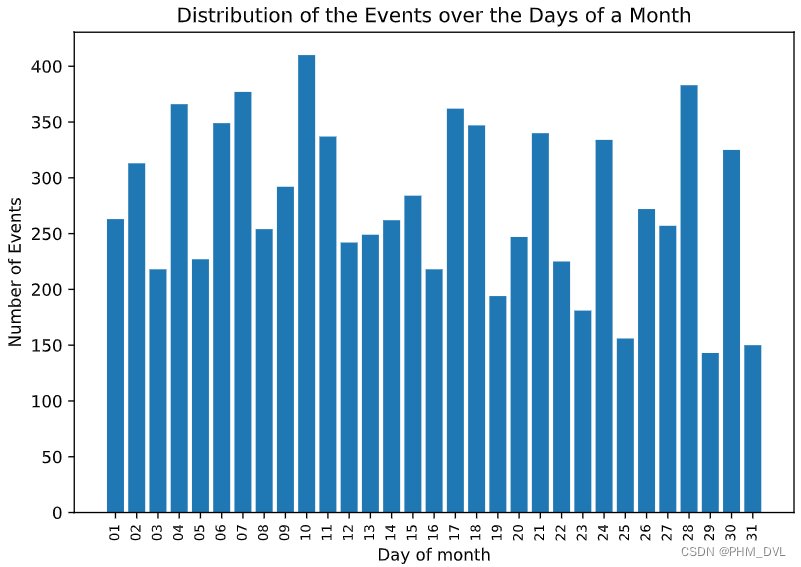
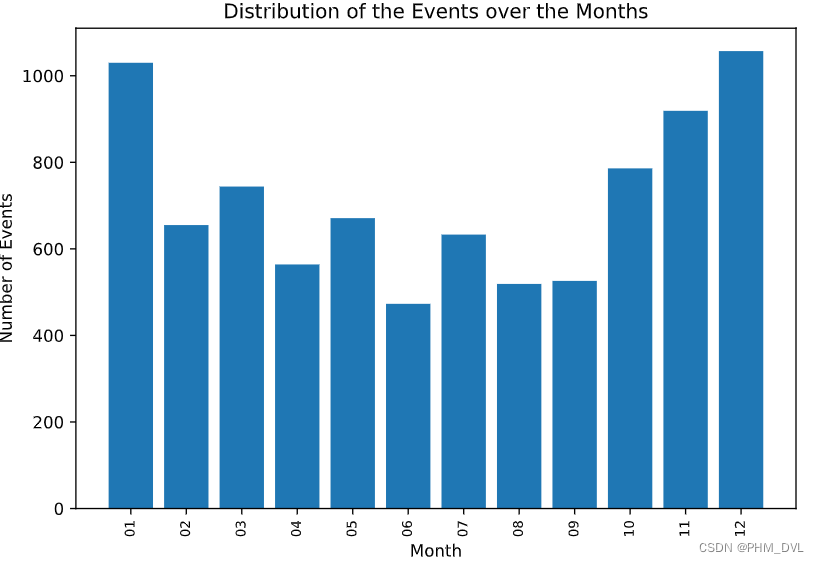
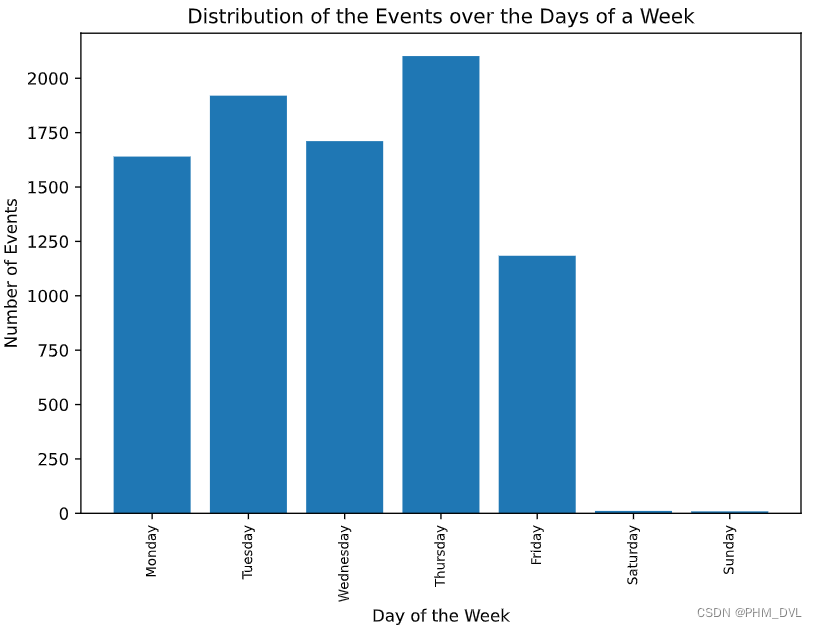
plots the distribution of the events over the: days_month , months, years, hours, days_week
| get_events_distribution(df, distr_type="days_month") | get_events_distribution(df, distr_type="months") |
 |  |
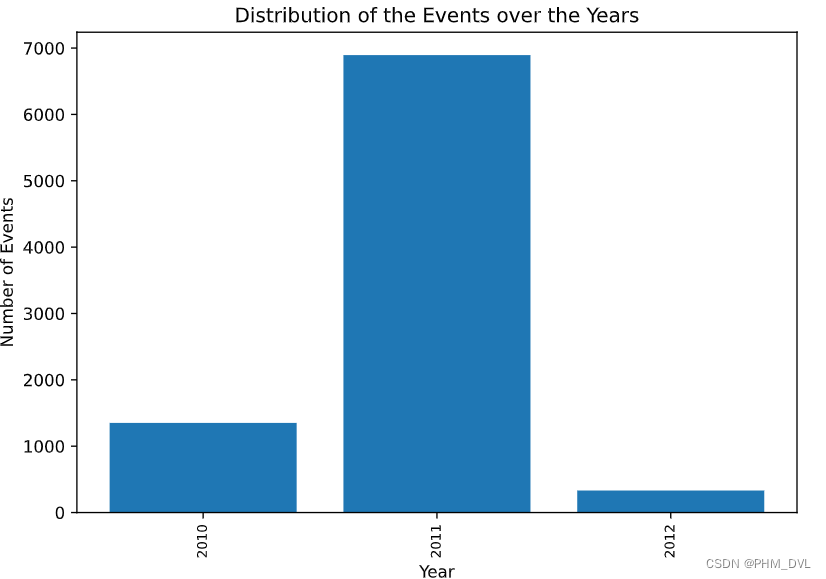
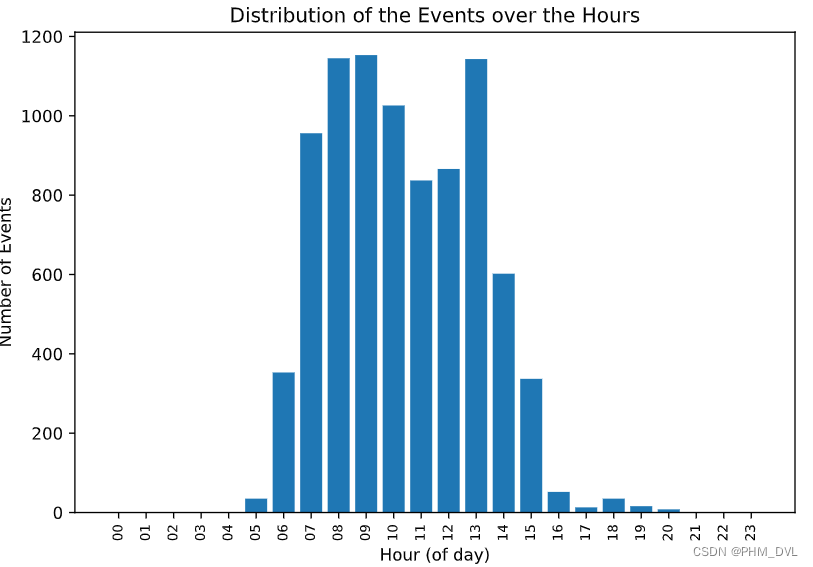
| get_events_distribution(df, distr_type="years") | get_events_distribution(df, distr_type="hours") |
 |  |
| get_events_distribution(df, distr_type="days_week") | |
 |
| view_case_duration_graph | view_events_per_time_graph |
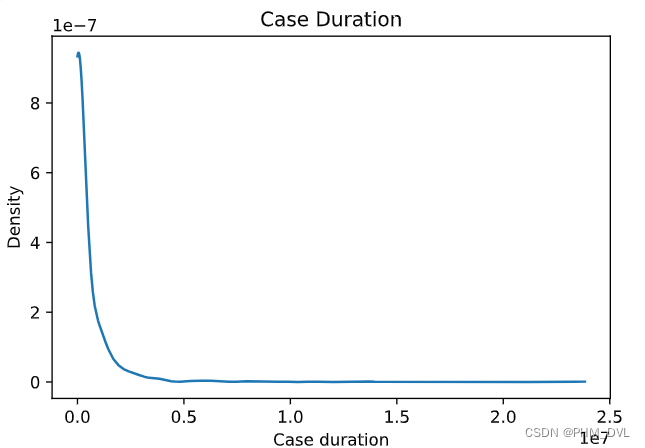 | 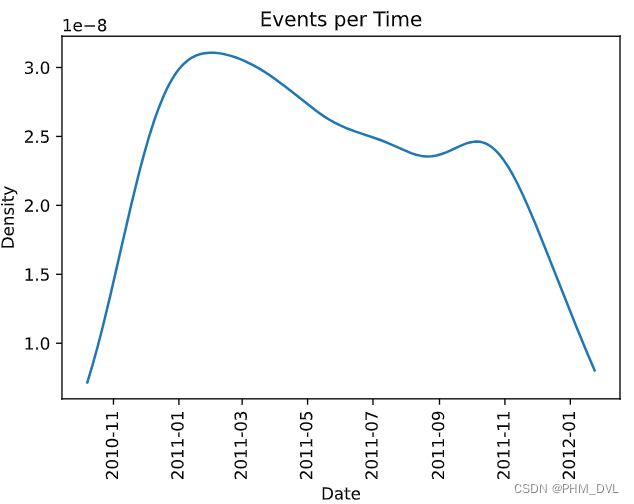 |


 到【灌水乐园】发言


