


 本文详细介绍如何使用Matlab的subplot函数进行子图绘制,通过示例代码展示如何在一个窗口中创建多个图表,并分别展示了sin(x)-1、cos(x)+1、tan(x)和cot(x)的图形,为读者提供了实用的Matlab绘图技巧。
1、函数功能:
subplot(m, n, p):
其中,m和n指定将图形窗口分成m*n个绘图区,p指定当前活动区,p的大小以右行方向计数。
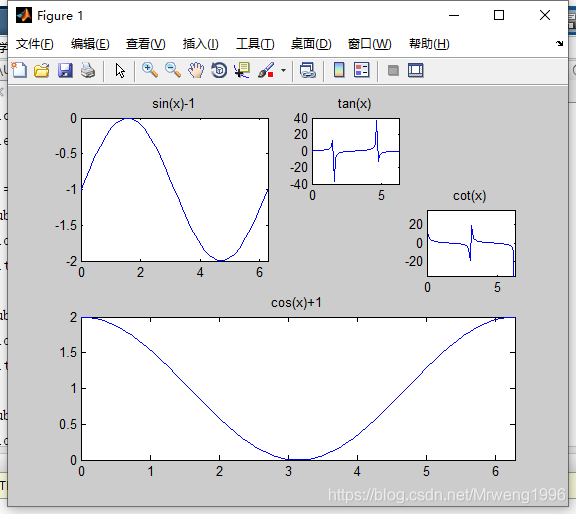
2、代码示例
clc;
clear all;

x = linspace(0,2*pi,60);
subplot(2,2,1);
plot(x, sin(x)-1);
title('sin(x)-1');axis([0, 2*pi, -2, 0]);

subplot(2,1,2);
plot(x, cos(x)+1);
title('cos(x)+1');axis([0, 2*pi, 0, 2]);

subplot(4,4,3);
plot(x, tan(x));
title('tan(x)');axis([0, 2*pi, -40, 40]);

subplot(4,4,8);
plot(x, cot(x));
title('cot(x)');axis([0, 2*pi, -35, 35]);
运行结果:


 被折叠的 条评论
为什么被折叠?
被折叠的 条评论
为什么被折叠?
 到【灌水乐园】发言


