


 本文详细介绍了如何使用matplotlib库在Python中实现绘制并显示多个图片,包括原图及R、G、B三个颜色通道的单独展示。通过两种不同的方法,展示了如何创建子图来分别显示红色、绿色和蓝色通道的图像。
本文主要是使用matplotlib 实现绘制多个图片:
-
代码 :
import numpy as np
import matplotlib.pyplot as plt
%matplotlib inline -
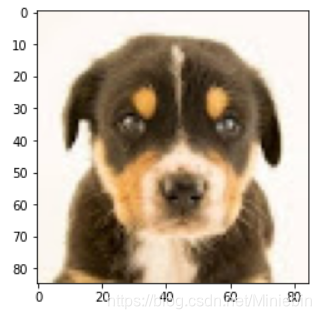
读取和显示原图片
image = Image.open(’/dogs.jpg’)
plt.imshow(image)
-
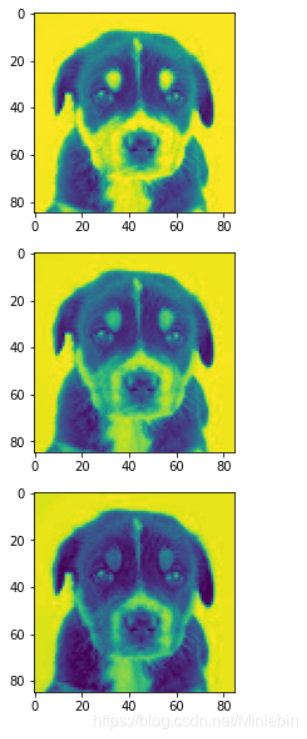
分别显示R,G,B 通道图片
image=np.asarray(image)
pic_red=image[:,:,0]
pic_green=image[:,:,1]
pic_b=image[:,:,2]
plt.figure(1)
plt.figure()
f,axarr=plt.subplots(3,1)
axarr[0].imshow(pic_red)
axarr[1].imshow(pic_green)
axarr[2].imshow(pic_b)
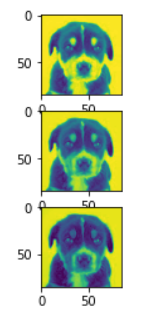
4. 方法二:
plt.subplot(311)
plt.imshow(pic_red)
plt.subplot(312)
plt.imshow(pic_green)
plt.subplot(313)
plt.imshow(pic_b)
plt.show()
 最低0.47元/天 解锁文章


 3万+
3万+

 被折叠的 条评论
为什么被折叠?
被折叠的 条评论
为什么被折叠?
 到【灌水乐园】发言


