


Python各类图形绘制—turtle与Matplotlib-30、两个椭圆相交部分面积计算
目录
Python各类图形绘制—turtle与Matplotlib-30、两个椭圆相交部分面积计算
前言
既然是学习数学,肯定会离不开各种图形,之前的文章中很多我都尽可能的不使用图来表示了,但是觉得不好,毕竟数学离开了图就会很抽象,所以我们这里单独的学习一下Python的各类图形绘制,包含绘制切线什么的,这样在数学学习的图像处理上就会好很多。
| 编号 | 中文名称 | 英文名称 | 图形说明 |
|---|---|---|---|
| 1 | 点 | Point | 几何中最基本元素,无大小、长度、宽度、高度,仅表示位置,二维平面用坐标 (x, y) 确定位置 |
| 2 | 线段 | Line Segment | 直线上两点间的有限部分,有两个端点,可确定长度,由两端点坐标确定位置和长度 |
| 3 | 射线 | Ray | 由线段一端无限延长形成,有一个端点,另一端无限延伸,不可测量长度 |
| 4 | 直线 | Line | 没有端点,可向两端无限延伸,不可度量长度,平面直角坐标系中可用线性方程表示 |
| 5 | 角 | Angle | 由两条有公共端点的射线组成,公共端点是顶点,两条射线是边,用度数衡量大小 |
| 6 | 三角形 | Triangle | 同一平面内不在同一直线上的三条线段首尾顺次连接组成的封闭图形。按边分有等边(三边相等)、等腰(至少两边相等)、不等边三角形;按角分有锐角(三角皆锐角)、直角(一角为直角)、钝角(一角为钝角)三角形 |
| 7 | 四边形 | Quadrilateral | 由不在同一直线上的四条线段依次首尾相接围成的封闭的平面图形或立体图形。常见的有平行四边形(两组对边分别平行)、矩形(四个角为直角的平行四边形)、菱形(四条边相等的平行四边形)、正方形(四个角为直角且四条边相等的平行四边形)、梯形(一组对边平行,另一组对边不平行)等 |
| 8 | 五边形 | Pentagon | 由五条线段首尾相连组成的封闭图形,内角和为 540 度,正五边形五条边相等,五个角也相等 |
| 9 | 六边形 | Hexagon | 由六条线段首尾相连围成的封闭图形,内角和为 720 度,正六边形六条边相等,六个内角也相等,每个内角为 120 度 |
| 10 | 圆形 | Circle | 平面上到定点的距离等于定长的所有点组成的图形,定点称为圆心,定长称为半径。圆是轴对称图形,也是中心对称图形 |
| 11 | 椭圆 | Ellipse | 平面内到两个定点的距离之和等于常数(大于两定点间距离)的点的轨迹,这两个定点叫做椭圆的焦点,两焦点间的距离叫做焦距 |
| 12 | 扇形 | Sector | 一条圆弧和经过这条圆弧两端的两条半径所围成的图形,扇形面积与圆心角(顶角)、圆半径相关 |
| 13 | 弓形 | Segment of a circle | 由弦及其所对的弧组成的图形,可分为劣弧弓形(小于半圆)和优弧弓形(大于半圆) |
开发环境
系统:win11
开发语言:Python
使用工具:Jupyter Notebook
使用库:turtle与Matplotlib
turtle_demo
代码示例:
import turtle
import math
import numpy as np
# 初始化画布
screen = turtle.Screen()
screen.title("椭圆相交区域面积计算")
t = turtle.Turtle()
t.speed(0) # 最快速度
# 椭圆参数
a1, b1 = 120, 60 # 第一个椭圆的长轴和短轴
a2, b2 = 90, 60 # 第二个椭圆的长轴和短轴
d = 90 # 两个椭圆中心之间的距离
def draw_ellipse(t, a, b, x_offset=0):
"""绘制椭圆的函数"""
t.penup()
# 使用参数方程绘制椭圆
for angle in range(361): # 0到360度
theta = math.radians(angle)
x = a * math.cos(theta) + x_offset
y = b * math.sin(theta)
if angle == 0:
t.goto(x, y)
t.pendown()
else:
t.goto(x, y)
# 计算相交区域面积(使用数值积分)
def calculate_intersection_area():
x_min = -a1 - d/2
x_max = a2 + d/2
y_min = -max(b1, b2)
y_max = max(b1, b2)
area = 0
x_points = np.linspace(x_min, x_max, 100)
y_points = np.linspace(y_min, y_max, 100)
dx = x_points[1] - x_points[0]
dy = y_points[1] - y_points[0]
for x in x_points:
for y in y_points:
in_ellipse1 = ((x + d/2)/a1)**2 + (y/b1)**2 <= 1
in_ellipse2 = ((x - d/2)/a2)**2 + (y/b2)**2 <= 1
if in_ellipse1 and in_ellipse2:
area += dx * dy
return area
# 绘制第一个椭圆
t.color('blue')
draw_ellipse(t, a1, b1, -d/2)
# 绘制第二个椭圆
t.color('red')
draw_ellipse(t, a2, b2, d/2)
# 计算相交面积
intersection_area = calculate_intersection_area()
# 显示计算过程和结果
t.penup()
t.color('black')
t.goto(150, 200)
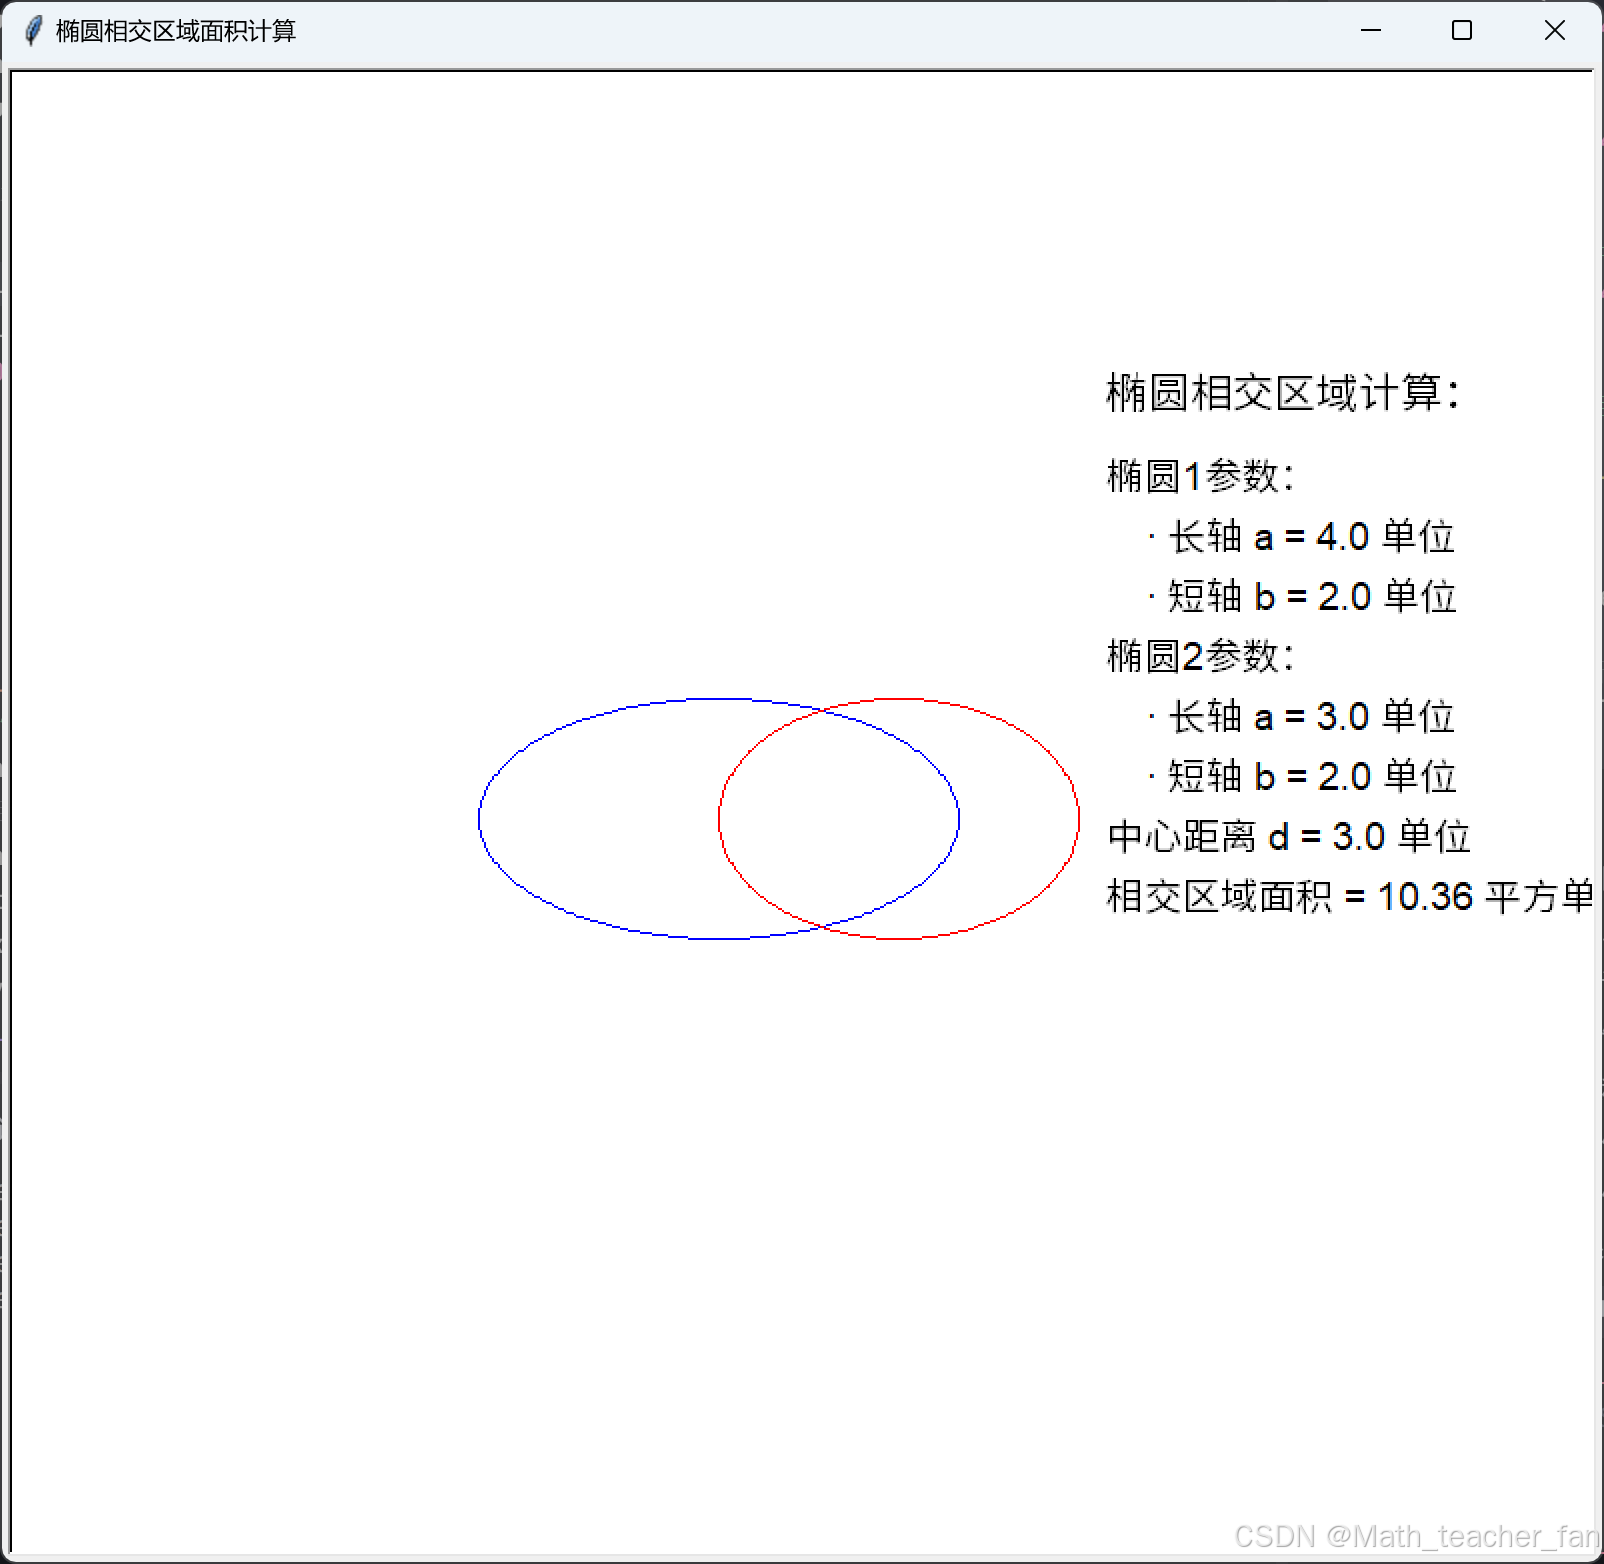
t.write("椭圆相交区域计算:", font=("Arial", 16, "normal"))
t.goto(150, 160)
t.write(f"椭圆1参数:", font=("Arial", 14, "normal"))
t.goto(170, 130)
t.write(f"· 长轴 a = {a1/30:.1f} 单位", font=("Arial", 14, "normal"))
t.goto(170, 100)
t.write(f"· 短轴 b = {b1/30:.1f} 单位", font=("Arial", 14, "normal"))
t.goto(150, 70)
t.write(f"椭圆2参数:", font=("Arial", 14, "normal"))
t.goto(170, 40)
t.write(f"· 长轴 a = {a2/30:.1f} 单位", font=("Arial", 14, "normal"))
t.goto(170, 10)
t.write(f"· 短轴 b = {b2/30:.1f} 单位", font=("Arial", 14, "normal"))
t.goto(150, -20)
t.write(f"中心距离 d = {d/30:.1f} 单位", font=("Arial", 14, "normal"))
t.goto(150, -50)
t.write(f"相交区域面积 = {intersection_area/900:.2f} 平方单位",
font=("Arial", 14, "normal"))
# 隐藏海龟
t.hideturtle()
# 保持窗口显示
screen.mainloop()效果示例:
Matplotlib_demo
代码示例:
import numpy as np
import matplotlib.pyplot as plt
from matplotlib.patches import Ellipse
from scipy import integrate
# 设置中文字体
plt.rcParams['font.sans-serif'] = ['SimHei']
plt.rcParams['axes.unicode_minus'] = False
# 椭圆参数
a1, b1 = 4, 2 # 第一个椭圆的长轴和短轴
a2, b2 = 3, 2 # 第二个椭圆的长轴和短轴
d = 3 # 两个椭圆中心之间的距离
# 创建图形
plt.figure(figsize=(12, 8))
# 创建主绘图区域
ax = plt.subplot(111)
# 绘制第一个椭圆
ellipse1 = Ellipse(xy=(-d/2, 0), width=2*a1, height=2*b1,
angle=0, fill=False, color='blue', label='椭圆1')
ax.add_patch(ellipse1)
# 绘制第二个椭圆
ellipse2 = Ellipse(xy=(d/2, 0), width=2*a2, height=2*b2,
angle=0, fill=False, color='red', label='椭圆2')
ax.add_patch(ellipse2)
# 计算相交区域的面积
def ellipse1_equation(x, y):
return ((x + d/2)/a1)**2 + (y/b1)**2 <= 1
def ellipse2_equation(x, y):
return ((x - d/2)/a2)**2 + (y/b2)**2 <= 1
# 定义积分区域的边界
x_min = -a1 - d/2
x_max = a2 + d/2
y_min = -max(b1, b2)
y_max = max(b1, b2)
# 计算相交区域的面积(使用数值积分)
def integrand(y, x):
return float(ellipse1_equation(x, y) and ellipse2_equation(x, y))
area = 0
x_points = np.linspace(x_min, x_max, 100)
y_points = np.linspace(y_min, y_max, 100)
dx = x_points[1] - x_points[0]
dy = y_points[1] - y_points[0]
for x in x_points:
for y in y_points:
if integrand(y, x):
area += dx * dy
# 设置坐标轴范围和比例
ax.set_xlim(x_min-1, x_max+1)
ax.set_ylim(y_min-1, y_max+1)
ax.set_aspect('equal')
# 添加网格
ax.grid(True, linestyle='--', alpha=0.6)
# 添加坐标轴
ax.axhline(y=0, color='k', linestyle='-', alpha=0.3)
ax.axvline(x=0, color='k', linestyle='-', alpha=0.3)
# 添加标题和图例
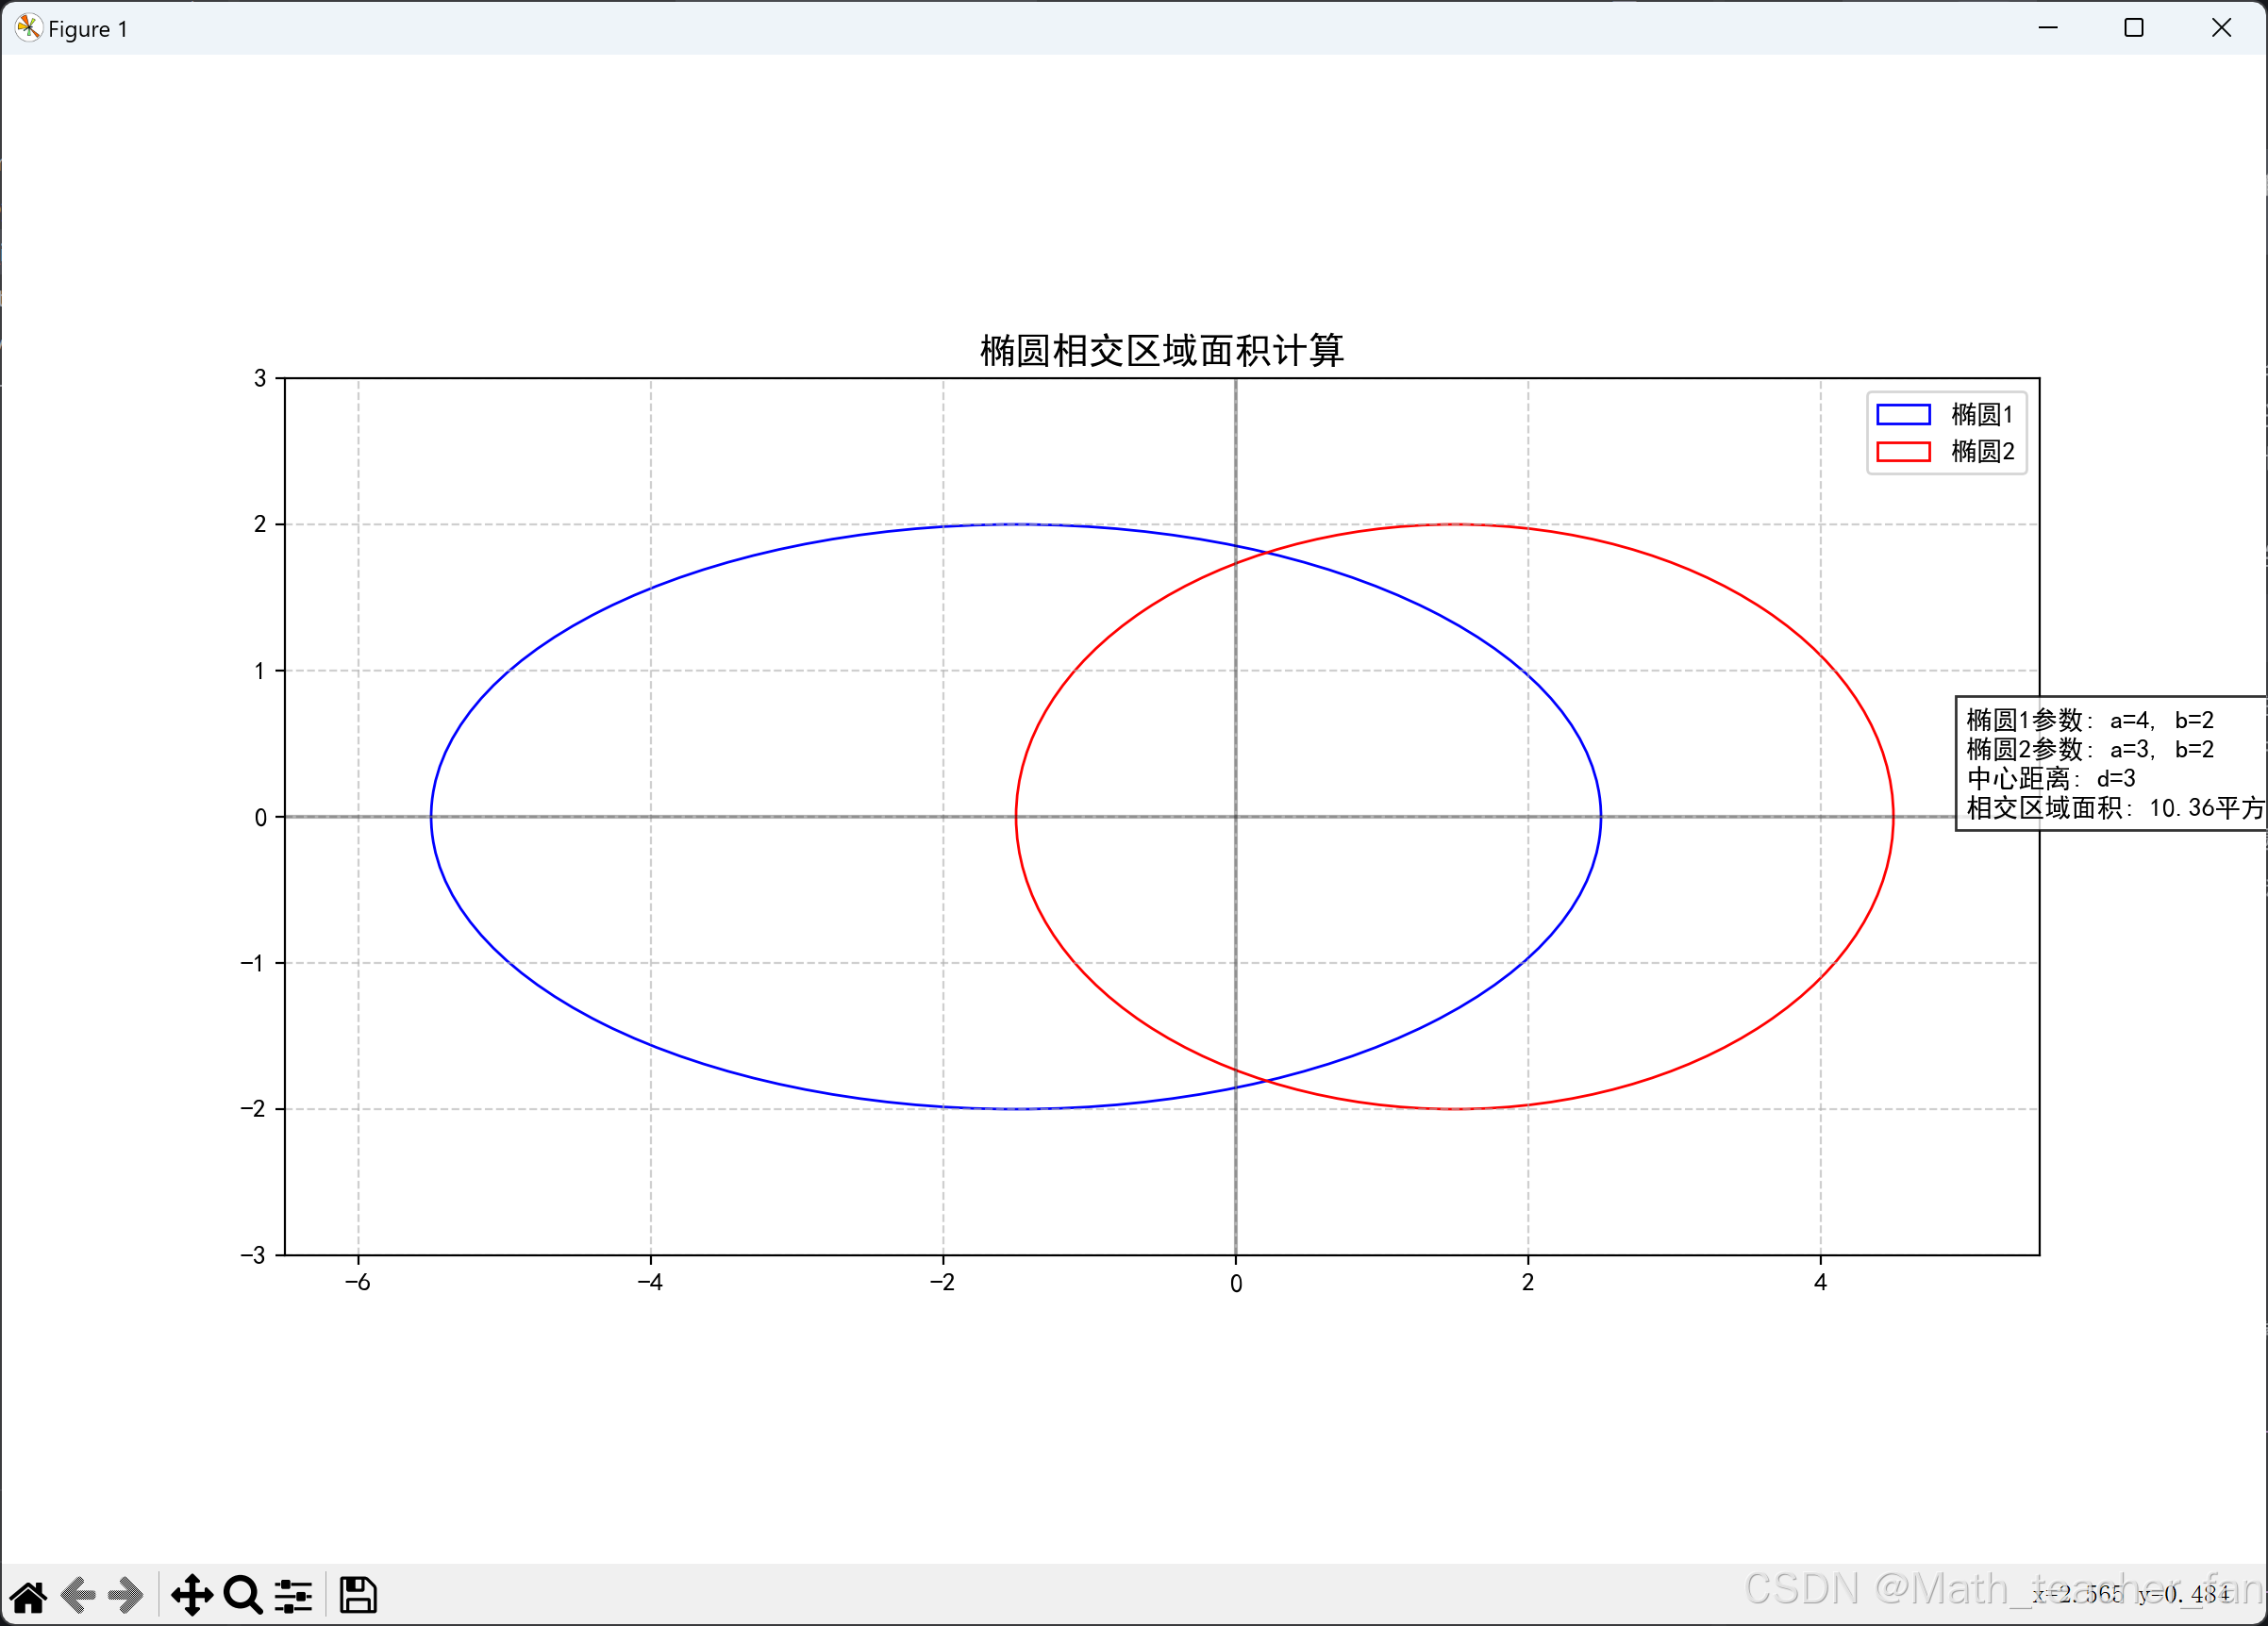
plt.title('椭圆相交区域面积计算', fontsize=14)
plt.legend()
# 添加计算结果说明
info_text = f'椭圆1参数: a={a1}, b={b1}\n'
info_text += f'椭圆2参数: a={a2}, b={b2}\n'
info_text += f'中心距离: d={d}\n'
info_text += f'相交区域面积: {area:.2f}平方单位'
plt.text(x_max+0.5, 0, info_text, bbox=dict(facecolor='white', alpha=0.8))
# 显示图形
plt.show()效果示例:


 4108
4108

 被折叠的 条评论
为什么被折叠?
被折叠的 条评论
为什么被折叠?
 到【灌水乐园】发言


