


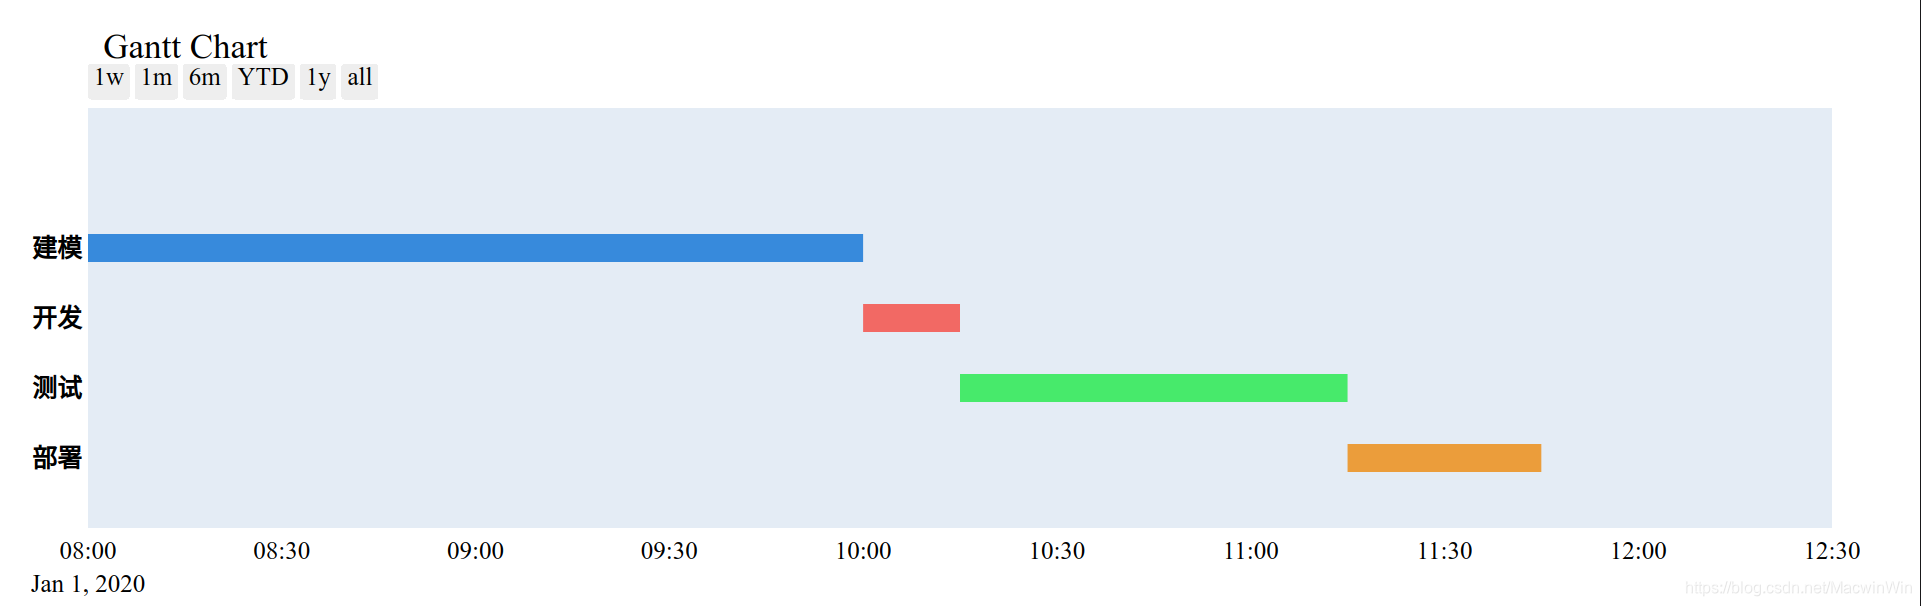
用plotly做了一个甘特图,效果还行,把脚本记录下来
安装plotly:
>>> pip3 install plotly
>>> import plotly as py
>>> import plotly.figure_factory as ff
>>> pyplt = py.offline.plot
>>> df = [dict(Task="<b>建模</b>", Start='2020-01-01 8:00:00', Finish='2020-01-01 10:00:00', Complete=100),
>>>       dict(Task="<b>开发</b>", Start='2020-01-01 10:00:00', Finish='2020-01-01 10:15:00', Complete=100),
>>>       dict(Task="<b>测试</b>", Start='2020-01-01 10:15:00', Finish='2020-01-01 11:15:00', Complete=100),
>>>       dict(Task="<b>部署</b>", Start='2020-01-01 11:15:00', Finish='2020-01-01 11:45:00', Complete=100)]
>>> colors = ['#488ae0', '#ea6961', '#62ea61', '#e59d2a']
>>> fig = ff.create_gantt(df, colors=colors, index_col='Task', show_colorbar=False, group_tasks=True)
>>> fig.update_layout(
>>>     font=dict(
>>>         family="MicroSoft YaHei",
>>>         size=25,
>>>         color="black"
>>>     )
>>> )
>>> fig.update_xaxes(range=['2020-01-01 8:00:00', '2020-01-01 12:30:00'])
>>> pyplt(fig, filename='./Gantt.html')


 1655
1655


 到【灌水乐园】发言


