


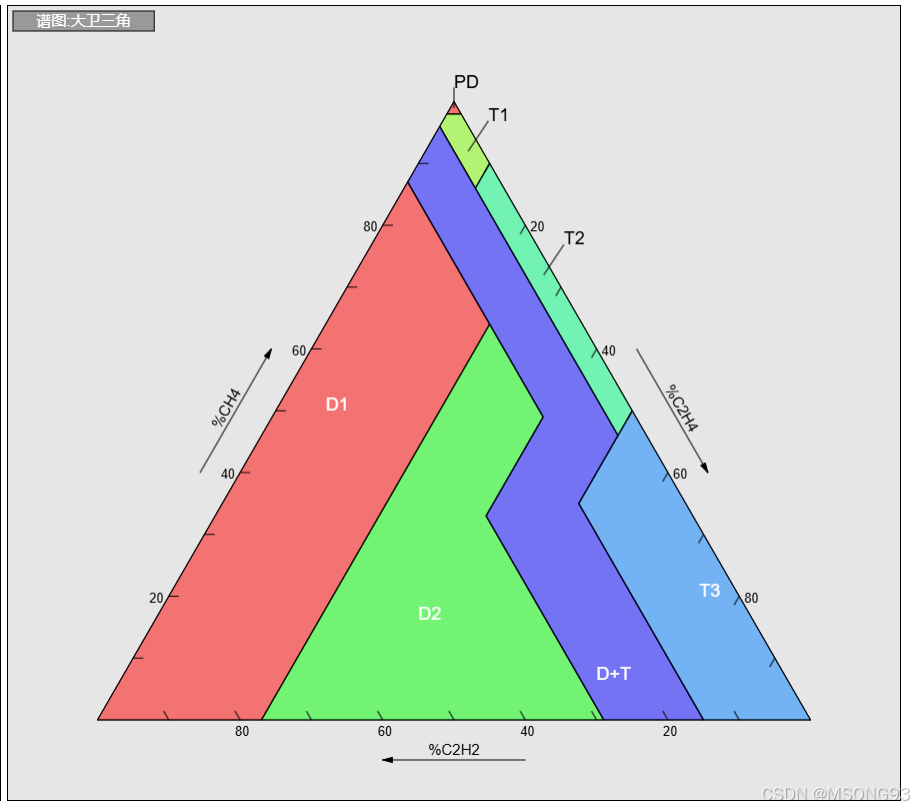
JS的立体图还没弄,今天只弄了QT的三维图和三角图,还有JS的大卫三角图,因为前端的同事也需要用这个图谱,只能给他们写一个JS版本的,脑壳痛
绘制流程:
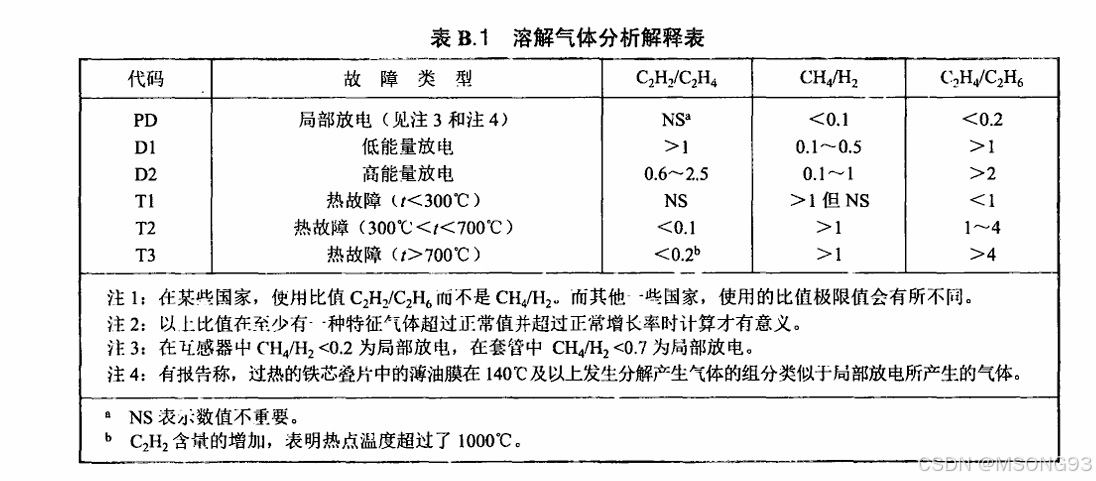
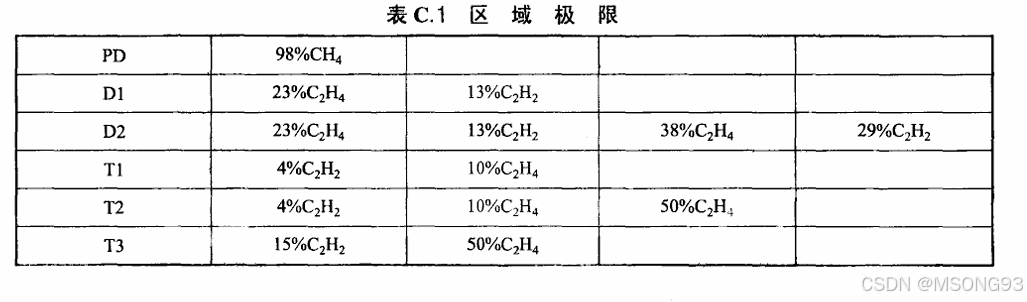
1、根据导则的边界范围计算出相应的点
2、绘制出填充
3、绘制坐标轴
4、绘制图像标记
 render() {
        this.CalcLocaltion();
        this.DrawBackground("谱图:大卫三角");
        this.DrawPolygon(this.context, this.poly_triangle, 'transparent', 'black');

        this.DrawAreaLines();
        this.DrawAreaBrush();

        this.Draw_Axis_CH4();
        this.Draw_Axis_C2H4();
        this.Draw_Axis_C2H2();

        this.DrawLine(this.context, this.pd_txt_p_a, this.pd_txt_p_b, 'black');
        this.context.font = '18px Arial';
        this.context.fillStyle = 'black';
        this.context.fillText("PD",this.pd_txt_p_b.x,this.pd_txt_p_b.y);

        this.DrawLine(this.context, this.t1_txt_p_a, this.t1_txt_p_b, 'black');
        this.context.fillText("T1",this.t1_txt_p_b.x,this.t1_txt_p_b.y);

        this.DrawLine(this.context, this.t2_txt_p_a, this.t2_txt_p_b, 'black');
        this.context.fillText("T2",this.t2_txt_p_b.x,this.t2_txt_p_b.y);

        this.context.fillStyle = 'white';
        this.context.fillText("T3",this.t3_txt_p.x,this.t3_txt_p.y);
        this.context.fillText("D1",this.d1_txt_p.x,this.d1_txt_p.y);
        this.context.fillText("D2",this.d2_txt_p.x,this.d2_txt_p.y);
        this.context.fillText("D+T",this.dt_txt_p.x,this.dt_txt_p.y);
    }
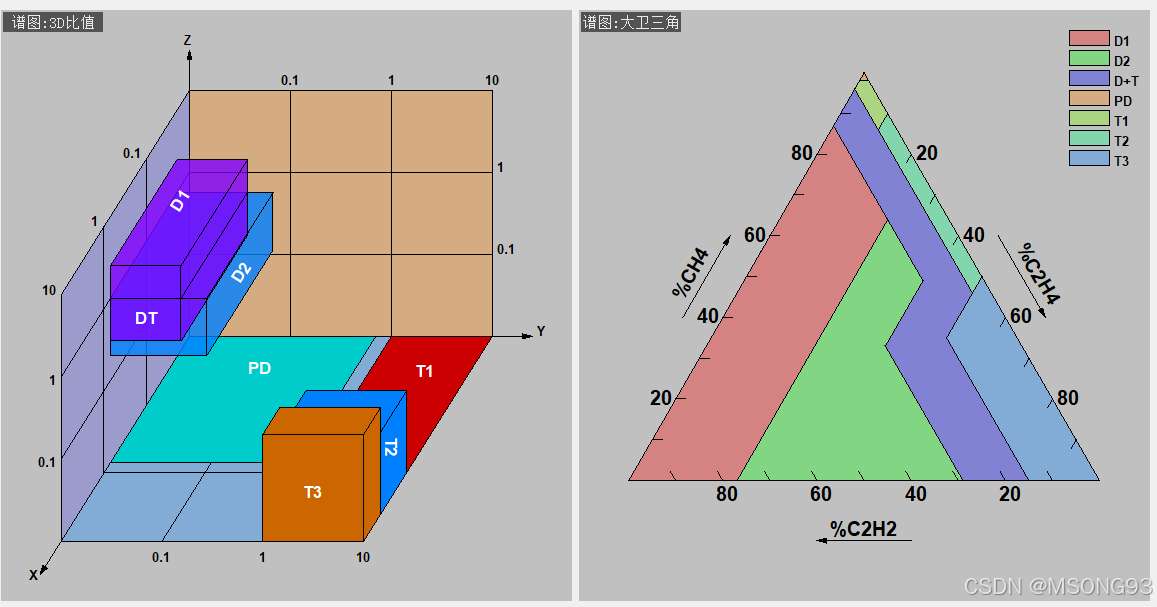
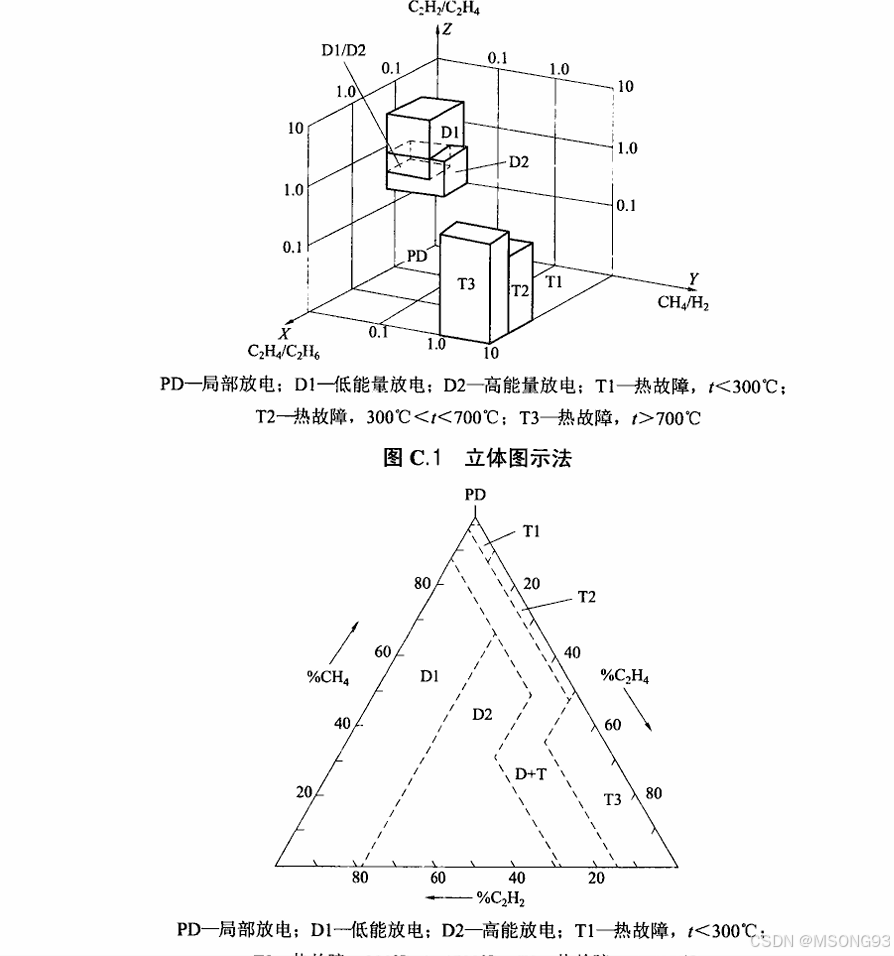
QT 的也是差不多,只不过立体图中的D1,D2 导则上的范围和他的图也自相矛盾的,有现场经验的可以交流一下如何计算,我只是取了个大概的范围
void Analysis_triangle_view::onStartDraw(Canvas &canvas)
{
    DrawTriangle(canvas,mViewData->mPointTop,mViewData->mPointBottom_left,mViewData->mPointBottom_Right);

    /**PD**/
    canvas.drawLine(mViewData->mPoint_PD_A,mViewData->mPoint_PD_B);

    /**D1**/
    canvas.drawLine(mViewData->mPoint_D1_A,mViewData->mPoint_D1_B);
    canvas.drawLine(mViewData->mPoint_D1_C,mViewData->mPoint_D1_D);

    /**D2**/
    canvas.drawLine(mViewData->mPoint_D2_A,mViewData->mPoint_D2_B);
    canvas.drawLine(mViewData->mPoint_D2_C,mViewData->mPoint_D2_D);

    /**T1**/
    canvas.drawLine(mViewData->mPoint_T1_A,mViewData->mPoint_T1_B);
    canvas.drawLine(mViewData->mPoint_T1_C,mViewData->mPoint_T1_D);

    /**T3**/
    canvas.drawLine(mViewData->mPoint_T3_A,mViewData->mPoint_T3_B);
    canvas.drawLine(mViewData->mPoint_T3_C,mViewData->mPoint_T3_D);

    mViewData->mCapofLengceBrush.clear();

    mViewData->mCapofLengceBrush.append(QColor(0xff,0x00,0x00,0x53));
    mViewData->mCapofLengceBrush.append(QColor(0x00,0xff,0x00,0x53));
    mViewData->mCapofLengceBrush.append(QColor(0x0,0x00,0xff,0x53));

    mViewData->mCapofLengceBrush.append(QColor(0xff,0x80,0x00,0x53));
    mViewData->mCapofLengceBrush.append(QColor(0x80,0xff,0x00,0x53));
    mViewData->mCapofLengceBrush.append(QColor(0x00,0xff,0x80,0x53));

    mViewData->mCapofLengceBrush.append(QColor(0x00,0x80,0xff,0x53));

    mViewData->mCapofLegceTxt.clear();
    mViewData->mCapofLegceTxt.append("D1");
    mViewData->mCapofLegceTxt.append("D2");
    mViewData->mCapofLegceTxt.append("D+T");
    mViewData->mCapofLegceTxt.append("PD");
    mViewData->mCapofLegceTxt.append("T1");
    mViewData->mCapofLegceTxt.append("T2");
    mViewData->mCapofLegceTxt.append("T3");

    canvas.setBrush(mViewData->mCapofLengceBrush.at(0));
    canvas.drawPolygon(mViewData->mPolygon_D1);

    canvas.setBrush(mViewData->mCapofLengceBrush.at(1));
    canvas.drawPolygon(mViewData->mPolygon_D2);

    canvas.setBrush(mViewData->mCapofLengceBrush.at(2));
    canvas.drawPolygon(mViewData->mPolygon_DT);

    canvas.setBrush(mViewData->mCapofLengceBrush.at(3));
    canvas.drawPolygon(mViewData->mPolygon_PD);


    canvas.setBrush(mViewData->mCapofLengceBrush.at(4));
    canvas.drawPolygon(mViewData->mPolygon_T1);

    canvas.setBrush(mViewData->mCapofLengceBrush.at(5));
    canvas.drawPolygon(mViewData->mPolygon_T2);

    canvas.setBrush(mViewData->mCapofLengceBrush.at(6));
    canvas.drawPolygon(mViewData->mPolygon_T3);


    DrawArrowLine(mViewData->mLineCh4,"%CH4",canvas);
    DrawArrowLine(mViewData->mLineC2H4,"%C2H4",canvas);
    DrawArrowLine(mViewData->mLineC2H2,"%C2H2",canvas);

    DrawTickCh4(mViewData->mPointBottom_left,mViewData->mPointTop,canvas);
    DrawTickC2H4(mViewData->mPointTop,mViewData->mPointBottom_Right,canvas);
    DrawTickC2H2(mViewData->mPointBottom_Right,mViewData->mPointBottom_left,canvas);

    DrawLengce(canvas);
}
void Analysis_3d_View::onStartDraw(Canvas &canvas)
{
    QBrush br_yz(QColor(0xff,0x80,0x00,0x53));
    QBrush br_xy(QColor(0x00,0x80,0xff,0x53));
    QBrush br_xz(QColor(0x00,0x00,0xff,0x30));
    QBrush br_t1(QColor(0xcc,0x00,0x00));
    QBrush br_pd(QColor(0x00,0xcc,0xcc));
    QBrush br_t2(QColor(0x00,0x80,0xff));
    QBrush br_t3(QColor(0xcc,0x66,0x00));
    QBrush br_d2(QColor(0x00,0x80,0xff,0xcd));
    QBrush br_d1(QColor(0x7F,0x00,0xff,0xcd));

    QPen pen(Qt::black);

    DrawPlane(canvas,mViewData->mPlaneYZ,br_yz,pen);
    DrawPlane(canvas,mViewData->mPlaneXY,br_xy,pen);
    DrawPlane(canvas,mViewData->mPlaneXZ,br_xz,pen);


    Draw_X_Axis(canvas);
    Draw_Y_Axis(canvas);
    Draw_Z_Axis(canvas);


    DrawPlane(canvas,mViewData->mPlanePD,br_pd,pen);
    DrawPlane(canvas,mViewData->mPlaneT1,br_t1,pen);


    Draw_Cube(canvas,mViewData->mCubeT2,br_t2,pen);
    Draw_Cube(canvas,mViewData->mCubeT3,br_t3,pen);
    Draw_Cube(canvas,mViewData->mCubeD2,br_d2,pen);
    Draw_Cube(canvas,mViewData->mCubeD1,br_d1,pen);

    Draw_CubeLine(canvas,mViewData->mCubeD2,pen);

    canvas.drawLine(mViewData->mDT_Line);


    double angle = std::atan2(mViewData->mPlaneXY.mPoint11.y() - mViewData->mPlaneXY.mPoint21.y(), mViewData->mPlaneXY.mPoint11.x() - mViewData->mPlaneXY.mPoint21.x());
    double angleDegrees = qRadiansToDegrees(angle);

    QFont font("Arial", 10, QFont::Bold);
    canvas.setFont(font);
    pen.setColor(Qt::white);
    canvas.setPen(pen);


    Draw_Text(canvas,mViewData->mTxtPD,"PD",0);
    Draw_Text(canvas,mViewData->mTxtT1,"T1",0);
    Draw_Text(canvas,mViewData->mTxtT2,"T2",90);
    Draw_Text(canvas,mViewData->mTxtT3,"T3",0);
    Draw_Text(canvas,mViewData->mTxtD1,"D1",angleDegrees);
    Draw_Text(canvas,mViewData->mTxtD2,"D2",angleDegrees);
    Draw_Text(canvas,mViewData->mTxtDT,"DT",0);
}
3D图 就是计算平面投影,都是些初中的三角函数知识,都比较简单,有兴趣的朋友 可以根据这个思路实现以下


 562
562

 被折叠的 条评论
为什么被折叠?
被折叠的 条评论
为什么被折叠?
 到【灌水乐园】发言


