


 这段内容展示了如何使用numpy创建数据数组,并结合matplotlib进行数据的初步和进一步修饰的图像绘制,包括直线拟合和图表装饰。
在这里插入代码片
import matplotlib.pyplot as plt
import numpy as np
data = [
-1.33,-1.20,-1.09,-1.10,-0.99,-0.94,-0.89,-0.83,-0.71,
-0.70,-0.58-0.51,-0.47,-0.40,-0.27,-0.18,-0.12,-0.03,
-0.00,
+0.08,+0.16,+0.23,+0.30,+0.37,+0.43,+0.50,+0.56,+0.62,+0.68,+0.74,+0.79,+0.84,+0.90,+0.94,+0.97,+0.99,+0.99,
]
data = np.array(data)
x = np.linspace(0,20,len(data))
plt.figure(figsize=(12,12))
plt.plot(x,data,‘r*’)
plt.show()

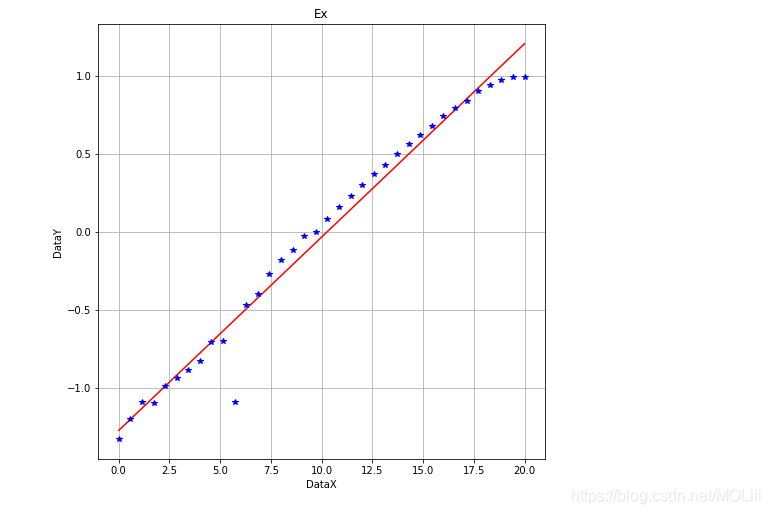
进一步修饰图像
x = np.linspace(0,20,len(data))
A = np.vstack([x, np.ones(len(x))]).T
m, c = np.linalg.lstsq(A, data)[0]
plt.figure(figsize=(8,8))
plt.plot(x, mx+c, ‘r’, label=‘Fitted line’)
plt.plot(x,data,'b’,label=‘Original data’)
plt.xlabel(‘DataX’)
plt.ylabel(‘DataY’)
plt.title(‘Ex’)
plt.grid()
plt.show()
D:\Ana\Win_A6\lib\site-packages\ipykernel_launcher.py:4: FutureWarning: rcond parameter will change to the default of machine precision times max(M, N) where M and N are the input matrix dimensions.
To use the future default and silence this warning we advise to pass rcond=None, to keep using the old, explicitly pass rcond=-1.
after removing the cwd from sys.path.


 3290
3290

 被折叠的 条评论
为什么被折叠?
被折叠的 条评论
为什么被折叠?
 到【灌水乐园】发言


