


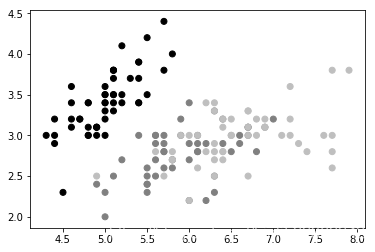
 本文展示了如何使用Python的NumPy和Matplotlib库读取并可视化Iris数据集。通过将数据集的最后一列标签转换为数值,并使用不同的颜色来区分三种不同类型的鸢尾花,实现了数据的直观展示。
data in iris.data.txt file
such as:
4.6,3.2,1.4,0.2,Iris-setosa
5.3,3.7,1.5,0.2,Iris-setosa
7.0,3.2,4.7,1.4,Iris-versicolor
6.4,3.2,4.5,1.5,Iris-versicolor
######################################################################
import numpy as np
import matplotlib.pyplot as plt
label_set = (
b'Iris-setosa',
b'Iris-versicolor',
b'Iris-virginica',
) #tuple
def read_label2(label):
return label_set.index(label)
#The last column that gives the label of each point is a string that can take three possible values—Iris-virginica, Iris-versicolor, and Iris-Vertosa.
data = np.loadtxt('iris.data.txt', delimiter = ',', converters ={4:read_label2})
color_set = ('.00', '.50', '.75')
color_list = [color_set[int(label)] for label in data[:,4]
]
plt.scatter(data[:,0], data[:,1], color=color_list)
plt.show()
data[:4]
output:
array([[5.1, 3.5, 1.4, 0.2, 0. ],
       [4.9, 3. , 1.4, 0.2, 0. ],
       [4.7, 3.2, 1.3, 0.2, 1. ],
       [4.6, 3.1, 1.5, 0.2, 1. ]])


 859
859

 被折叠的 条评论
为什么被折叠?
被折叠的 条评论
为什么被折叠?
 到【灌水乐园】发言


