


We have already seen what amazing discovery, analysis, and data storytelling is possible in Tableau by simply connecting to data and dragging and dropping fields. Now, we'll set off on an adventure with calculations.
Calculations significantly extend the possibilities for analysis, design, and interactivity in Tableau. In this chapter, we'll see how calculations can be used in many different ways. We'll see how calculations can be used to address common issues with data, extend the data by adding new dimensions and measures, and provide additional flexibility in interactivity.
At the same time, while calculations provide incredible power and flexibility, they introduce a level of complexity and sophistication. As you work through this chapter, try to understand the key concepts behind how calculations work in Tableau. As usual, follow along with the examples, but feel free to explore and experiment. The goal is not to merely have a list of calculations you can copy, but to gain knowledge of how calculations can be used to solve problems and add creative functionality to your visualizations and dashboards.
The first half of this chapter focuses on laying a foundation, while the latter gives quite a few practical examples. The topics we will study here are as follows:
- Creating calculations
- Overview of the four main types of calculations
- Row-level examples
- Aggregate-level examples
- Level of detail examples
- Parameters
- Practical examples
- Performance considerations
We'll examine table calculations in the next chapter.
Introduction to calculations
A calculation is often referred to as a Calculated Field in Tableau because, in most cases, when you create a calculation, it will show up as either a new measure or dimension in the data pane. Calculations consist of code that's made up of functions, operations, and references to other fields, parameters, constants, groups, or sets. This code returns a value. Sometimes, this result is per row of data, and sometimes it is done at an aggregate level. We'll consider the difference shortly.
Creating and editing calculations
There are multiple ways to create a calculated field in Tableau:
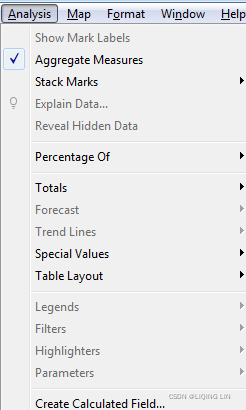
- Select Analysis | Create Calculated Field... from the menu.
 OR
OR 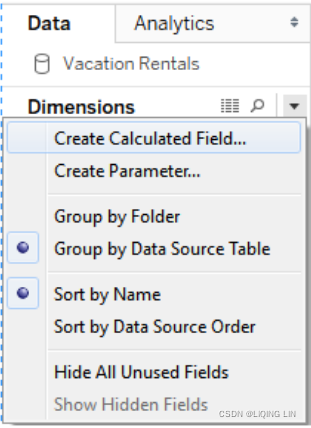
- Use the drop-down menu next to Dimensions in the Data pane.
- Right-click an empty area in the data pane and select Create Calculated Field....
- Use the drop-down menu on a field, set, or parameter in the data pane and select Create | Calculated Field....
- Double-click an empty area on the Rows, Columns, or Measure Values shelves, or in the empty area on the Marks card to create an ad hoc calculation.
https://help.tableau.com/current/pro/desktop/en-us/calculations_calculatedfields_adhoc.htm#:~:text=in%2Dline%20calculations.-,Create%20an%20Ad%2DHoc%20Calculation,or%20elsewhere%20in%20the%20view.
When you start your calculation from an existing field or parameter, the calculation starts as a reference to that field. The calculated field you create will be part of the data source that is currently selected at the time you create it. You can edit an existing calculated field in the data pane by using the drop-down menu and selecting Edit....
The interface for creating and editing calculations looks like this: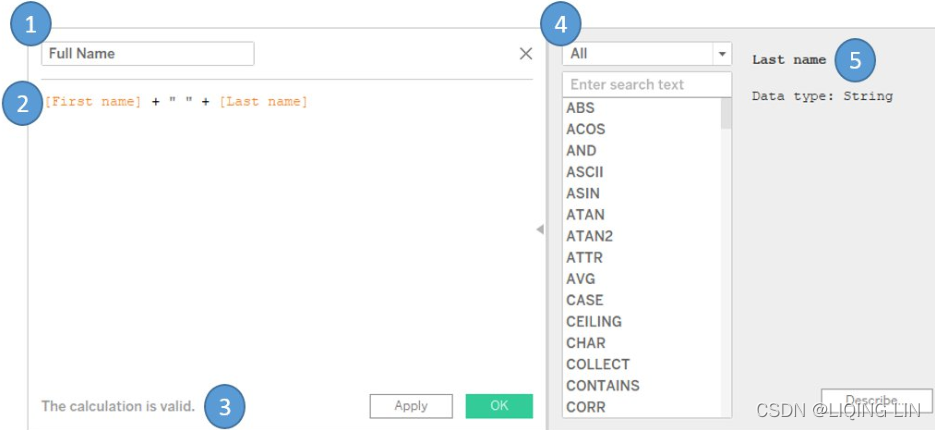
This window has several key features:
- 1. Calculated field name: Enter the name of the calculated field here. Once created, the calculated field will show up as a field in the data pane with the name you entered in this text box.
- 2. Code editor: Enter code in this text area to perform the calculation. The editor includes autocomplete for recognized fields and functions. Additionally, you may drag fields, sets, and parameters from the data pane or view into the code editor to insert them into your code.
You may also select snippets[ˈsnɪpɪts]片段 of your code in the Code editor window and then drag and drop the selected text into the data pane to create additional calculated fields. You may also drag and drop selected code snippets from the code window onto shelves in the view to create ad hoc calculations.https://help.tableau.com/current/pro/desktop/en-us/calculations_calculatedfields_adhoc.htm#:~:text=in%2Dline%20calculations.-,Create%20an%20Ad%2DHoc%20Calculation,or%20elsewhere%20in%20the%20view.
This is an effective way to test portions of complex calculations. - 3. An indicator at the bottom of the editor will alert you with errors in your code. Additionally, if the calculation is used in views or other calculated fields, you will see a drop-down indicator that will let you see the dependencies. Click the Apply button to apply changes to the calculation throughout the workbook while leaving the calculation editor open. The OK button will save the code changes and close the editor. If you wish to discard any changes you've made, click the X button in the upper-right corner to cancel changes.
- 4. The functions list contains all of the functions that you can use in your code. Many of these functions will be used in examples or discussed in this chapter. Tableau groups various functions according to their overall use:Functions in Tableau - Tableau
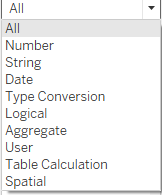
- Number: Mathematical functions, such as rounding, absolute value, trig functions, square roots, and exponents.
- String: Functions that are useful for string manipulation, such as getting a substring, finding a match within a string, replacing parts of a string, and converting a string value to uppercase or lowercase.
- Date: Functions that are useful for working with dates, such as finding the difference between two dates, adding an interval to a date, getting the current date, and transforming strings with non-standard formats into dates.
- Type Conversion: Functions that are useful for converting one type of field to another, such as converting integers into strings, floating point decimals into integers, or strings into dates.
- Logical: Decision-making functions, such as if then else logic or case statements.
- Aggregate: Functions that are used for aggregating such as summing, getting the minimum or maximum values, or calculating standard deviations or variances.
- Pass Through: (only available when connected live to certain databases, such as SQL Server): These functions allow you to pass through raw SQL code to the underlying database and retrieve a returned value at either a row level or aggregate level.
- User: Functions that are used to obtain usernames and check whether the current user is a member of a group. These functions are often used in combination with logical functions to customize the user's experience or to implement user-based security when publishing to Tableau Server or Tableau Online.
- Table calculation: These functions are different from the others. They operate on the aggregated data after it is returned from the underlying data source and just prior to the rendering of the view. These are some of the most powerful functions in Tableau. We'll devote an entire chapter to them so that we can cover them.
-
Spatial Functions
-
Selecting a function in the list or clicking a field, parameter, or function in the code will reveal details about the selection on the right. This is helpful when nesting other calculated fields in your code, when you want to see the code for that particular calculated field, or when you want to understand the syntax for a function.
Additional functions and operators
Tableau supports numerous functions and operators. In addition to the functions that are listed on the calculation screen, Tableau supports the following operators, key words, and syntax conventions:
- AND: Logical and between two Boolean ( true / false ) values or statements
- OR: Logical or between two Boolean values or statements
- NOT: Logical not to negate a Boolean value or statement
- = or ==: Logical equals to test equality of two statements or values (single or double equal signs are equivalent in Tableau's syntax)
- +: Addition of numeric or date values or concatenation of strings
- -: Subtraction of numeric or date values
- *: Multiplication of numeric values
- /: Division of numeric values
- ^: Raise to a power with numeric values
- (): Parenthesis to define order of operations or enclose function arguments
- []: Square brackets to enclose field names
- {}: Curly braces to enclose level of detail calculations
- //: Double slash to start a comment
Tip
Field names that are a single word may optionally be enclosed in brackets when used in calculations. Field names with spaces, special characters, or from secondary data sources must be enclosed in brackets.
Four main types of calculations
The groupings of functions we mentioned previously are important for understanding what kind of functionality is possible. However, the most fundamental way to understand calculations in Tableau is to think of four major types of calculations:
- Row-level calculations: These calculations are performed for every row of underlying data.
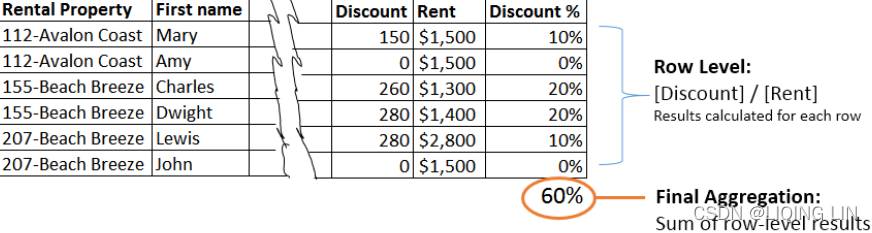
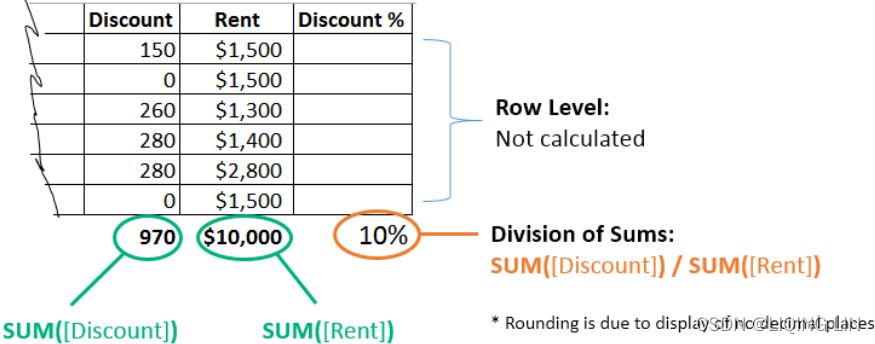
- Aggregate-level calculations: These calculations are performed at an aggregate level, which is usually defined by the dimensions used in the view.
- Level of detail calculations: These special calculations are aggregations that are performed at a specified level of detail, with the results available at the row level. Level of detail calculations allow you to define the level of detail at which
- aggregations are performed and
- then work with the results at a row level
- Table calculations: These calculations are performed at an aggregate level on the table of aggregate data that has been returned by the data source to Tableau.
Transform Values with Table Calculations - Tableau
In this chapter, we'll take a close look at three of the four main types of calculations in Tableau: row level, aggregate level, and level of detail calculations. We'll dive into table calculations in detail in the next chapter, Chapter 5 , Diving Deep with Table Calculations.
Example data
Before we get started with some examples, let's consider a sample dataset that will be used for the examples in this chapter. It's simple and small, which means we will be able to easily see how the calculations are being done.
This dataset is included as Vacation Rentals.csv in the \Learning Tableau\Chapter 04 directory of this book's resources, and is also included in the Chapter 4 workbook as a data source named Vacation Rentals: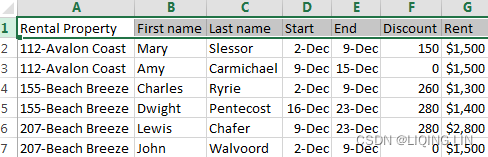
The dataset describes several vacation rental properties, the renters, the start and end dates of the rental period, the discount, and the rent.
Row-level calculations
We might know that the naming convention of the rental unit in the vacation rental data actually gives us the room number and the name of the building. For example, the unit named 207-Beach Breeze is room 207 of the Beach Breeze condo complex.
In the Chapter 04 workbook, create a couple of calculated fields.
Right-click an empty area in the data pane and select Create Calculated Field....
Name the first Room with the following code:
SPLIT(string, delimiter, token number)
SPLIT([Rental Property], "-", 1)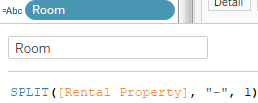
Then, create another calculated field named Building with the following code:
SPLIT([Rental Property], "-", 2) 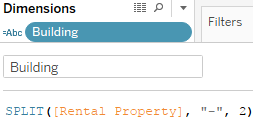
Both of these functions use the Split() function, which splits a string into multiple values and keeps one of those values. This function takes three arguments:
- the string,
- the delimiter (a character or set of characters that separate values), and
- the token number (which value to keep from the split, that is, 1st , 2nd , 3rd , and so on.)
Using the - (dash) as the delimiter, the Room is the first value and Building is the second.
Using the two calculated fields, create a bar chart of Rent per Building and Room, similar to this: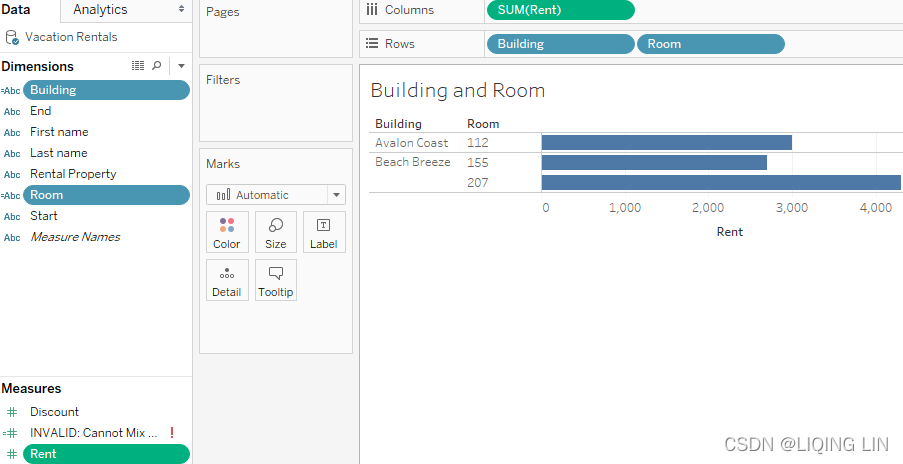
The Building and Room fields show up in the data pane under Dimensions. The calculated dimensions can be used just like any other dimension. They can slice the data, define the level of detail, and group mea
 最低0.47元/天 解锁文章


 1万+
1万+

 被折叠的 条评论
为什么被折叠?
被折叠的 条评论
为什么被折叠?
 到【灌水乐园】发言


