


 本文通过使用Python的pandas库,从纽约市政府公开数据集中获取并分析了2012年各学校毕业生的SAT考试成绩。主要关注了学校的整体表现,包括最高和最低总分的学校,按学生数量分段的平均SAT分数,以及数学成绩显著高于阅读和写作成绩的学校。
You can download the data set from this link: http://catalog.data.gov/dataset/sat-results-e88d7
If you take a quick look at the dataset, you will find a list of schools and their senior student SAT
results for year 2012.
Please use CSV reader to read the data. Note that the first row of the CSV file is column
headers -- use next() function to skip the very first row.
You will need a class with exactly 5 fields for the 5 columns of information you will need from the
CSV file -- you can skip the column named DBN. We will keep a list of schools and do all the
functionality on this list.
import pandas as pd
# I am not using this class since it will waste my time, but we can do some changes for using this class
class School:
def __init__(self, name="", StudentCount=0, Reading=0, Math=0, Writing=0):
self.name=name
self.StudentCount=StudentCount
self.Reading=Reading
self.Math=Math
self.Writing=Writing
df = pd.read_csv('https://data.cityofnewyork.us/api/views/f9bf-2cp4/rows.csv',
encoding="ISO-8859-1")
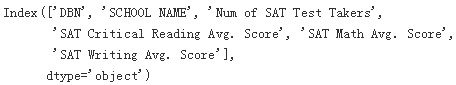
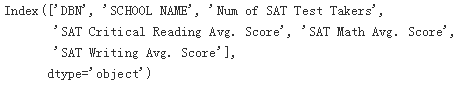
df.columns
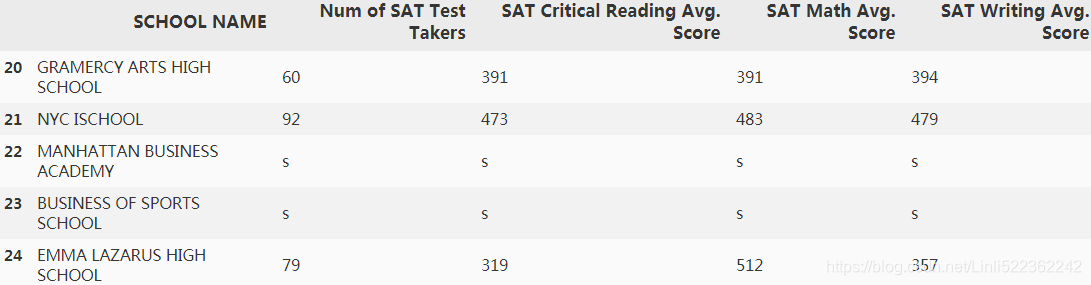
You will need a class with exactly 5 fields for the 5 columns of information you will need from the CSV file -- you can skip the column named DBN. We will keep a list of schools and do all the functionality on this list.
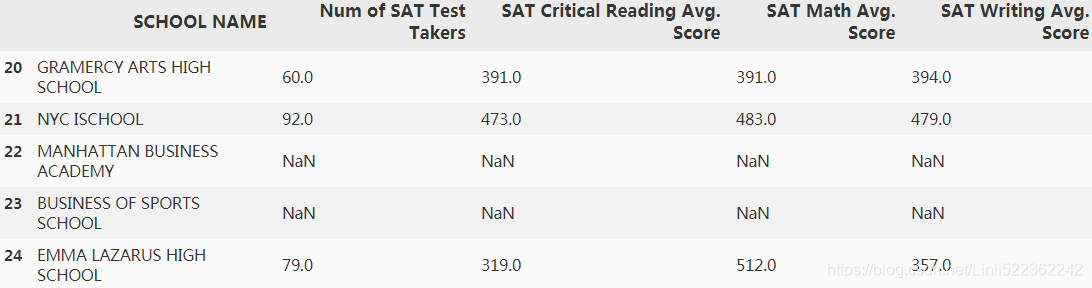
df2=df.drop('DBN',axis=1)
df2.iloc[20:25,:]
Feature 1: Overall Report
Go over all schools and report the schools with minimum and maximum scores. The score of a schools is the sum of the school’s average readings, math and writing scores.
# 1:'Num of SAT Test Takers'
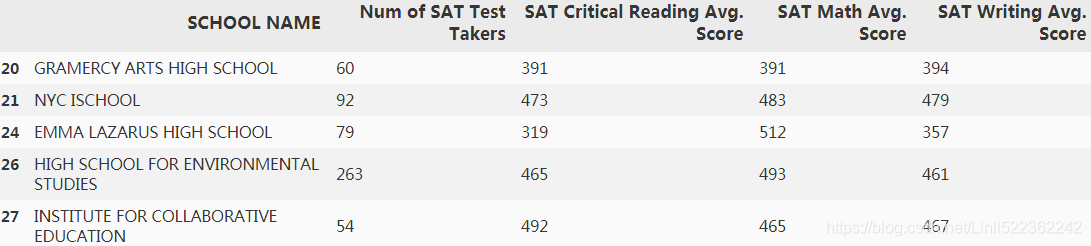
df2=df2[~df2.iloc[:,1].str.contains('s')] #the 's' means na, so we need to drop it #1 solution
df2.iloc[20:25,:]
##################################################################
df = pd.read_csv('https://data.cityofnewyork.us/api/views/f9bf-2cp4/rows.csv',
encoding="ISO-8859-1",
na_values='s') #2 solution
df.columns
df2=df.drop('DBN',axis=1)
df2.iloc[20:25,:]
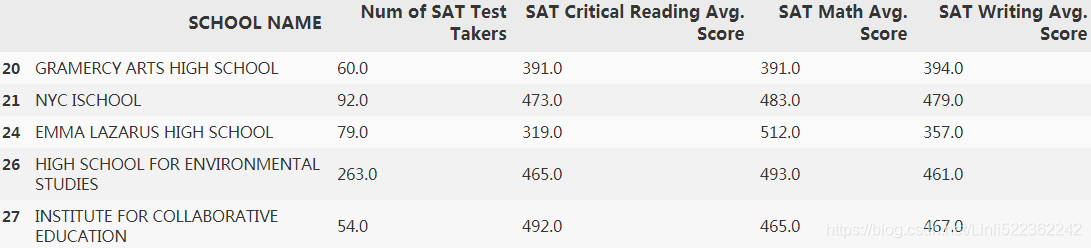
df2=df2.dropna()
df2.iloc[20:25,:]
##################################################################
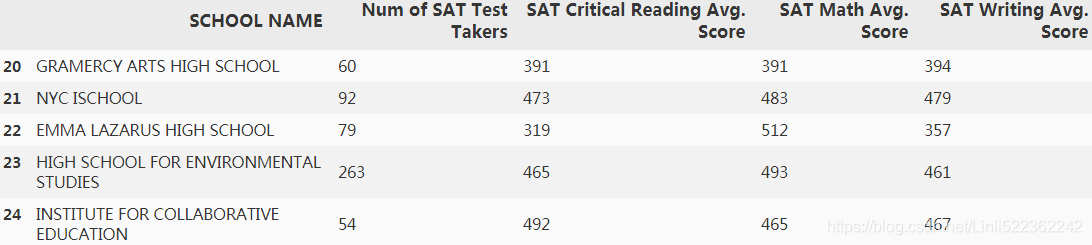
df2.reset_index(inplace=True,drop=True)
df2.iloc[20:25,:]
df2.dtypes
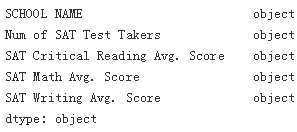
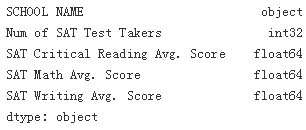
df2['Num of SAT Test Takers']=df2['Num of SAT Test Takers'].astype(int)
df2['SAT Critical Reading Avg. Score']=df2['SAT Critical Reading Avg. Score'].astype(float)
df2['SAT Math Avg. Score']=df2['SAT Math Avg. Score'].astype(float)
df2['SAT Writing Avg. Score']=df2['SAT Writing Avg. Score'].astype(float)
df2.dtypes
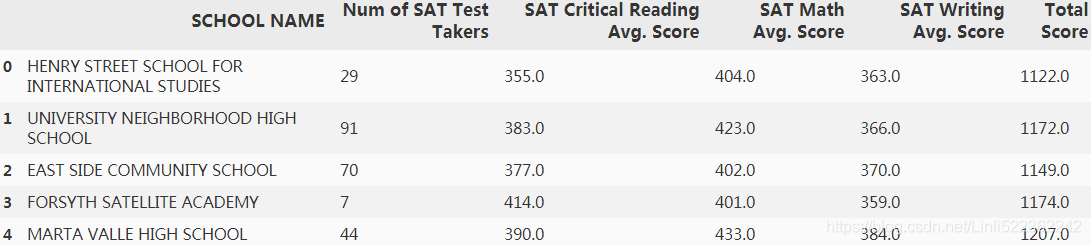
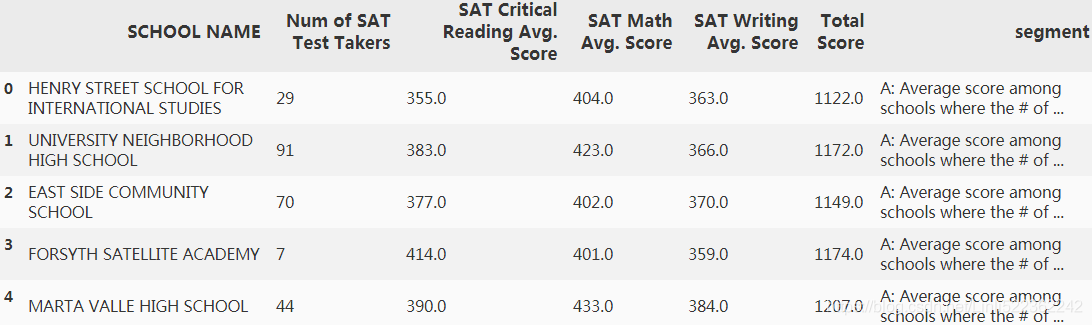
df2['Total Score'] = df2.iloc[:,[2,3,4]].sum(axis=1)
df2.head()
for r in range(df2.shape[0]):
if df2.loc[r,'Total Score'] == df2['Total Score'].max() :
print( 'The best performing school:',df2.loc[r,'SCHOOL NAME'],'with',df2.loc[r,'Total Score'] )
if df2.loc[r,'Total Score'] == df2['Total Score'].min() :
print( 'The worst performing school:',df2.loc[r,'SCHOOL NAME'],'with',df2.loc[r,'Total Score'] )
![]()
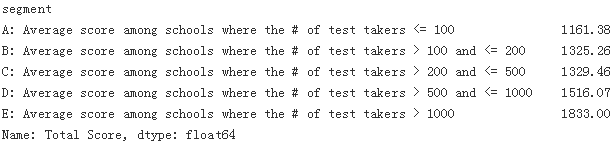
Feature 2: Average Score by Student Count
Report the average SAT score (sum of reading math and writing) grouped (segmented) by the number of students. You should groups as following:
Average score among schools where the # of test takers <= 100
Average score among schools where the # of test takers > 100 and <= 200
Average score among schools where the # of test takers > 200 and <= 500
Average score among schools where the # of test takers > 500 and <= 1000
Average score among schools where the # of test takers > 1000
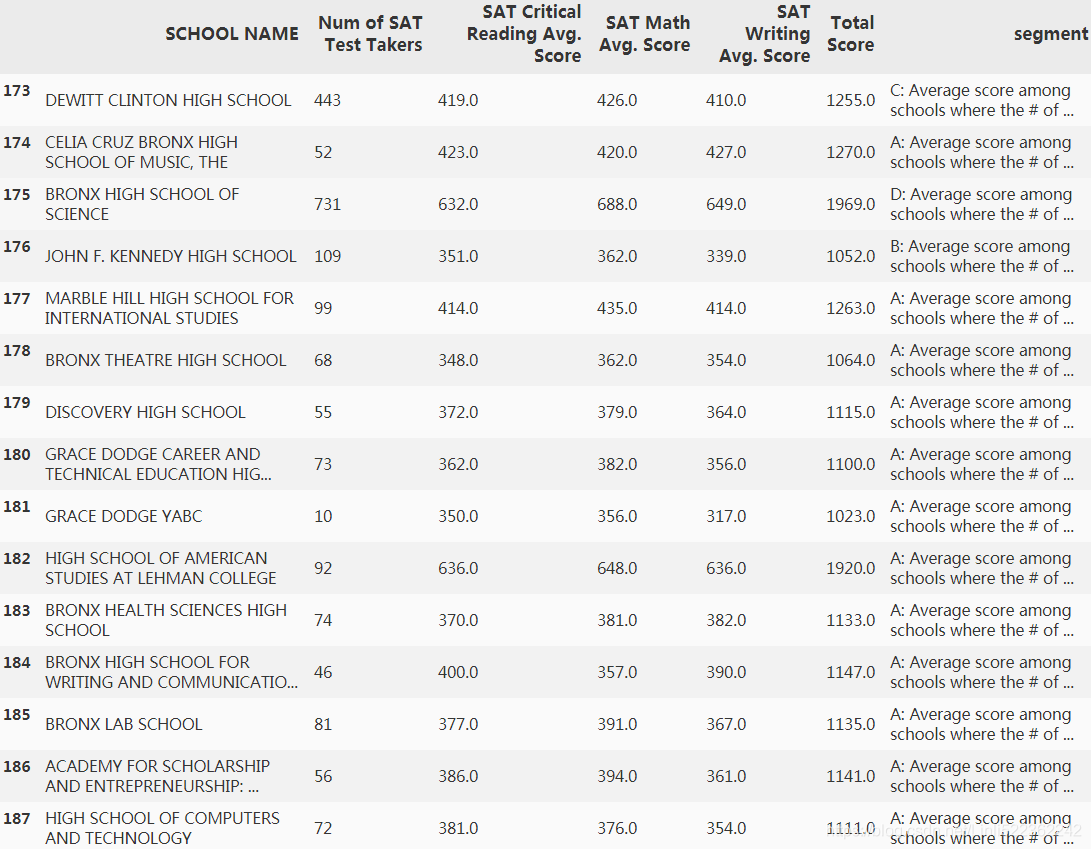
for r in range(df2.shape[0]):
if df2.loc[r,'Num of SAT Test Takers'] <=100 :
df2.loc[r,'segment'] = 'A: Average score among schools where the # of test takers <= 100'
elif df2.loc[r,'Num of SAT Test Takers'] <=200 :
df2.loc[r,'segment'] = 'B: Average score among schools where the # of test takers > 100 and <= 200'
elif df2.loc[r,'Num of SAT Test Takers'] <=500 :
df2.loc[r,'segment'] = 'C: Average score among schools where the # of test takers > 200 and <= 500'
elif df2.loc[r,'Num of SAT Test Takers'] <=1000 :
df2.loc[r,'segment'] = 'D: Average score among schools where the # of test takers > 500 and <= 1000'
else:
df2.loc[r,'segment'] = 'E: Average score among schools where the # of test takers > 1000'
df2.iloc[173:221,:]
print( df2.groupby(['segment']).mean().round(2)['Total Score'] )
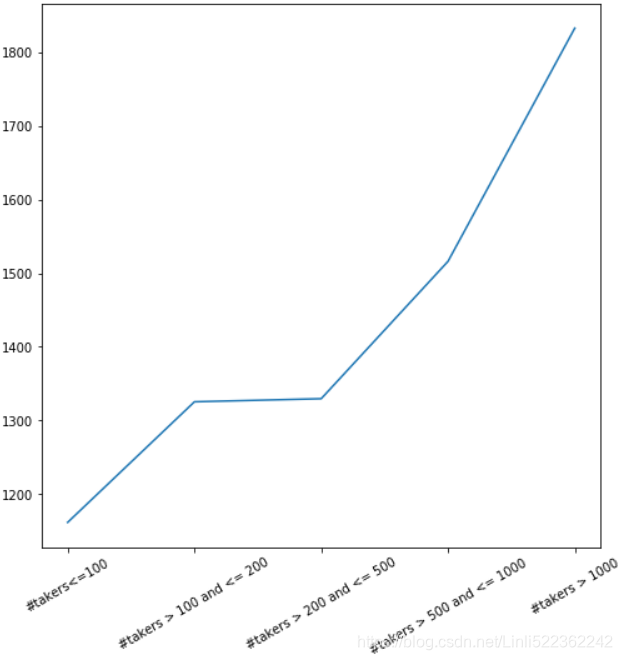
Plot the results on a graph so we can see if there is a correlation between school size and score.
import matplotlib.pyplot as plt
fig = plt.figure(figsize=(8,8))
ax = fig.add_subplot(1,1,1)
ax.plot(df2.groupby(['segment']).mean().round(2)['Total Score'])
labels=ax.set_xticklabels(['#takers<=100', '#takers > 100 and <= 200', '#takers > 200 and <= 500', '#takers > 500 and <= 1000','#takers > 1000'], rotation=30)
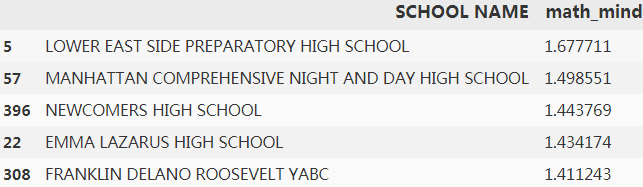
Feature 3: Math Minds
We are looking for particular schools where Math scores are significantly higher than the reading or writing scores. Note that this is not necessarily the school with highest math scores. These are schools whose math scores are higher with a significant percentage from the maximum of reading or writing score.
You want to find the top 5 schools that has the highest math_mind. For each school math_mind percentage can be found as math_mind = math_score / max(read_score, write_score).
df2.head()
for r in range(df2.shape[0]):
df2.loc[r,'math_mind'] = df2.loc[r,'SAT Math Avg. Score']/max(df2.loc[r,'SAT Critical Reading Avg. Score'],
df2.loc[r,'SAT Writing Avg. Score']
)
df2=df2.sort_values(by='math_mind', ascending=False)
df2[['SCHOOL NAME','math_mind']][:5]


 215
215

 被折叠的 条评论
为什么被折叠?
被折叠的 条评论
为什么被折叠?
 到【灌水乐园】发言


