


 本文介绍使用Matplotlib进行数据可视化的多种图表绘制方法,包括折线图、散点图、饼图、柱状图、面积图、雷达图、玫瑰图、3D柱状图和箱线图等,并提供详细的代码示例。
import numpy as np
import pandas as pd
import matplotlib.pyplot as plt

plt.rcParams['font.sans-serif'] = ['STFangsong']
plt.rcParams['axes.unicode_minus'] = False
%config InlineBackend.figure_format = 'svg'
1 数据可视化
1.1 Matplotlib
画图给内部人员看,主要用于数据探索,核心组件包含:
- 画布 – figure() – 绘图的基础
- 坐标系 – subplot() – 一个画布上可以有多个坐标系
- 坐标轴 –
plot()/scatter()/bar()/pie()/hist()/boxplot()- 趋势 - 折线图
- 关系 - 散点图
- 差异 - 柱状图
- 占比 - 饼图
- 分布 - 直方图
- 描述性统计信息 - 箱线图(盒须图)
x = np.linspace(-2 * np.pi, 2* np.pi, 120)
y1 = np.sin(x)
y2 = np.cos(x)
# 创建画布
plt.figure(figsize = (6,4),dpi = 120)
# 创建坐标系
ax = plt.subplot(1,1,1)

ax.spines['top'].set_visible(False)
ax.spines['right'].set_visible(False)
ax.spines['bottom'].set_position('center')
ax.spines['left'].set_position('center')
# 绘图 - 定制线条样式及颜色
plt.plot(x, y1, color = np.random.rand(3),marker = '*',linestyle = '-',label = '正弦')
plt.plot(x, y2, color = np.random.rand(3),marker = 'p',linestyle = '--',label = '余弦')
# 图表标题
plt.title(r'正弦$sin(\alpha)$和余弦$cos(\beta)$曲线')
# 图表图例 默认在最佳位置(best)可更改
# best、upper right、upper left、lower left、lower right、right、center left、center right、lower center、upper center、center
plt.legend(loc = 'best')
# 定制网格线
plt.grid(axis = 'y',alpha = 0.25,linestyle = '--')
plt.show()

# 创建画布
plt.figure(figsize = (8,4),dpi = 120)
# 创建多个坐标系
plt.subplot(2,2,1)  # 第1行1列 第1个位置
plt.plot(x, y1, color = np.random.rand(3),marker = '*',linestyle = '-',label = '正弦')
plt.subplot(2,2,2)  # 第1行2列 第2个位置
plt.plot(x, y2, color = np.random.rand(3),marker = 'p',linestyle = '--',label = '余弦')
plt.subplot(2,1,2)  # 第2行1列 第2个位置  占据整行
# 绘制散点图,不能定制linestyle但可以根据值的大小设置阶梯色(C参数,cmap指定阶梯色颜色)以及点大小(S参数)
plt.scatter(x, y1, c = np.abs(y1 * 20),cmap = 'spring',marker = '*',s = np.abs(y1*20),label = '正弦')
plt.plot(x, y2, color = np.random.rand(3),marker = 'p',linestyle = '-.',label = '余弦')
plt.show()

# 安装gif插件
# !pip install gif
import gif
import IPython.display as disp

# 绘制动图
@gif.frame
def draw(xi):
    plt.subplots(1, figsize=(10, 4), dpi=120)
    plt.plot(xi, np.sin(xi), marker='x', color='r', linestyle='--')
    plt.xlim([-7, 7])
    plt.xticks(np.arange(-2 * np.pi, 2 * np.pi + 1, 0.5 * np.pi))
    plt.ylim([-1, 1])


frames = []
x = np.linspace(-2 * np.pi, 2 * np.pi, 120)
for i in range(x.size // 4):
    frame = draw(x[:(i + 1) * 4])
    frames.append(frame)
gif.save(frames, '../files/result/a.gif', duration=0.2, unit='s')
disp.HTML('<img src="a.gif">')
饼图
# 饼图
plt.figure(figsize=(6, 4), dpi=120)
data = np.random.randint(100, 500, 7)
print(data)
labels = ['苹果', '香蕉', '桃子', '荔枝', '石榴', '山竹', '榴莲']
plt.pie(
    # 数据
    data,
    # 自动显示百分比
    autopct='%.1f%%',
    # 饼图的半径
    radius=1,
    # 百分比文字到圆心的距离
    pctdistance=0.8,
    # 分离距离
    explode=[0.05, 0, 0.1, 0, 0, 0, 0],
    # 显示阴影
    shadow=True,
    # 字体属性
    textprops=dict(fontsize=8, color='k'),
    # 楔子属性
    wedgeprops=dict(linewidth=1, width=0.35),
    # 标签
    labels=labels
)
# plt.legend(loc = 'upper right')
plt.show()
[155 483 166 234 476 272 361]

柱状图
# 柱状图
labels = np.arange(4)
group1 = np.random.randint(20, 50, 4)
print(group1)
group2 = np.random.randint(10, 60, 4)
print(group2)
# group后面的参数是柱子的宽度。总宽为1,设置为0.5则铺满。默认居中。
# 为避免重叠,令第一个柱子显示位置向前一半第二个珠子向后一半
plt.bar(labels - 0.1, group1, 0.2, label='销售A组')
plt.bar(labels + 0.1, group2, 0.2, label='销售B组')
# labels运算时还是0-3,而显示为列表(Q1、Q2、...)
plt.xticks(np.arange(4), labels=['Q1', 'Q2', 'Q3', 'Q4'])
plt.legend()
plt.show()
[44 49 38 27]
[49 47 18 35]

# 堆叠柱状图
labels = ['Q1', 'Q2', 'Q3', 'Q4']
group1 = np.random.randint(20, 50, 4)
print(group1)
group2 = np.random.randint(10, 60, 4)
print(group2)
group3 = np.random.randint(30, 40, 4)
print(group3)
plt.bar(labels, group1, 0.4, label='销售A组')
# 通过bottom属性设置数据堆叠
# bottom = group1 - group2的底部为group1
plt.bar(labels, group2, 0.4, bottom=group1, label='销售B组')
plt.bar(labels, group3, 0.4, bottom=group1 + group2, label='销售C组')
plt.legend()
plt.show()
[44 39 44 24]
[35 34 15 11]
[34 34 33 38]

面积图
# 面积图
plt.figure(figsize=(6, 3))
days = np.arange(7)
sleeping = [7, 8, 6, 6, 7, 8, 10]
eating = [2, 3, 2, 1, 2, 3, 2]
working = [7, 8, 7, 8, 6, 2, 3]
playing = [8, 5, 9, 9, 9, 11, 9]
plt.stackplot(days, sleeping, eating, working, playing)
plt.legend(['睡觉', '吃饭', '工作', '玩耍'], fontsize=10)
plt.show()

雷达图 - 映射在极坐标的折线图
# 雷达图(极坐标折线图)
labels = np.array(['速度', '力量', '经验', '防守', '发球', '技术'])
malong_values = np.array([93, 95, 98, 92, 96, 97])
shuigu_values = np.array([30, 40, 65, 80, 45, 60])
angles = np.linspace(0, 2 * np.pi, labels.size, endpoint=False)
# 加一条数据让图形闭合
malong_values = np.concatenate((malong_values, [malong_values[0]]))
shuigu_values = np.concatenate((shuigu_values, [shuigu_values[0]]))
angles = np.concatenate((angles, [angles[0]]))
plt.figure(figsize=(4, 4), dpi=120)
ax = plt.subplot(projection='polar')
# 绘图和填充
plt.plot(angles, malong_values, color='r', marker='o', linestyle='--', linewidth=2)
plt.fill(angles, malong_values, color='r', alpha=0.3)
plt.plot(angles, shuigu_values, color='y', marker='o', linestyle='--', linewidth=2)
plt.fill(angles, shuigu_values, color='y', alpha=0.2)
# 设置文字标签
ax.set_thetagrids(angles[:-1] * 180 / np.pi, labels, fontsize=10)
# 设置网格线
ax.set_rgrids([0, 20, 40, 60, 80, 100], fontsize=10)
ax.legend(['马龙', '水谷隼'])
plt.show()

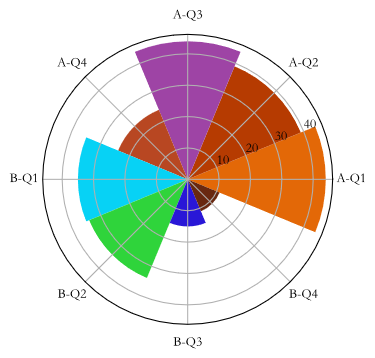
玫瑰图 - 映射在极坐标的柱状图
# 玫瑰图(圆形柱状图)
x = np.array([f'A-Q{i}' for i in range(1, 5)] + [f'B-Q{i}' for i in range(1, 5)])
y = np.array(group1.tolist() + group2.tolist())
print(y)
theta = np.linspace(0, 2 * np.pi, x.size, endpoint=False)
width = 2 * np.pi / x.size
colors = np.random.rand(8, 3)
# 将柱状图投影到极坐标,将坐标系映射到极坐标
ax = plt.subplot(projection='polar')
plt.bar(theta, y, width=width, color=colors, bottom=0)
ax.set_thetagrids(theta * 180 / np.pi, x, fontsize=10)
plt.show()
[44 39 44 24 35 34 15 11]
3D 柱状图
# 3D柱状图
# 将整个平面(X,Z)放在一个坐标轴(Y)上
plt.figure(figsize=(8, 4), dpi=120)
# 将坐标系映射到3d
ax = plt.subplot(projection='3d')

colors = ['r', 'g', 'b']
yticks = range(2020, 2017, -1)
for idx, y in enumerate(yticks):
    x_data = [f'{x}季度' for x in '一二三四']
    z_data = np.random.randint(100, 600, 4)
    ax.bar(x_data, z_data, zs=y, zdir='y', color=colors[idx], alpha=0.5)
ax.set_xlabel('季度')
ax.set_ylabel('年份')
ax.set_zlabel('销量')
ax.set_yticks(yticks)
plt.show()

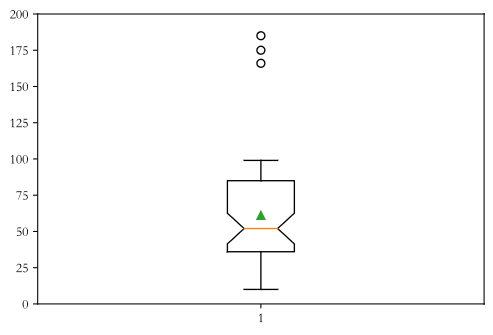
箱线图
# 箱线图
data = np.random.randint(10, 100, 50)
data = np.append(data, 185)
data = np.append(data, 175)
data = np.append(data, 166)
print(pd.Series(data).describe())
plt.boxplot(data, whis=1.5, showmeans=True, notch=True)
plt.ylim([0, 200])
plt.show()
count     53.000000
mean      61.132075
std       38.412757
min       10.000000
25%       36.000000
50%       52.000000
75%       85.000000
max      185.000000
dtype: float64
!pip install jieba
Looking in indexes: https://pypi.doubanio.com/simple
Requirement already satisfied: jieba in d:\programs\python\python38\lib\site-packages (0.42.1)
import jieba
import re

# 读取文件
with open('../files/data/test.txt',encoding = 'utf-8') as file:
    content = file.read()
# 用空格替换换行符
content = re.sub(r'\s','',content)
# 用jieba分词
words = jieba.lcut(content)
len(words)
Building prefix dict from the default dictionary ...
Loading model from cache C:\Users\zs\AppData\Local\Temp\jieba.cache
Loading model cost 0.537 seconds.
Prefix dict has been built successfully.


3340
# 获取停词文件
def get_stopwords(file):
    with open(file, 'r',encoding = 'utf-8') as file:
        stopword_list = [word.strip('\n') for word in file.readlines()]
    return stopword_list


stop_words1 = get_stopwords('../files/data/哈工大停用词表.txt')
stop_words2 = get_stopwords('../files/data/中文停用词库.txt')
# 将两个停词文件合并为集合 - 集合查找元素效率更高
stop_words = set(stop_words1 + stop_words2)
stop_words
{'"',
 '#',
 '$',
 '&',
 "'",
 '(',
 ')',
 '*',
 '+',
 ',',
 '-',
 '-- ',
 '. ',
 '...',
 '......',
 '...................',
 './',
 '.一',
 '.数',
 '.日 ',
 '/',
 '//',
 '0',
 '1',
 '2',
 '3',
 '4',
 '5',
 '6',
 '7',
 '8',
 '9',
 ':',
 '://',
 '::',
 ';',
 '<',
 '=',
 '>',
 '?',
 '? ',
 '@',
 'Lex ',
 '[',
 ']',
 '_',
 'exp ',
 'sub',
 'sup',
 '}',
 '~~~~',
 '·',
 '×',
 '× ',
 '××× ',
 'Δ',
 'Ψ',
 'γ',
 'μ',
 'φ',
 'φ.',
 'В',
 '—',
 '——',
 '———',
 '‘',
 '’',
 '’‘ ',
 '“',
 '”',
 '”,',
 '……',
 '…………………………………………………③',
 '′∈',
 '′|',
 '℃ ',
 'Ⅲ',
 '↑',
 '→',
 '∈[ ',
 '∪φ∈',
 '≈ ',
 '①',
 '②',
 '②c',
 '③',
 '③]',
 '④',
 '⑤',
 '⑥',
 '⑦',
 '⑧',
 '⑨',
 '⑩',
 '──',
 '■',
 '▲',
 '、',
 '。',
 '〉',
 '《',
 '》',
 '》),',
 '」',
 '『',
 '』',
 '【',
 '】',
 '〔',
 '〕',
 '〕〔',
 '㈧ ',
 '一',
 '一.',
 '一一',
 '一个',
 '一些',
 '一何',
 '一切',
 '一则',
 '一方面',
 '一旦',
 '一来',
 '一样',
 '一番',
 '一直',
 '一般',
 '一转眼',
 '万一',
 '上',
 '上下',
 '下',
 '不',
 '不仅',
 '不但',
 '不光',
 '不单',
 '不只',
 '不外乎',
 '不如',
 '不妨',
 '不尽',
 '不尽然',
 '不得',
 '不怕',
 '不惟',
 '不成',
 '不拘',
 '不料',
 '不是',
 '不比',
 '不然',
 '不特',
 '不独',
 '不管',
 '不至于',
 '不若',
 '不论',
 '不过',
 '不问',
 '与',
 '与其',
 '与其说',
 '与否',
 '与此同时',
 '且',
 '且不说',
 '且说',
 '两者',
 '个',
 '个别',
 '临',
 '为',
 '为了',
 '为什么',
 '为何',
 '为止',
 '为此',
 '为着',
 '乃',
 '乃至',
 '乃至于',
 '么',
 '之',
 '之一',
 '之所以',
 '之类',
 '乌乎',
 '乎',
 '乘',
 '也',
 '也好',
 '也就是说',
 '也罢',
 '了',
 '二来',
 '于',
 '于是',
 '于是乎',
 '云云',
 '云尔',
 '些',
 '亦',
 '人',
 '人们',
 '人家',
 '什么',
 '什么样',
 '今',
 '介于',
 '仍',
 '仍旧',
 '从',
 '从此',
 '从而',
 '他',
 '他人',
 '他们',
 '以',
 '以上',
 '以为',
 '以便',
 '以免',
 '以及',
 '以故',
 '以期',
 '以来',
 '以至',
 '以至于',
 '以致',
 '们',
 '任',
 '任何',
 '任凭',
 '似的',
 '但',
 '但凡',
 '但是',
 '何',
 '何以',
 '何况',
 '何处',
 '何时',
 '余外',
 '作为',
 '你',
 '你们',
 '使',
 '使得',
 '例如',
 '依',
 '依据',
 '依照',
 '便于',
 '俺',
 '俺们',
 '倘',
 '倘使',
 '倘或',
 '倘然',
 '倘若',
 '借',
 '假使',
 '假如',
 '假若',
 '傥然',
 '像',
 '儿',
 '元/吨',
 '先不先',
 '光是',
 '全体',
 '全部',
 '兮',
 '关于',
 '其',
 '其一',
 '其中',
 '其二',
 '其他',
 '其余',
 '其它',
 '其次',
 '具体地说',
 '具体说来',
 '兼之',
 '内',
 '再',
 '再其次',
 '再则',
 '再有',
 '再者',
 '再者说',
 '再说',
 '冒',
 '冲',
 '况且',
 '几',
 '几时',
 '凡',
 '凡是',
 '凭',
 '凭借',
 '出于',
 '出来',
 '分别',
 '则',
 '则甚',
 '别',
 '别人',
 '别处',
 '别是',
 '别的',
 '别管',
 '别说',
 '到',
 '前后',
 '前此',
 '前者',
 '加之',
 '加以',
 '即',
 '即令',
 '即使',
 '即便',
 '即如',
 '即或',
 '即若',
 '却',
 '去',
 '又',
 '又及',
 '及',
 '及其',
 '及至',
 '反之',
 '反而',
 '反过来',
 '反过来说',
 '受到',
 '另',
 '另一方面',
 '另外',
 '另悉',
 '只',
 '只当',
 '只怕',
 '只是',
 '只有',
 '只消',
 '只要',
 '只限',
 '叫',
 '叮咚',
 '可',
 '可以',
 '可是',
 '可见',
 '各',
 '各个',
 '各位',
 '各种',
 '各自',
 '同',
 '同时',
 '后',
 '后者',
 '向',
 '向使',
 '向着',
 '吓',
 '吗',
 '否则',
 '吧',
 '吧哒',
 '吱',
 '呀',
 '呃',
 '呕',
 '呗',
 '呜',
 '呜呼',
 '呢',
 '呵',
 '呵呵',
 '呸',
 '呼哧',
 '咋',
 '和',
 '咚',
 '咦',
 '咧',
 '咱',
 '咱们',
 '咳',
 '哇',
 '哈',
 '哈哈',
 '哉',
 '哎',
 '哎呀',
 '哎哟',
 '哗',
 '哟',
 '哦',
 '哩',
 '哪',
 '哪个',
 '哪些',
 '哪儿',
 '哪天',
 '哪年',
 '哪怕',
 '哪样',
 '哪边',
 '哪里',
 '哼',
 '哼唷',
 '唉',
 '唯有',
 '啊',
 '啐',
 '啥',
 '啦',
 '啪达',
 '啷当',
 '喂',
 '喏',
 '喔唷',
 '喽',
 '嗡',
 '嗡嗡',
 '嗬',
 '嗯',
 '嗳',
 '嘎',
 '嘎登',
 '嘘',
 '嘛',
 '嘻',
 '嘿',
 '嘿嘿',
 '因',
 '因为',
 '因了',
 '因此',
 '因着',
 '因而',
 '固然',
 '在',
 '在下',
 '在于',
 '地',
 '基于',
 '处在',
 '多',
 '多么',
 '多少',
 '大',
 '大家',
 '她',
 '她们',
 '好',
 '如',
 '如上',
 '如上所述',
 '如下',
 '如何',
 '如其',
 '如同',
 '如是',
 '如果',
 '如此',
 '如若',
 '始而',
 '孰料',
 '孰知',
 '宁',
 '宁可',
 '宁愿',
 '宁肯',
 '它',
 '它们',
 '对',
 '对于',
 '对待',
 '对方',
 '对比',
 '将',
 '小',
 '尔',
 '尔后',
 '尔尔',
 '尚且',
 '就',
 '就是',
 '就是了',
 '就是说',
 '就算',
 '就要',
 '尽',
 '尽管',
 '尽管如此',
 '岂但',
 '己',
 '已',
 '已矣',
 '巴',
 '巴巴',
 '并',
 '并且',
 '并非',
 '庶乎',
 '庶几',
 '开外',
 '开始',
 '归',
 '归齐',
 '当',
 '当地',
 '当然',
 '当着',
 '彼',
 '彼时',
 '彼此',
 '往',
 '待',
 '很',
 '得',
 '得了',
 '怎',
 '怎么',
 '怎么办',
 '怎么样',
 '怎奈',
 '怎样',
 '总之',
 '总的来看',
 '总的来说',
 '总的说来',
 '总而言之',
 '恰恰相反',
 '您',
 '惟其',
 '慢说',
 '我',
 '我们',
 '或',
 '或则',
 '或是',
 '或曰',
 '或者',
 '截至',
 '所',
 '所以',
 '所在',
 '所幸',
 '所有',
 '才',
 '才能',
 '打',
 '打从',
 '把',
 '抑或',
 '拿',
 '按',
 '按照',
 '换句话说',
 '换言之',
 '据',
 '据此',
 '接着',
 '故',
 '故此',
 '故而',
 '数/',
 '旁人',
 '无',
 '无宁',
 '无论',
 '既',
 '既往',
 '既是',
 '既然',
 '时候',
 '是',
 '是以',
 '是的',
 '曾',
 '替',
 '替代',
 '最',
 '有',
 '有些',
 '有关',
 '有及',
 '有时',
 '有的',
 '有的是',
 '望',
 '朝',
 '朝着',
 '末##末',
 '本',
 '本人',
 '本地',
 '本着',
 '本身',
 '来',
 '来着',
 '来自',
 '来说',
 '极了',
 '果然',
 '果真',
 '某',
 '某个',
 '某些',
 '某某',
 '根据',
 '欤',
 '正值',
 '正如',
 '正巧',
 '正是',
 '此',
 '此地',
 '此处',
 '此外',
 '此时',
 '此次',
 '此间',
 '毋宁',
 '每',
 '每当',
 '比',
 '比及',
 '比如',
 '比方',
 '没奈何',
 '沿',
 '沿着',
 '漫说',
 '焉',
 '然则',
 '然后',
 '然而',
 '照',
 '照着',
 '犹且',
 '犹自',
 '甚且',
 '甚么',
 '甚或',
 '甚而',
 '甚至',
 '甚至于',
 '用',
 '用来',
 '由',
 '由于',
 '由是',
 '由此',
 '由此可见',
 '的',
 '的确',
 '的话',
 '直到',
 '相对而言',
 '省得',
 '看',
 '眨眼',
 '着',
 '着呢',
 '矣',
 '矣乎',
 '矣哉',
 '离',
 '种',
 '竟而',
 '第',
 '第二',
 '等',
 '等到',
 '等等',
 '简言之',
 '管',
 '类如',
 '紧接着',
 '纵',
 '纵令',
 '纵使',
 '纵然',
 '经',
 '经过',
 '结果',
 '给',
 '继之',
 '继后',
 '继而',
 '综上所述',
 '罢了',
 '者',
 '而',
 '而且',
 '而况',
 '而后',
 '而外',
 '而已',
 '而是',
 '而言',
 '能',
 '能否',
 '腾',
 '自',
 '自个儿',
 '自从',
 '自各儿',
 '自后',
 '自家',
 '自己',
 '自打',
 '自身',
 '至',
 '至于',
 '至今',
 '至若',
 '致',
 '般的',
 '若',
 '若夫',
 '若是',
 '若果 ',
 '若非',
 '莫不然',
 '莫如',
 '莫若',
 '虽',
 '虽则',
 '虽然',
 '虽说',
 '被',
 '要',
 '要不',
 '要不是',
 '要不然',
 '要么',
 '要是',
 '譬喻',
 '譬如',
 '让',
 '许多',
 '论',
 '设使',
 '设或',
 '设若',
 '诚如',
 '诚然',
 '该',
 '说来',
 '诸',
 '诸位',
 '诸如',
 '谁',
 '谁人',
 '谁料',
 '谁知',
 '贼死',
 '赖以',
 '赶',
 '起',
 '起见',
 '趁',
 '趁着',
 '越是',
 '距',
 '跟',
 '较',
 '较之',
 '边',
 '过',
 '还',
 '还是',
 '还有',
 '还要',
 '这',
 '这一来',
 '这个',
 '这么',
 '这么些',
 '这么样',
 '这么点儿',
 '这些',
 '这会儿',
 '这儿',
 '这就是说',
 '这时',
 '这样',
 '这次',
 '这般',
 '这边',
 '这里',
 '进而',
 '连',
 '连同',
 '逐步',
 '通过',
 '遵循',
 '遵照',
 '那',
 '那个',
 '那么',
 '那么些',
 '那么样',
 '那些',
 '那会儿',
 '那儿',
 '那时',
 '那样',
 '那般',
 '那边',
 '那里',
 '都',
 '鄙人',
 '鉴于',
 '针对',
 '阿',
 '除',
 '除了',
 '除外',
 '除开',
 '除此之外',
 '除非',
 '随',
 '随后',
 '随时',
 '随着',
 '难道说',
 '非但',
 '非徒',
 '非特',
 '非独',
 '靠',
 '顺',
 '顺着',
 '首先',
 '!',
 '#',
 '%',
 '&',
 ''',
 '(',
 ')',
 ')÷(1-',
 ')、',
 '*',
 '+',
 '+ξ',
 '++',
 ',',
 ',也 ',
 '-',
 '-β',
 '-- ',
 '-[*]-',
 '.',
 '/',
 '0:2 ',
 '1. ',
 '12%',
 '2.3%',
 '5:0  ',
 ':',
 ';',
 '<',
 '<±',
 '<Δ',
 '<λ',
 '<φ',
 '<<',
 '=',
 '=″',
 '=☆',
 '=(',
 '=-',
 '=[',
 '={',
 '>',
 '>λ',
 '?',
 'A',
 'LI',
 'R.L.',
 'ZXFITL',
 '[',
 '[①①]',
 '[①②]',
 '[①③]',
 '[①④]',
 '[①⑤]',
 '[①⑥]',
 '[①⑦]',
 '[①⑧]',
 '[①⑨]',
 '[①A]',
 '[①B]',
 '[①C]',
 '[①D]',
 '[①E]',
 '[①]',
 '[①a]',
 '[①c]',
 '[①d]',
 '[①e]',
 '[①f]',
 '[①g]',
 '[①h]',
 '[①i]',
 '[①o]',
 '[②',
 '[②①]',
 '[②②]',
 '[②③]',
 '[②④',
 '[②⑤]',
 '[②⑥]',
 '[②⑦]',
 '[②⑧]',
 '[②⑩]',
 '[②B] ',
 '[②G]',
 '[②]',
 '[②a]',
 '[②b]',
 '[②c] ',
 '[②d]',
 '[②e]',
 '[②f]',
 '[②g]',
 '[②h]',
 '[②i]',
 '[②j]',
 '[③①]',
 '[③⑩]',
 '[③F]',
 '[③]',
 '[③a]',
 '[③b]',
 '[③c]',
 '[③d]',
 '[③e]',
 '[③g]',
 '[③h]',
 '[④]',
 '[④a]',
 '[④b]',
 '[④c]',
 '[④d]',
 '[④e]',
 '[⑤]',
 '[⑤]]',
 '[⑤a]',
 '[⑤b]',
 '[⑤d]',
 '[⑤e]',
 '[⑤f]',
 '[⑥]',
 '[⑦]',
 '[⑧]',
 '[⑨] ',
 '[⑩]',
 '[*]',
 '[-',
 '[]',
 ']',
 ']∧′=[ ',
 '][',
 '_',
 'a]',
 'b]',
 'c]',
 'e]',
 'f]',
 'ng昉',
 '{-',
 '}',
 '}>',
 '~',
 '~±',
 '~+'}
# 从分词的结果中去掉没有实际意义的停词
words = [word for word in words if word not in stop_words]
print(len(words))
2378
# 安装wordCloud
# !pip install wordcloud
from wordcloud import WordCloud
from PIL import Image

txt = ' '.join(words)
mask = np.array(Image.open('../files/data/china.jpg'))
wc = WordCloud(font_path='E:\HTML\肥宅快乐体.ttf',
              width = 1200,
              height = 800,
              mask = mask,
              max_words=100,
              background_color='white')
wc.generate(txt)
wc.to_file('../files/result/WordCloud.png')
<wordcloud.wordcloud.WordCloud at 0x1ef2a937220>

Seaborn
对Matplotlib做了封装,用默认的配置减少绘图参数
以下是几个简单的例子以作比较
# 安装seaborn
# !pip install seaborn
import seaborn as sns

# 获取小费数据
tips = sns.load_dataset('tips')
tips.head()
| total_bill | tip | sex | smoker | day | time | size | |
|---|---|---|---|---|---|---|---|
| 0 | 16.99 | 1.01 | Female | No | Sun | Dinner | 2 |
| 1 | 10.34 | 1.66 | Male | No | Sun | Dinner | 3 |
| 2 | 21.01 | 3.50 | Male | No | Sun | Dinner | 3 |
| 3 | 23.68 | 3.31 | Male | No | Sun | Dinner | 2 |
| 4 | 24.59 | 3.61 | Female | No | Sun | Dinner | 4 |
# 绘制柱状图,kde = True --> 核密度估计 (一个参数就帮你解决了)
sns.histplot(tips['total_bill'], bins=16, color="purple", kde=True)
plt.show()

# 小提琴图
sns.violinplot(x='day', y='total_bill', data=tips)
plt.show()

sns.jointplot(x='total_bill', y='tip', data=tips, color='blue', kind='hex')
plt.show()


 1720
1720

 被折叠的 条评论
为什么被折叠?
被折叠的 条评论
为什么被折叠?
 到【灌水乐园】发言


