


 该博客介绍了如何利用matplotlib在Python中通过极坐标转换为直角坐标来绘制多边形。首先导入matplotlib库,并设定坐标轴范围。然后,定义一个函数`huitu(a)`,其中参数`a`代表多边形的边数。通过循环计算每个角度对应的直角坐标点,存储到x和y列表中,最后使用matplotlib的plot函数绘制图形。博客还提到了使用cmath库进行坐标转换的可能性。
以极坐标的中心点为基础找直角坐标来画多边形
import matplotlib.pyplot as plt


def huitu(a):
    fig = plt.figure()
    plt.xlim(-10, 10)
    plt.ylim(-10, 10)

    r = 9
    angle = 360 // a
    initial = 0
    x = []
    y = []
    while initial <= 360:
        x.append(round(r*math.cos(math.radians(initial))))
        y.append(round(r*math.sin(math.radians(initial))))
        initial += angle
    plt.plot(x, y)
    plt.show()
分析
1、plt的使用
- 方法一:
import matplotlib.pyplot as plt- 方法二:
from networkx.drawing.tests.test_pylab import plt
import matplotlib
dmatplotlib.use('TkAgg')
2、以极坐标的原点发散来找多边形的直角坐标
极坐标转换为直角坐标
x = r * cos(度数)
y = r * sin(度数)
这里转换需注意:
❌ x = r * math.cos(度数)
❌ x = r * math.sin(度数)
✅ (rmath.cos(math.radians(initial)))
✅ (rmath.sin(math.radians(initial)))
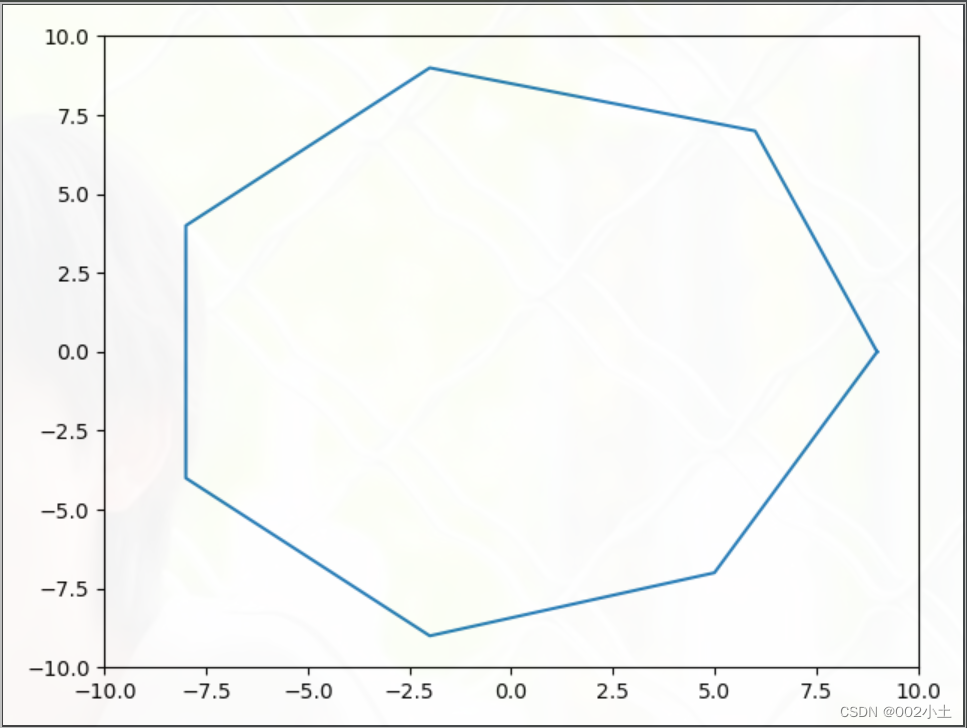
最后存入x,y列表中,还需要将上面算出来的数据四舍五入,否则画出来的图会因为数据误差而无法紧密连接
如:
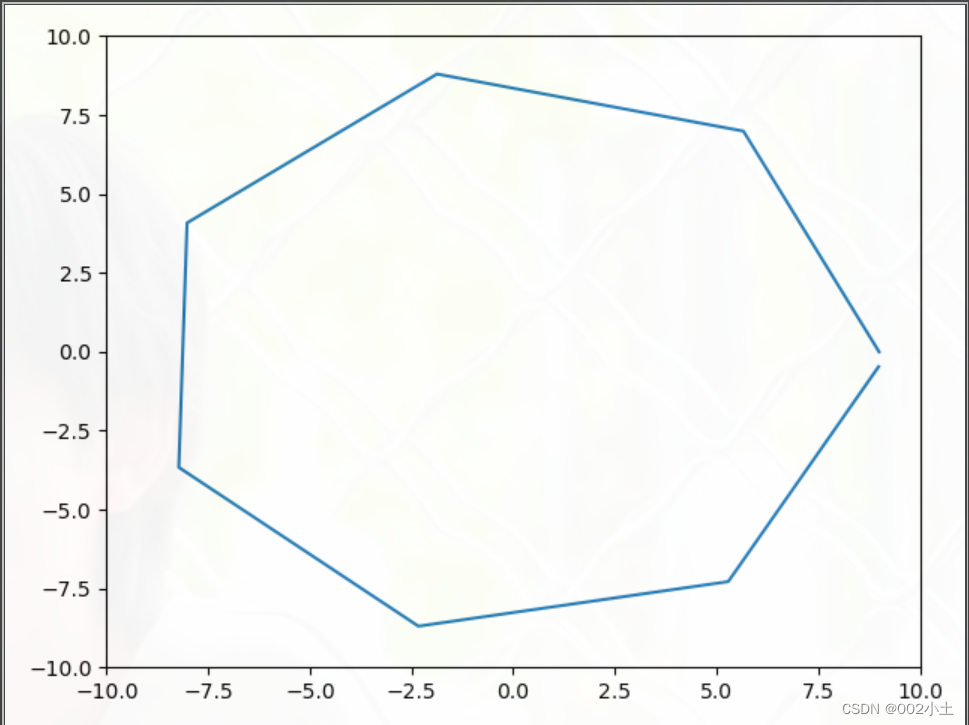
使用round四舍五入后
如:
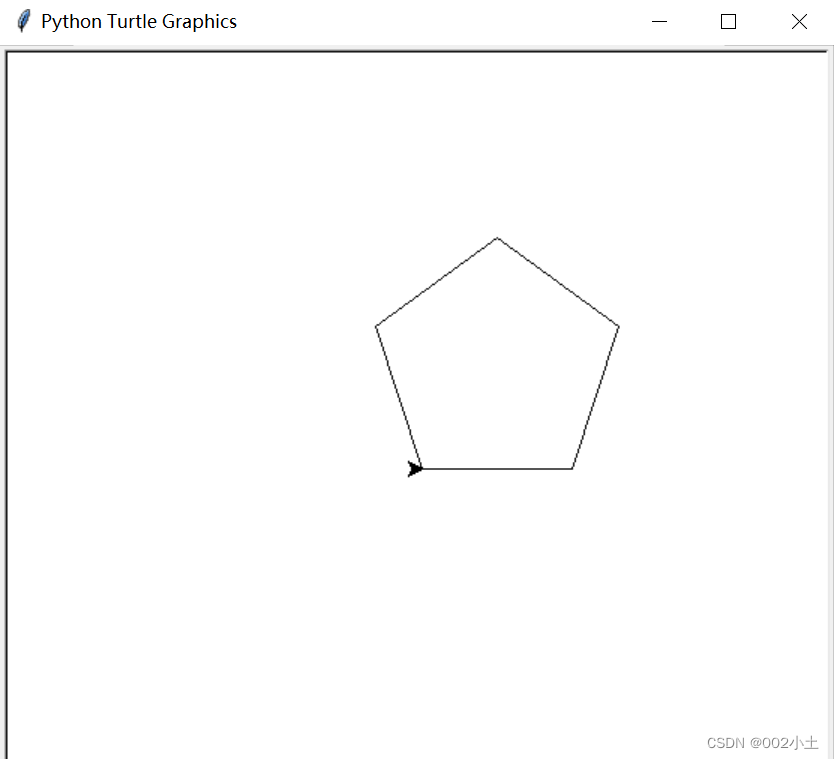
turtle
import turtle

t = turtle.Pen()
def draw(n):
    for i in range(n):
        t.forward(100)
        t.left(360/n)

draw(5)
turtle.exitonclick()
用cmath这个库来画多边形可以吗😭(极坐标转直角坐标)


 1050
1050

 被折叠的 条评论
为什么被折叠?
被折叠的 条评论
为什么被折叠?
 到【灌水乐园】发言


