


 本文介绍了随机森林的算法原理,包括森林的概念和随机性的双重特点。在气温预测的案例中,阐述了数据预处理、模型构建和调参的具体流程,强调了特征选择的重要性。随机森林具备解决分类和回归问题、抗过拟合等优点,但也存在过拟合风险、计算成本高和训练时间长等缺点。
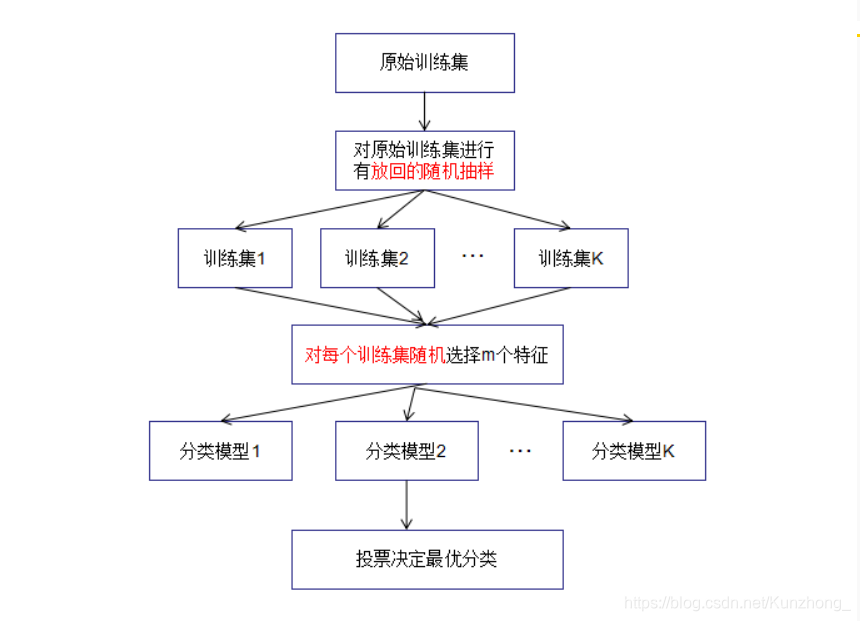
一、算法原理
随机森林: 森林:多个决策树并行运行;随机:两重随机性,每个决策树特征个数和样本个数按一定比例随机选择,最后投票选出最终结果。
二、案例:气温预测
#导入库
import numpy as np
import pandas as pd
import matplotlib.pyplot as plt
import seaborn as sns

plt.style.use("fivethirtyeight")
%matplotlib inline

import warnings
warnings.filterwarnings("ignore")#忽略警告
#读取数据
df = pd.read_csv('temps_extended.csv')
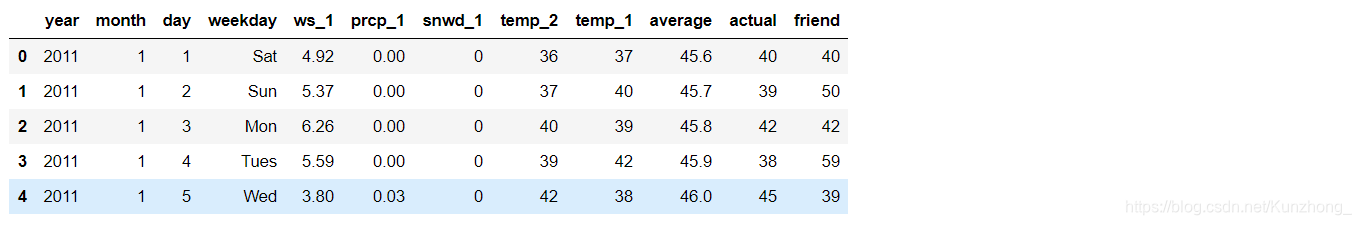
df.head()
print('数据维度',df.shape)

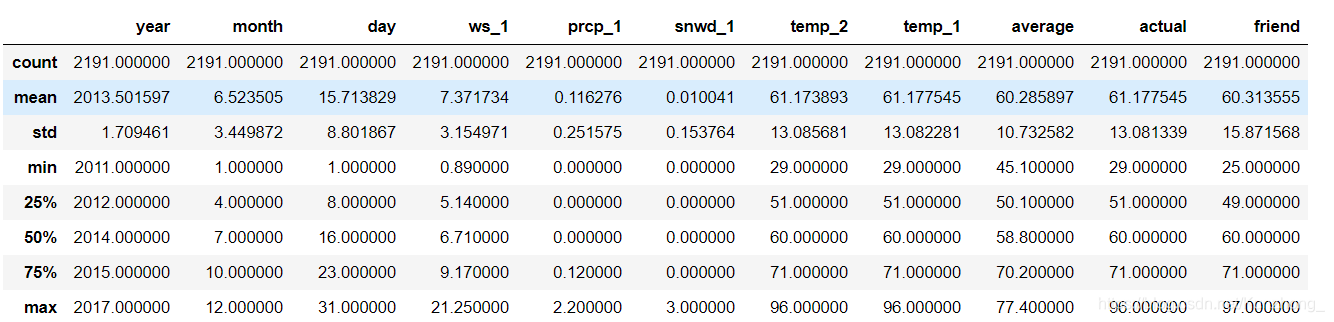
df.describe()
1.数据预处理
(1)标准时间格式
import datetime
years = df["year"]
months = df["month"]
days = df["day"]
dates = [str(int(year)) + "-" + str(int(month)) + "-" + str(int(day)) for year,month,day in zip(years,months,days)]
dates = [datetime.datetime.strptime(date,"%Y-%m-%d") for date in dates]
dates[0:5]

(2)变量时序图
fig,((ax1,ax2),(ax3,ax4),(ax5,ax6),(ax7,ax8)) = plt.subplots(4,2,figsize = (15,20))
fig.autofmt_xdate(rotation = 45 )

ax1.plot(dates,df["actual"])
ax1.set_xlabel("");ax1.set_ylabel("Temperature");ax1.set_title("Max Temp")

ax2.plot(dates,df["ws_1"])
ax2.set_xlabel("");ax2.set_ylabel("Temperature");ax2.set_title("Previous Wind Speed")

ax3.plot(dates,df["prcp_1"])
ax3.set_xlabel("");ax3
最低0.47元/天 解锁文章


 被折叠的 条评论
为什么被折叠?
被折叠的 条评论
为什么被折叠?
 到【灌水乐园】发言


