


由于公司项目需要,对可用金额和全部金额进行环状统计图统计,因此秉着不重复造轮子的信念,开始疯狂的度娘查询。
例如 ECharts 、 BizCharts 、G2都进行了考虑,不过由于项目中只需要单纯的环状图,所以如果将此插件引入项目,有点过于厚重,势必对项目性能造成一定的损失,so果断放弃。
经过反复度娘筛选,最终确定用简书的一位简友的“使用JS绘制一个圆环统计图”,
但公司用的react,因此进行了改造成为工具类,
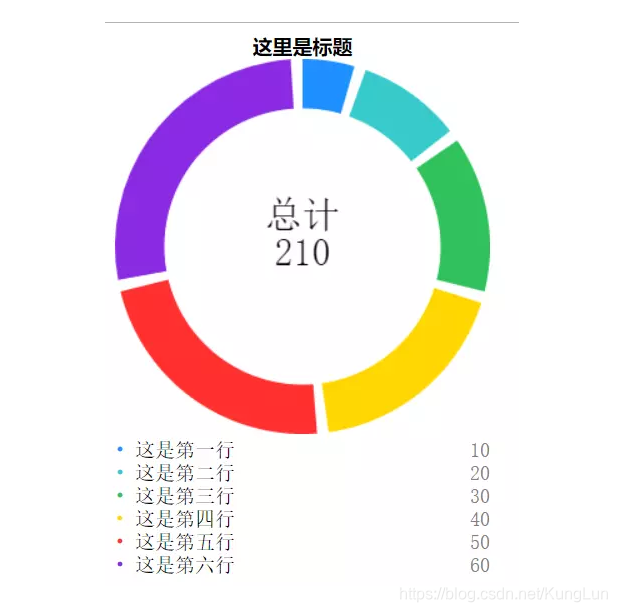
以下将源码和效果图呈现,希望帮助有同样需求的友友:
/**
* @description 2019-04-26
* @author kanglang
* @param {*} data {}各种比例值
* var pieData = [
{ "num": parseInt(allCredit), "color": "#41A6D9", "isdraw": 1 },
{ "num": parseInt(availableCredit), "color": "#52CCB8", "isdraw": 1 },
];
* @param {*} radius 外层圆的半径,单位为px。
* @param {*} width 圆环宽度,单位为px,可理解为外层圆与内层圆半径的差值。
* @param {*} pieId 此统计图所处的 容器
*/
export const pieChart = (data, radius, width, pieId) => {
// 此处防止重复绘制图形
if (pieId.childNodes.length > 0) {
const elemChild = pieId.childNodes;
for(let i=0;i<elemChild.length;i++){
pieId.removeChild(elemChild[i]);
}
}
add_data();
function add_data() {
var width = 2 * radius;
var chart = document.createElement('div');
chart.style.width = width + 'px';
var circle = document.createElement('canvas');
circle.setAttribute('id', 'circle');
circle.setAttribute('width', width + "px");
circle.setAttribute('height', width + "px");
chart.appendChild(circle);
pieId.appendChild(chart);
draw();
}
function draw() {
var len = data.length;
var canvas = document.getElementById('circle');
if (canvas.getContext) {
var ctx = canvas.getContext('2d');
var PI = Math.PI;
var start = PI * 0.5;
var gap = 0.01;
var pros;
var sum = 0;
var zero = 0;
for (var i = 0; i < len; i++) {
if (data[i].isdraw == 0) {
zero++;
continue;
}
sum += data[i].num;
}
if (zero < len - 1) {
pros = 100 - len + zero;
}
else {
pros = 100;
}
ctx.strokeStyle = 'white';
for (var i = 0; i < len; i++) {
var num = data[i].num;
if (data[i].isdraw == 0) {
continue;
}
var a_color = data[i].color;
var end = start + 2 * PI * pros / 100 * num / sum;
ctx.beginPath();
ctx.moveTo(radius, radius);
ctx.arc(radius, radius, radius, start, end, false);
ctx.stroke();
start = end + 2 * PI * gap;
ctx.fillStyle = a_color;
ctx.fill();
}
ctx.beginPath();
ctx.arc(radius, radius, radius - width, 0, PI * 2, false);
ctx.stroke();
ctx.fillStyle = 'white';
ctx.fill();
ctx.fillStyle = 'black';
ctx.font = (radius / 5) + 'px Simsun';
}
};
};
以上为工具类,下面将调用方法呈上:
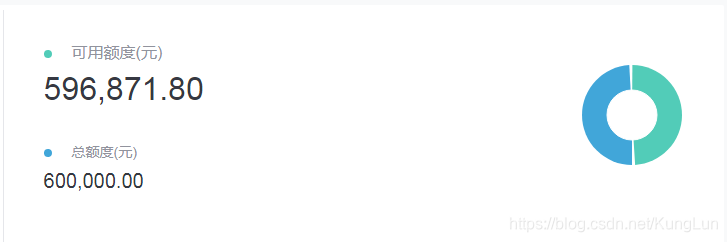
const pieData = [
{ "num": 55, "color": "#41A6D9", "isdraw": 1 },
{ "num": 45, "color": "#52CCB8", "isdraw": 1 },
];
//num 占用的比例
//color 每部分图的颜色
//isdraw 是否绘制
const documentId = document.getElementById('pieId');//这里是需要放置环形图的位置
pieChart(pieData, 50, 25, documentId);


 891
891

 被折叠的 条评论
为什么被折叠?
被折叠的 条评论
为什么被折叠?
 到【灌水乐园】发言


