


一、代码覆盖率和性能测试
1、代码覆盖率
代码:
# 将代码覆盖率报告输出到c.out文件中
$ go test -coverprofile=c.out
# 查看代码覆盖率
$ go tool cover -html=c.out
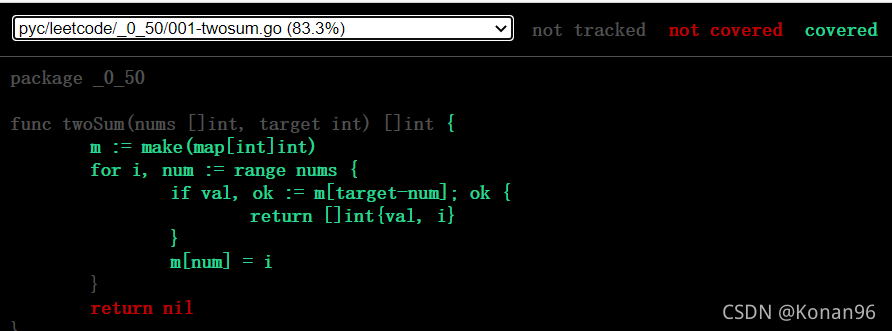
效果:
// 测试方法对这段代码的代码覆盖率
func twoSum(nums []int, target int) []int {
	m := make(map[int]int)
	for i, num := range nums {
		if val, ok := m[target-num]; ok {
			return []int{val, i}
		}
		m[num] = i
	}
	return nil
}
2、性能测试
// 需要以 Benchmark 开头
func BenchmarkTwoSum(b *testing.B) {
	var (
		nums = []int{2, 7, 11, 15}
		target = 9
		want = []int{0, 1}
	)

	// b.N 代表代码测试的次数
	for i := 0; i < b.N; i++ {
		if got := twoSum(nums, target); !reflect.DeepEqual(got, want) {
			b.Errorf("twoSum() = %v, want %v", got, want)
		}
	}
}
效果:
$ go test -bench .
goos: windows
goarch: amd64
pkg: pyc/leetcode/_0_50
BenchmarkTwoSum-16       2660191               451 ns/op
PASS
ok      pyc/leetcode/_0_50      1.953s
分析:
可以通过结果看到,总共测试了2660191次,每次执行方法耗时451 ns
3、通过pprof进行性能调优
# 生成性能报告文件 cup.out
$ go test -bench . -cpuprofile cpu.out
# 使用pprof分析报告
$ go tool pprof cpu.out
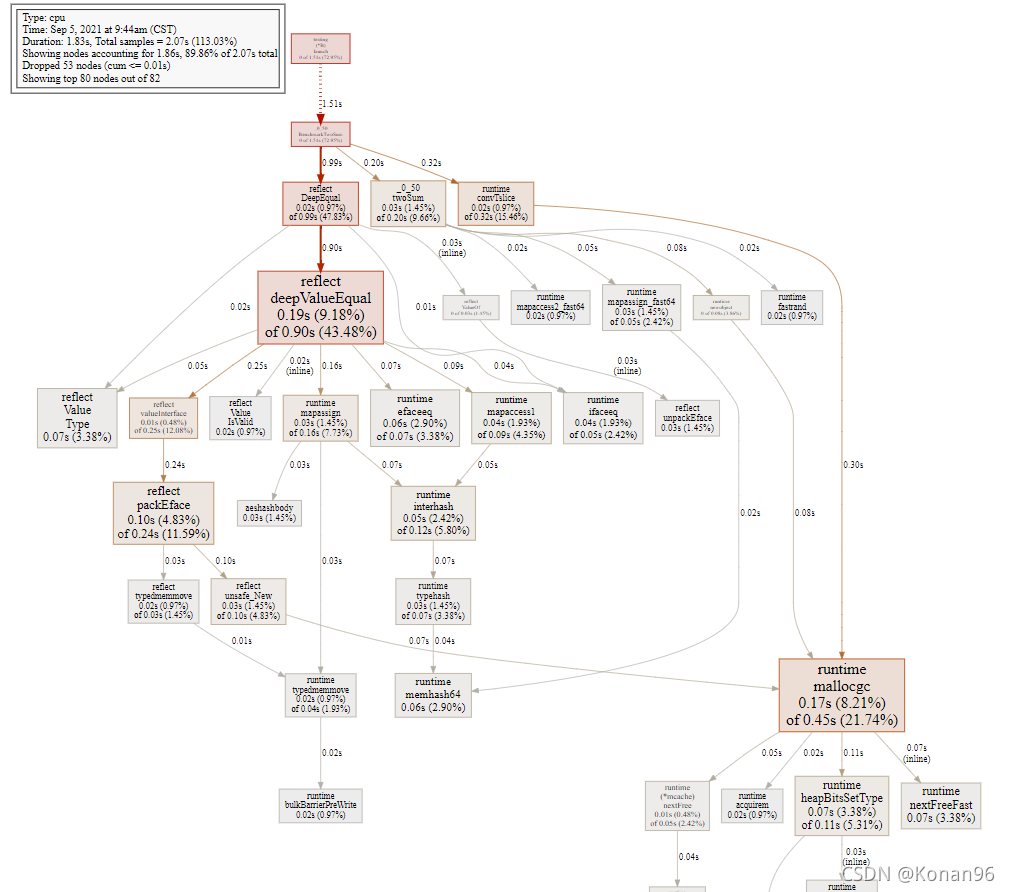
Type: cpu
Time: Sep 5, 2021 at 9:44am (CST)
Duration: 1.83s, Total samples = 2.07s (113.03%)
Entering interactive mode (type "help" for commands, "o" for options)
# 查看可视化视图
(pprof) web
注意:需要提前按照 graphviz
安装地址: http://graphviz.org/download/
效果: 通过图片分析代码慢在哪
二、生成文档和示例代码
1、生成文档
# 获取godoc
$ go get golang.org/x/tools/cmd/godoc
# 查看生成的文档
$ godoc -http :6060
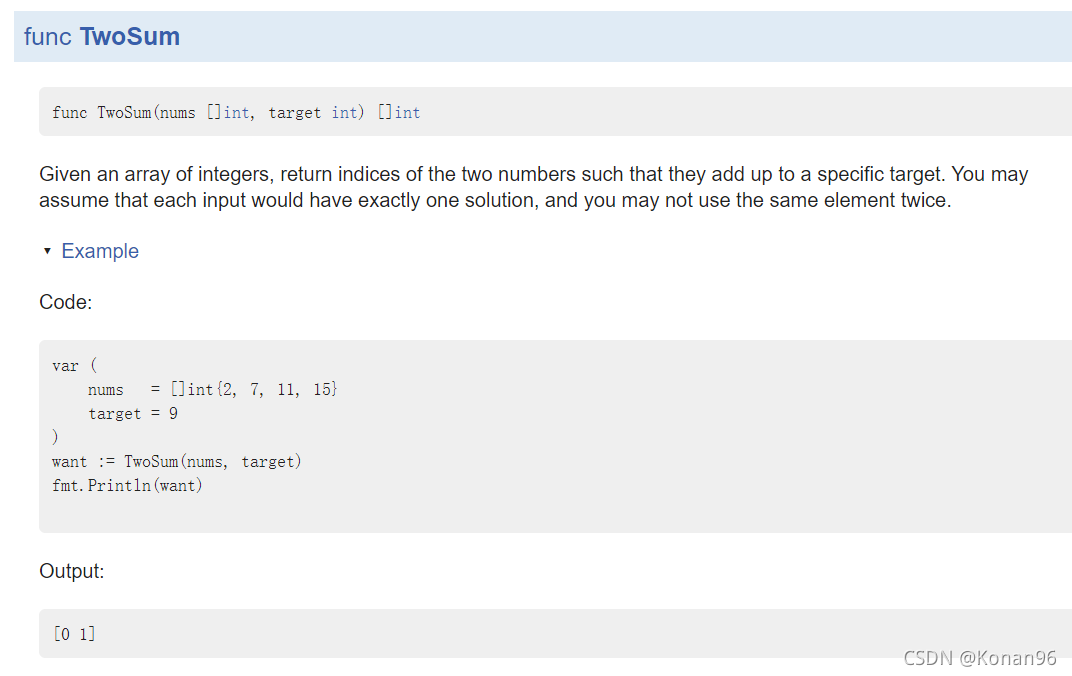
效果:

2、示例代码
// 必须以Example开头
func ExampleTwoSum() {
	var (
		nums = []int{2, 7, 11, 15}
		target = 9
	)
	want := TwoSum(nums, target)
	fmt.Println(want)

	// Output:
	// [0 1]
}
$ godoc -http :6060
效果:


 2269
2269

 被折叠的 条评论
为什么被折叠?
被折叠的 条评论
为什么被折叠?
 到【灌水乐园】发言


