


在vue中使用天地图
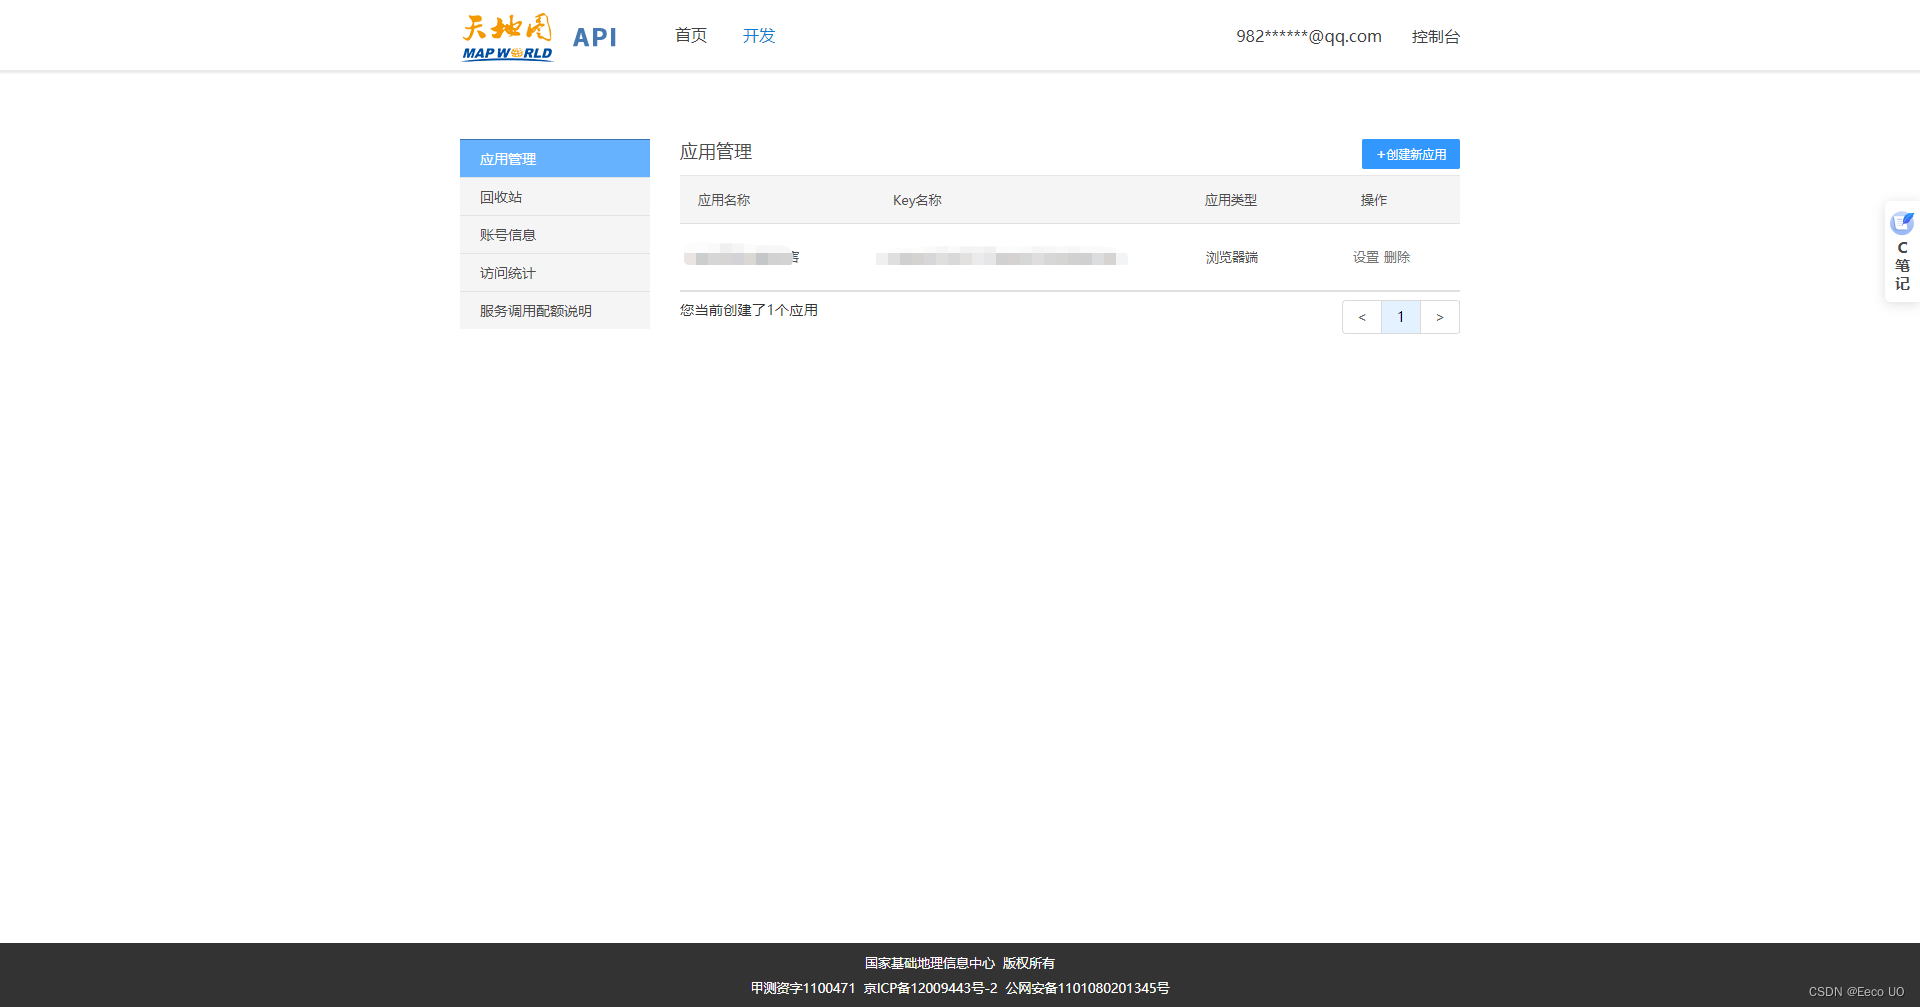
首先要在 天地图 官网注册账号,然后申请自己的密钥(创建应用)
申请完成就在vue项目中的index.html(public文件夹)引入
<script type="text/javascript" src="http://api.tianditu.gov.cn/api?v=4.0&tk={你的密钥}"></script>
在组件里面创建DOM
<div id="mapDiv" style="width: 100%;height: 100%" />
然后初始化天地图
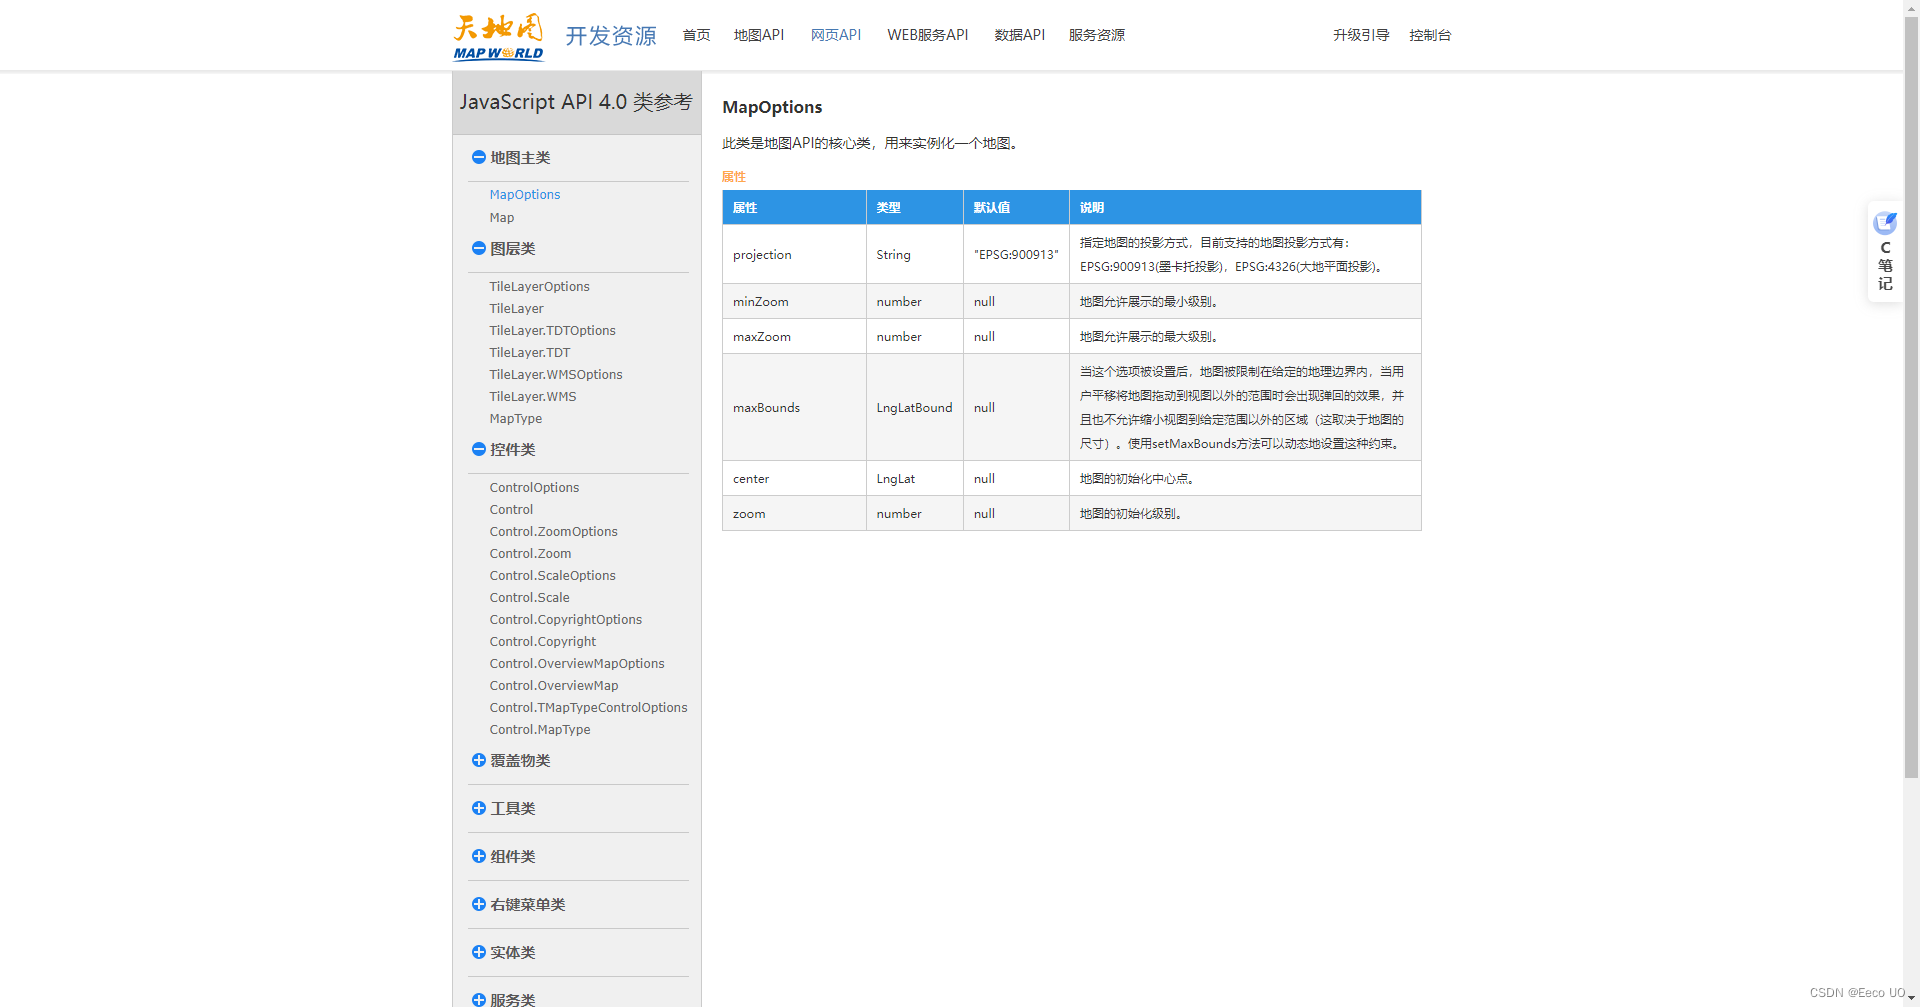
天地图文档很简单的
var T = window.T
    var imageURL = 'http://t0.tianditu.gov.cn/img_w/wmts?' +
        'SERVICE=WMTS&REQUEST=GetTile&VERSION=1.0.0&LAYER=img&STYLE=default&TILEMATRIXSET=w&FORMAT=tiles' +
        '&TILEMATRIX={z}&TILEROW={y}&TILECOL={x}&tk={你的密钥}'
    // TileLayer添加图层所用的构造函数
    var lay = new T.TileLayer(imageURL, { minZoom: 1, maxZoom: 16 }) // 地图图层
    var config = { layers: [lay] }

    this.map = new T.Map('mapDiv', config) // 地图实例
    this.map.centerAndZoom(new T.LngLat(this.lists[0].Longitude, this.lists[0].latitude), 3)
    // //允许鼠标双击放大地图
    this.map.enableScrollWheelZoom()

    // 创建地图图层对象
    const mapTypeSelect = [{
      'title': '卫星',
      'icon': ' http://api.tianditu.gov.cn/v4.0/image/map/maptype/satellite.png',
      'layer': window.TMAP_SATELLITE_MAP
    }, {
      'title': '地图', // 地图控件上所要显示的图层名称
      'icon': 'http://api.tianditu.gov.cn/v4.0/image/map/maptype/vector.png', // 地图控件上所要显示的图层图标(默认图标大小80x80)
      'layer': window.TMAP_NORMAL_MAP // 地图类型对象,即MapType。
    }, {
      'title': '卫星混合',
      'http': 'api.tianditu.gov.cn/v4.0/image/map/maptype/satellitepoi.png',
      'layer': 'TMAP_HYBRID_MAP'
    }, {
      'title': '地形',
      'icon': ' http://api.tianditu.gov.cn/v4.0/image/map/maptype/terrain.png',
      'layer': window.TMAP_TERRAIN_MAP
    },
    {
      'title': '地形混合',
      'icon': ' http://api.tianditu.gov.cn/v4.0/image/map/maptype/terrainpoi.png',
      'layer': window.TMAP_TERRAIN_HYBRID_MAP
    }]
    var ctrl = new T.Control.MapType({ mapTypes: mapTypeSelect }) // 初始化地图类型选择控件

    this.map.addControl(ctrl) // 添加地图选择控件

    this.map.setMapType(window.TMAP_SATELLITE_MAP) // 设置地图位地星混合图层

    this.GetMaps()
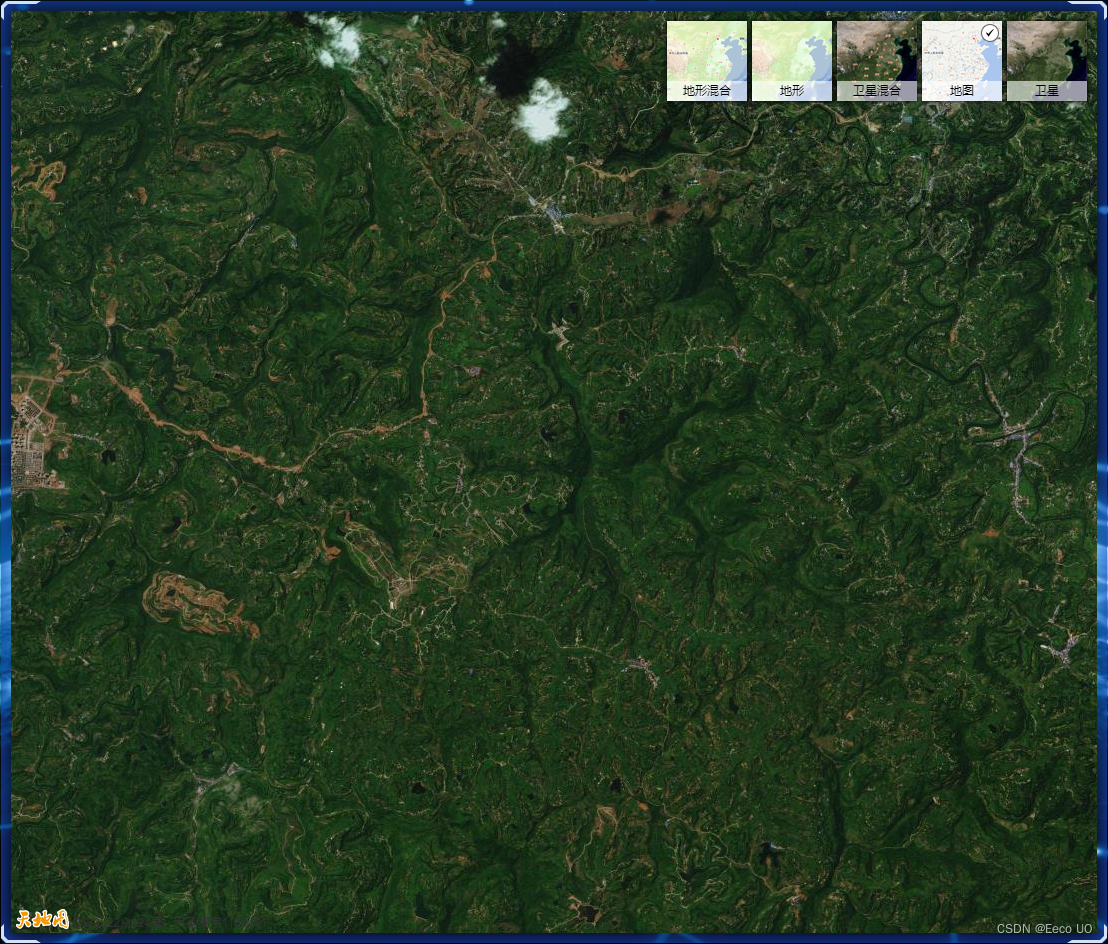
添加多图层后,是可以直接选择地图类型的
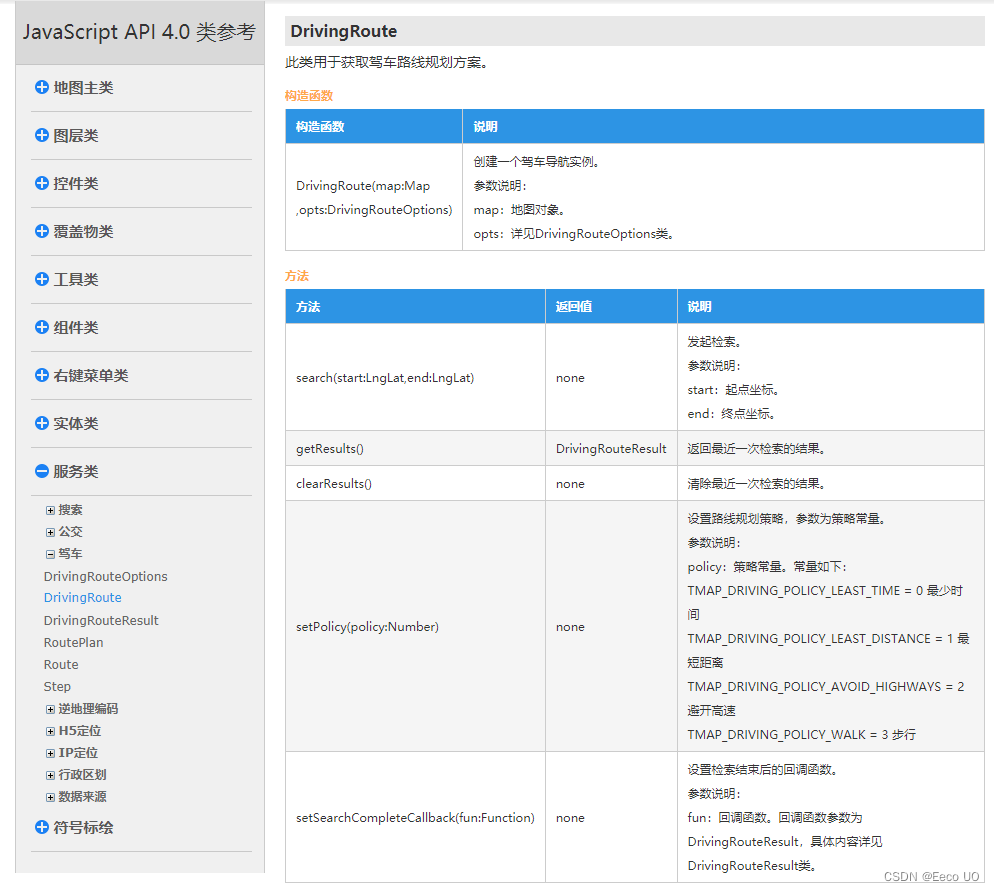
然后就是获取两个坐标位置之间的路线
GetMaps() {
      const T = window.T
      const zoom = 13
      const _map = this.map
      // 设置显示地图的中心点和级别
      _map.clearOverLays()
      _map.centerAndZoom(new T.LngLat(this.lists[0].Longitude, this.lists[0].latitude), zoom)
	// 创建icon对象
      var icon = new T.Icon({
        iconUrl: this.Marker,
        iconSize: new T.Point(25, 33),
        iconAnchor: new T.Point(10, 25)
      })

      let marker = {} // 创建标注
      let polyline = {} // 线
      const that = this
      /**
       * 获取起点到终点的路线
       */
       // 发起检索
       DrivingRoute.search(new T.LngLat(106.340041, 31.274881), new T.LngLat(106.428003, 31.276362))
       // DrivingRoute(map:Map ,opts:DrivingRouteOptions)   DrivingRouteOptions:{policy: 策略,onSearchComplete回调函数返回值里面能找到路线中所有的点位坐标}
      	const DrivingRoute = new T.DrivingRoute(new T.Map('mapDiv'), { policy: 0, onSearchComplete: (val) => {
        const arr = val.result.result.routelatlon.split(';')
        const points = []
        arr.forEach((x, index) => {
        	//  _map.addLayer() 添加图层
        	//  _map.addControl() 添加控件
        	//  _map.addContextMenu() 添加右键菜单
        	//  _map.addOverLay() 添加覆盖物函数
          /**
           * 线的各个点
           */

          if (index % 3 === 0) { //点太密了 自己处理就行
          // 画线所需点
            points.push(new T.LngLat(x.split(',')[0], x.split(',')[1]))
          }
          /**
           * 标记
           */
          if (index % 30 === 0) {// 一样太密了  插旗
            marker = new T.Marker(new T.LngLat(x.split(',')[0], x.split(',')[1]), { icon: icon })
            _map.addOverLay(marker)
            marker.addEventListener('click', function(e) { // 监听点击事件
              const clientX = e.lnglat.lat // 获取marker当前经纬度
              const clientY = e.lnglat.lng
              _map.centerAndZoom(new T.LngLat(clientY, clientX), 13) // 重新创建地图对象
              // 这里获取的经度纬度是实际经纬度四舍五入后的获取的
            })
          }
        })
        /**
         * 画线3
         */
        polyline = new T.Polyline(points, { color: '#d7000f', weight: 5, lineStyle: 'solid', opacity: 1 })
        _map.addOverLay(polyline)
        /**
         * 画圈
         */
        var circleObj = new T.Circle(new T.LngLat(arr[0].split(',')[0], arr[0].split(',')[1]), 1000, { color: '#fff', weight: 2, opacity: 0.5, fillOpacity: 0.3, fillColor: 'rgba(255, 255, 255, 0.7)', lineStyle: 'solid' })
        _map.addOverLay(circleObj)

        circleObj.addEventListener('click', function(e) { // 监听点击事件
          that.$router.push({
            path: '/monitor/visualized'
          })
        })
      } })

    }
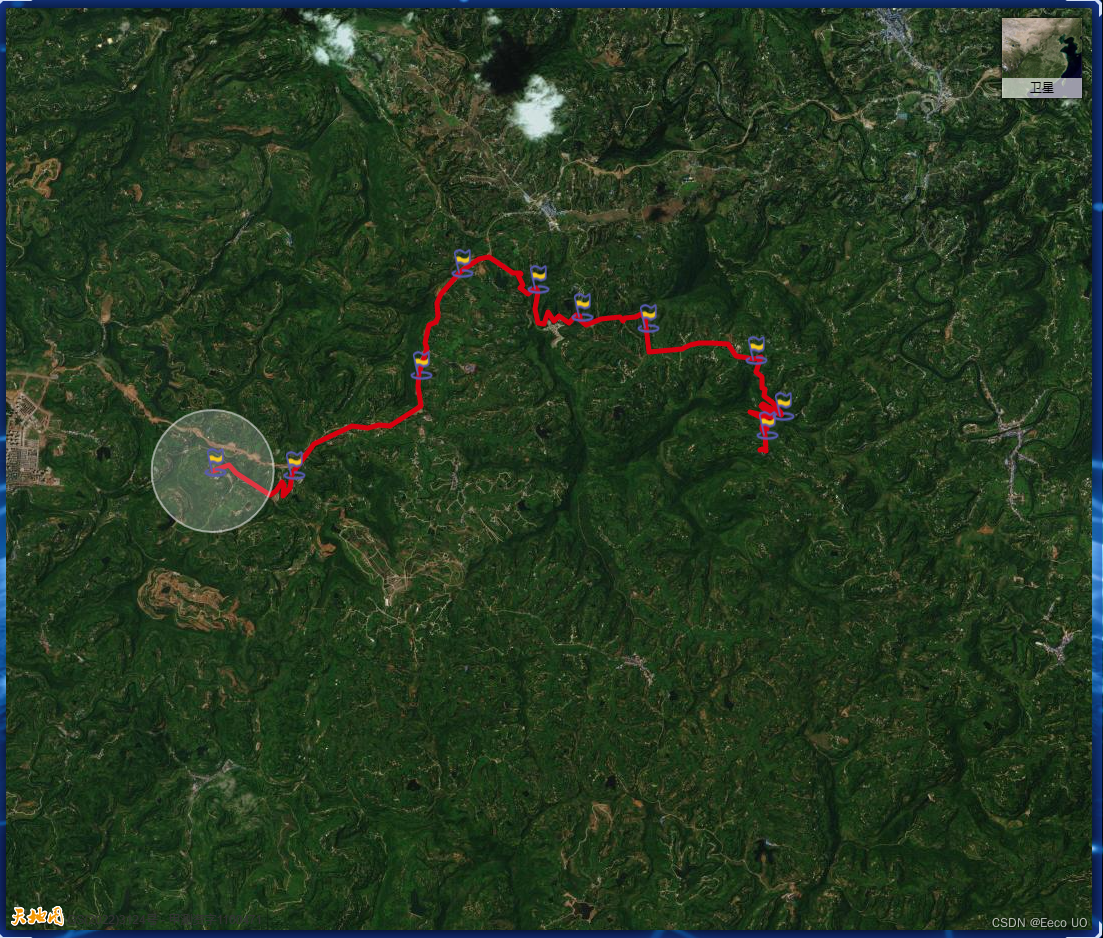
效果如图


 被折叠的 条评论
为什么被折叠?
被折叠的 条评论
为什么被折叠?
 到【灌水乐园】发言


