


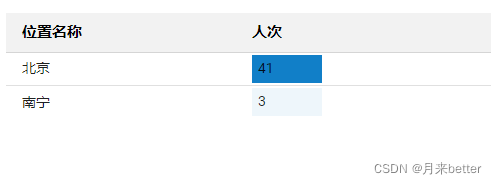
 该博客介绍了如何在Vuetify框架下利用v-data-table组件展示用户的位置分布,包括位置名称和相应的人次。示例代码显示了如何定制表格样式、固定表头,并展示无数据时的提示信息。数据包括北京和南宁两地,人次分别为28和3。
<span style="font-weight:600">用户位置</span>
<div
class="mt-4"
id="login-location"
:style="{ float: 'left', width: '100%' }"
>
	<v-data-table
	 :headers="location_headers"
	 :items="locations"
	 class="elevation-0"
	 :hide-default-footer="true"
	 :disable-sort="true"
	 :fixed-header="true"
	 no-data-text="暂无数据"
	>
	 <template
	   v-slot:[`item.value`]="{ item }"
	   v-if="locations.length > 0"
	 >
	   <v-chip :color="getColor(locationsNum, locations, item.value)">
	     {{ item.value }}
	   </v-chip>
	 </template>
	</v-data-table>
</div>

export default {
	data(){
		return {
			location_headers: [
		        {
		          text: "位置名称",
		          value: "name"
		        },
		        {
		          text: "人次",
		          value: "value"
		        }
		      ],
		      locations:[
			      {name: "北京", value: 28},
			      {name: "南宁", value: 3}
		      ]
		}
	}

}
vuetify v-data-table组件官方文档地址:https://vuetifyjs.com/zh-Hans/api/v-data-table/


 1084
1084

 被折叠的 条评论
为什么被折叠?
被折叠的 条评论
为什么被折叠?
 到【灌水乐园】发言


