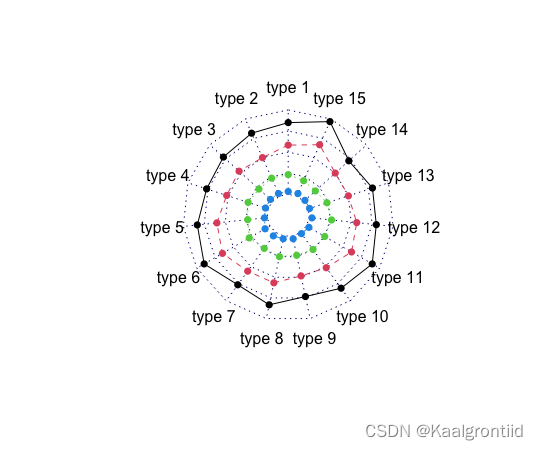
鉴定一下网络热门函数。
这次分析的函数是fmsb包中的radarchart()函数,用途是生成雷达图。
预期结果大约是这样:

原函数内部结构在这里:
radarchart <- function(df, axistype=0, seg=4, pty=16, pcol=1:8, plty=1:6, plwd=1,
                       pdensity=NULL, pangle=45, pfcol=NA, cglty=3, cglwd=1,
                       cglcol="navy", axislabcol="blue", title="", maxmin=TRUE,
                       na.itp=TRUE, centerzero=FALSE, vlabels=NULL, vlcex=NULL,
                       caxislabels=NULL, calcex=NULL,
                       paxislabels=NULL, palcex=NULL, ...) {
  if (!is.data.frame(df)) { cat("The data must be given as dataframe.\n"); return() }
  if ((n <- length(df))<3) { cat("The number of variables must be 3 or more.\n"); return() }
  if (maxmin==FALSE) { # when the dataframe does not include max and min as the top 2 rows.
    dfmax <- apply(df, 2, max)
    dfmin <- apply(df, 2, min)
    df <- rbind(dfmax, dfmin, df)
  }
  plot(c(-1.2, 1.2), c(-1.2, 1.2), type="n", frame.plot=FALSE, axes=FALSE,
       xlab="", ylab="", main=title, asp=1, ...) # define x-y coordinates without any plot

  theta <- seq(90, 450, length=n+1)*pi/180
  theta <- theta[1:n]
  xx <- cos(theta)
  yy <- sin(theta)
  CGap <- ifelse(centerzero, 0, 1)
  for (i in 0:seg) { # complementary guide lines, dotted navy line by default
    polygon(xx*(i+CGap)/(seg+CGap), yy*(i+CGap)/(seg+CGap), lty=cglty, lwd=cglwd, border=cglcol)
    if (axistype==1|axistype==3) CAXISLABELS <- paste(i/seg*100,"(%)")
    if (axistype==4|axistype==5) CAXISLABELS <- sprintf("%3.2f",i/seg)
    if (!is.null(caxislabels)&(i<length(caxislabels))) CAXISLABELS <- caxislabels[i+1]
    if (axistype==1|axistype==3|axistype==4|axistype==5) {
     if (is.null(calcex)) text(-0.05, (i+CGap)/(seg+CGap), CAXISLABELS, col=axislabcol) else
     text(-0.05, (i+CGap)/(seg+CGap), CAXISLABELS, col=axislabcol, cex=calcex)
    }
  }
  if (centerzero) {
    arrows(0, 0, xx*1, yy*1, lwd=cglwd, lty=cglty, length=0, col=cglcol)
  }
  else {
    arrows(xx/(seg+CGap), yy/(seg+CGap), xx*1, yy*1, lwd=cglwd, lty=cglty, length=0, col=cglcol)
  }
  PAXISLABELS <- df[1,1:n]
  if (!is.null(paxislabels)) PAXISLABELS <- paxislabels
  if (axistype==2|axistype==3|axistype==5) {
   if (is.null(palcex)) text(xx[1:n], yy[1:n], PAXISLABELS, col=axislabcol) else
   text(xx[1:n], yy[1:n], PAXISLABELS, col=axislabcol, cex=palcex)
  }
  VLABELS <- colnames(df)
  if (!is.null(vlabels)) VLABELS <- vlabels
  if (is.null(vlcex)) text(xx*1.2, yy*1.2, VLABELS) else
  text(xx*1.2, yy*1.2, VLABELS, cex=vlcex)
  series <- length(df[[1]])
  SX <- series-2
  if (length(pty) < SX) { ptys <- rep(pty, SX) } else { ptys <- pty }
  if (length(pcol) < SX) { pcols <- rep(pcol, SX) } else { pcols <- pcol }
  if (length(plty) < SX) { pltys <- rep(plty, SX) } else { pltys <- plty }
if (length(plwd) < SX) { 


 本文详细分析了R语言fmsb包中的radarchart函数,用于生成雷达图。讨论了函数处理数据的要求,包括数据格式、最小对象数,以及maxmin参数的影响。此外,还解释了centerzero参数如何改变图形中心,axistype参数的不同样式,以及如何自定义轴标签。最后,介绍了函数如何处理缺失值并生成最终的雷达图。
 最低0.47元/天 解锁文章


 1422
1422

 被折叠的 条评论
为什么被折叠?


