


CPU 性能查看命令和工具
top:实时监控系统中各进程的 CPU 使用情况。
vmstat:监控系统整体的 CPU 使用情况,包括用户态、内核态和空闲时间。
利用 top、vmstat、pidstat、strace 以及 perf 等几个最常见的工具,获取 CPU 性能指标后,再结合进程与 CPU 的工作原理,就可以迅速定位出 CPU 性能瓶颈的来源。
cpu使用排名
ps aux --sort=-%cpu | head -n 5
[root@rhel7 ~]# ps aux --sort=-%cpu | head -n 5``USERPID %CPU %MEMVSZ RSS TTY STAT START TIME COMMAND``root 1 0.0 0.0 191564 4536 ?Ss Aug14 0:03 /usr/lib/systemd/systemd --switched-root --system --deserialize 22``root 2 0.0 0.0 0 0 ?SAug14 0:00 [kthreadd]``root 4 0.0 0.0 0 0 ?S< Aug14 0:00 [kworker/0:0H]``root 6 0.0 0.0 0 0 ?SAug14 0:00 [ksoftirqd/0]
vmstat 2 3
间隔2s,打印3次
[root@rhel7 ~]# vmstat 2 3``procs -----------memory---------- ---swap-- -----io---- -system-- ------cpu-----``r b swpd free buff cache si sobibo in cs us sy id wa st``0 0 0 14435784 79416 85558400 2 1 10 12 0 0 100 0 0``0 0 0 14435760 79416 85561600 0 0 83 102 0 0 100 0 0``0 0 0 14435760 79416 85561600 0 0 39 47 0 0 100 0 0
sar -u 3 5
# 显示CPU利用率,间隔3s,显示5次
[root@rhel7 ~]# sar -u 3 5``Linux 3.10.0-1160.el7.x86_64 (rhel7) 08/15/2024 _x86_64_ (4 CPU)``02:19:56 AM CPU %user %nice %system %iowait%steal %idle``02:19:59 AM all 0.00 0.00 0.08 0.00 0.00 99.92``02:20:02 AM all 0.33 0.00 0.25 0.00 0.00 99.42``02:20:05 AM all 0.00 0.00 0.00 0.00 0.00100.00``02:20:08 AM all 0.00 0.00 0.08 0.00 0.00 99.92``02:20:11 AM all 0.17 0.00 0.00 0.00 0.00 99.83``Average:all 0.10 0.00 0.08 0.00 0.00 99.82
iostat命令
#查看CPU使用情况
[root@rhel7 ~]# iostat -c``Linux 3.10.0-1160.el7.x86_64 (rhel7) 08/15/2024 _x86_64_ (4 CPU)``avg-cpu: %user %nice %system %iowait %steal %idle` `0.030.010.010.000.00 99.94
uptime命令:1、5、15分钟平均负载
#如果是8核CPU,load average三个值长期大于8,说明负载很高,会影响系统性能。
[root@rhel7 ~]# uptime``02:21:30 up 1 day, 17 min, 3 users, load average: 0.00, 0.01, 0.05
CPU 使用率
[root@rhel7 ~]# cat /proc/stat | grep cpu``cpu 13608 4699 4370 39356213 1679 0 43 0 0 0``cpu0 3869 889 761 9838971 831 0 10 0 0 0``cpu1 3496 744 879 9840695 50 0 3 0 0 0``cpu2 3357 1611 1698 9836350 361 0 16 0 0 0``cpu3 2884 1453 1031 9840195 437 0 14 0 0 0
mpstat 命令
#-P ALL 表示监控所有CPU,后面数字5表示间隔5秒后输出一组数据
[root@rhel7 ~]# mpstat -P ALL 5``Linux 3.10.0-1160.el7.x86_64 (rhel7) 08/15/2024 _x86_64_ (4 CPU)``05:29:21 AM CPU%usr %nice%sys %iowait%irq %soft %steal %guest %gnice %idle``05:29:26 AM all0.000.000.000.000.000.000.000.000.00 100.00``05:29:26 AM00.000.000.000.000.000.000.000.000.00 100.00``05:29:26 AM10.000.000.000.000.000.000.000.000.00 100.00``05:29:26 AM20.000.000.000.000.000.000.000.000.00 100.00``05:29:26 AM30.000.000.000.000.000.000.000.000.00 100.00`` ``05:29:26 AM CPU%usr %nice%sys %iowait%irq %soft %steal %guest %gnice %idle``05:29:31 AM all0.000.000.000.050.000.000.000.000.00 99.95``05:29:31 AM00.000.000.000.000.000.000.000.000.00 100.00``05:29:31 AM10.000.000.000.000.000.000.000.000.00 100.00``05:29:31 AM20.000.000.000.000.000.000.000.000.00 100.00``05:29:31 AM30.200.000.000.000.000.000.000.000.00 99.80
pidstat 命令
#查看一下进程的情况,间隔5秒后输出一组数据
[root@rhel7 ~]# pidstat -w 5` `Linux 3.10.0-1160.el7.x86_64 (rhel7) 08/15/2024 _x86_64_ (4 CPU)` `05:31:36 AM UID PID cswch/s nvcswch/s Command``05:31:41 AM 0 6 0.20 0.00 ksoftirqd/0``05:31:41 AM 0 9 14.14 0.00 rcu_sched``05:31:41 AM 011 0.40 0.00 watchdog/0``05:31:41 AM 012 0.40 0.00 watchdog/1``05:31:41 AM 017 0.40 0.00 watchdog/2``05:31:41 AM 022 0.40 0.00 watchdog/3` `.....................................``05:31:41 AM 0 3280 0.20 0.00 kworker/u256:0``05:31:41 AM 0 3483 0.40 0.00 kworker/3:2``05:31:41 AM 0 6305 1.59 0.00 kworker/2:1``05:31:41 AM 0 6354 1.39 0.00 kworker/0:0``05:31:41 AM 0 6355 0.20 0.20 pidstat
内存性能查看命令和工具****
free命令
#查看系统内存使用情况。
[root@rhel7 ~]# free -h` `totalusedfree shared buff/cache available` `Mem:15G1.0G 13G 22M952M 14G` `Swap: 7.9G 0B7.9G
sar命令
#系统性能监控工具,可以监控系统的内存使用率、页面交换等情况。
#-r 内存使用统计信息
#-R 内存统计信息
sar -r
[root@rhel7 ~]# sar -r``Linux 3.10.0-1160.el7.x86_64 (rhel7) 08/15/2024 _x86_64_ (4 CPU)` `12:00:01 AM kbmemfree kbmemused %memused kbbuffers kbcached kbcommit %commit kbactive kbinact kbdirty``12:10:01 AM 14442968 1968988 12.00 78468783512 3222832 13.08923404351276 4``12:20:01 AM 14443284 1968672 12.00 78504783516 3222832 13.08923356351312 0``12:30:01 AM 14443108 1968848 12.00 78548783524 3222812 13.08923432351348 284``12:40:01 AM 14443312 1968644 12.00 78588783528 3222840 13.08923432351396 0``12:50:01 AM 14442456 1969500 12.00 78712783520 3222844 13.08923344351512 0``.............................................................................``06:10:01 AM 14377608 2034348 12.40 84632813600 3245844 13.17966592364860 0``06:20:01 AM 14377108 2034848 12.40 84660813600 3245756 13.17966820364884 4``06:30:01 AM 14377260 2034696 12.40 84692813640 3245736 13.1796687236492416``06:40:01 AM 14377224 2034732 12.40 84820813628 3245764 13.17966796365052 0`` ``Average:kbmemfree kbmemused %memused kbbuffers kbcached kbcommit %commit kbactive kbinact kbdirty``Average: 14421106 1990850 12.13 80711790752 3234299 13.1293874635470110
sar -R
[root@rhel7 ~]# sar -R``Linux 3.10.0-1160.el7.x86_64 (rhel7) 08/15/2024 _x86_64_ (4 CPU)` `12:00:01 AM frmpg/s bufpg/s campg/s``12:10:01 AM -0.10 0.02 0.00``12:20:01 AM 0.13 0.01 0.00``12:30:01 AM -0.07 0.02 0.00``12:40:01 AM 0.08 0.02 0.00` `............................``06:00:01 AM -0.23 0.02 -0.00``06:10:01 AM -0.16 0.01 0.01``06:20:01 AM -0.21 0.01 0.00``06:30:01 AM 0.06 0.01 0.02``06:40:01 AM -0.01 0.05 -0.00` `06:40:01 AM frmpg/s bufpg/s campg/s``06:50:01 AM 0.00 0.02 0.01``Average:-0.67 0.07 0.31
vmstat命令
#除了 CPU,也可以用来监控系统内存使用情况。
[root@rhel7 ~]# vmstat``procs -----------memory---------- ---swap-- -----io---- -system-- ------cpu-----``r b swpd free buff cache si sobibo in cs us sy id wa st``0 0 0 14378812 84888 89048400 1 1 10 12 0 0 100 0 0
内存使用排名
ps aux --sort=-%mem | head -n 6
[root@rhel7 ~]# ps aux --sort=-%mem | head -n 6``USERPID %CPU %MEMVSZ RSS TTY STAT START TIME COMMAND``root 2640 0.0 1.3 3710124 219972 ? Sl Aug14 1:17 /usr/bin/gnome-shell``root 1430 0.0 0.2 349572 42868 tty1 Ssl+ Aug14 0:02 /usr/bin/X :0 -background none -noreset -audit 4 -verbose -auth /run/gdm/auth-for-gdm-B4ETCL/database -seat seat0 -nolisten tcp vt1``root 2829 0.0 0.1 877316 31764 ?Sl Aug14 0:00 nautilus-desktop --force``root 3017 0.0 0.1 733284 28696 ?Sl Aug14 0:00 /usr/libexec/gnome-terminal-server``root 2704 0.0 0.1 902492 28516 ?Sl Aug14 0:00 /usr/libexec/goa-daemon
网络********性能查看命令和工具
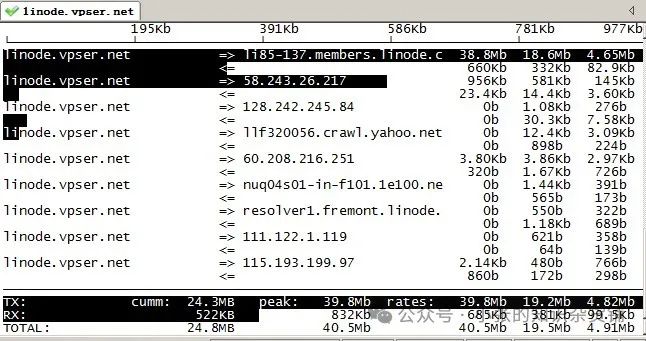
iftop命令
#实时监控网络流量,需要额外安装
CentOS上安装所需依赖包:
yum install flex byacc libpcap ncurses ncurses-devel libpcap-devel gcc build-essential -y
下载iftop
wget http://www.ex-parrot.com/pdw/iftop/download/iftop-0.17.tar.gz
解压
tar zxvf iftop-0.17.tar.gz
进入解压目录
cd iftop-0.17
预编译
./configure
编译安装
make && make install
直接执行命令:iftop
参数解释:
-i设定监测的网卡,如:# iftop -i eth1
-B 以bytes为单位显示流量(默认是bits),如:# iftop -B
-n使host信息默认直接都显示IP,如:# iftop -n
-N使端口信息默认直接都显示端口号,如: # iftop -N
-F显示特定网段的进出流量,如# iftop -F 10.10.1.0/24或# iftop -F 10.10.1.0/255.255.255.0
-h(display this message),帮助,显示参数信息
-p使用这个参数后,中间的列表显示的本地主机信息,出现了本机以外的IP信息;
-b使流量图形条默认就显示;
-P使host信息及端口信息默认就都显示;
sar -n命令
#显示系统网络运行状态
`[root@rhel7 iftop-0.17]# sar -n DEV 2 3``Linux 3.10.0-1160.el7.x86_64 (rhel7) 08/15/2024 _x86_64_ (4 CPU)` `07:14:10 AM IFACE rxpck/s txpck/srxkB/stxkB/s rxcmp/s txcmp/s rxmcst/s``07:14:12 AM eth0 2.50 0.00 0.15 0.00 0.00 0.00 0.00``07:14:12 AMlo 0.00 0.00 0.00 0.00 0.00 0.00 0.00``..............................................................` `Average:IFACE rxpck/s txpck/srxkB/stxkB/s rxcmp/s txcmp/s rxmcst/s``Average: eth0 4.00 0.33 0.23 0.13 0.00 0.00 0.00``Average: lo 0.00 0.00 0.00 0.00 0.00 0.00 0.00`
netstat命令
#-i 查看网络接口信息
#-r 检测系统路由表信息。
[root@rhel7 iftop-0.17]# netstat -i``Kernel Interface table``Iface MTURX-OK RX-ERR RX-DRP RX-OVRTX-OK TX-ERR TX-DRP TX-OVR Flg``eth0 1500 349522 0 0 0 25673 0 0 0 BMRU``lo 65536 36 0 0 036 0 0 0 LRU` `[root@rhel7 iftop-0.17]# netstat -r``Kernel IP routing table``Destination Gateway Genmask Flags MSS Window irtt Iface` `default gateway 0.0.0.0 UG0 0 0 eth0` `10.255.10.00.0.0.0 255.255.255.0 U 0 0 0 eth0
IO 性能查看命令和工具
iotop命令
#实时监控系统的 IO 情况,包括读写速率和进程 IO 占用情况。
#显示正在产生的io进程,没有就不显示;
[root@rhel7 ~]# iotop -o``Total DISK READ : 0.00 B/s | Total DISK WRITE : 0.00 B/s``Actual DISK READ: 0.00 B/s | Actual DISK WRITE: 0.00 B/s``TID PRIO USER DISK READ DISK WRITE SWAPIN IO>COMMAND``9260 be/4 root0.00 B/s0.00 B/s 0.00 % 0.01 % [kworker/0:0]
#-d 5 秒刷新一次,-u 指定用户
[root@rhel7 ~]# iotop -d 5 -u root``Total DISK READ : 0.00 B/s | Total DISK WRITE : 0.00 B/s``Actual DISK READ: 0.00 B/s | Actual DISK WRITE: 0.00 B/s``TID PRIO USER DISK READ DISK WRITE SWAPIN IO>COMMAND` `1 be/4 root0.00 B/s0.00 B/s 0.00 % 0.00 % systemd --switched-root --system --deserialize 22` `2 be/4 root0.00 B/s0.00 B/s 0.00 % 0.00 % [kthreadd]` `4 be/0 root0.00 B/s0.00 B/s 0.00 % 0.00 % [kworker/0:0H]``....................................................
#iotop -oP 消耗io最高的进程
iostat命令
#查看系统的 IO 统计信息,包括每个设备的读写情况和平均响应时间。
#M为单位显示所有信息
[root@rhel7 ~]# iostat -m``Linux 3.10.0-1160.el7.x86_64 (rhel7) 08/15/2024 _x86_64_ (4 CPU)` `avg-cpu: %user %nice %system %iowait %steal %idle` `0.040.010.010.000.00 99.93` `Device:tpsMB_read/sMB_wrtn/sMB_readMB_wrtn` `sdb 0.00 0.00 0.00 2 0` `sda 0.58 0.01 0.01659935
#查看设备使用率(%util)、响应时间(await)
#-d 显示磁盘使用情况,-x 显示详细信息 1秒刷新一次,显示5次
[root@rhel7 ~]# iostat -d -x -k 1 5``Linux 3.10.0-1160.el7.x86_64 (rhel7) 08/15/2024 _x86_64_ (4 CPU)` `Device: rrqm/s wrqm/s r/s w/srkB/swkB/s avgrq-sz avgqu-sz await r_await w_await svctm %util` `sdb 0.00 0.000.000.00 0.02 0.0054.15 0.000.070.070.00 0.07 0.00` `sda 0.00 0.180.350.22 6.38 9.0553.51 0.004.991.07 11.20 0.41 0.02
#显示指定磁盘信息
[root@rhel7 ~]# iostat -d /dev/sda``Linux 3.10.0-1160.el7.x86_64 (rhel7) 08/15/2024 _x86_64_ (4 CPU)` `Device:tpskB_read/skB_wrtn/skB_readkB_wrtn` `sda 0.58 6.38 9.05 675114 95767
为了帮助大家更好的学习网络安全,我给大家准备了一份网络安全入门/进阶学习资料,里面的内容都是适合零基础小白的笔记和资料,不懂编程也能听懂、看懂这些资料!
因篇幅有限,仅展示部分资料,需要点击下方链接即可前往获取
[2024最新优快云大礼包:《黑客&网络安全入门&进阶学习资源包》免费分享]

因篇幅有限,仅展示部分资料,需要点击下方链接即可前往获取
[2024最新优快云大礼包:《黑客&网络安全入门&进阶学习资源包》免费分享]


因篇幅有限,仅展示部分资料,需要点击下方链接即可前往获取


 1495
1495

 被折叠的 条评论
为什么被折叠?
被折叠的 条评论
为什么被折叠?
 到【灌水乐园】发言


