在运行一些服务时,我们可能想看看系统指标的占用情况,所以本文将介绍如何在 CentOS 服务器上安装 Prometheus 和 Grafana,并生成系统 CPU、内存使用率的仪表盘,可以按照以下步骤操作。
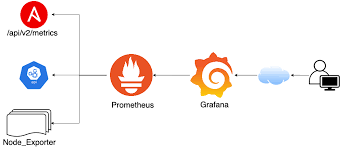
拓扑图

安装Prometheus和Grafana监控主机性能_Grafana

一、安装 Prometheus

  1. 首先,访问 Prometheus 官网 获取最新版本的下载链接,然后使用 wget 下载:

wget  https://github.com/prometheus/prometheus/releases/download/v2.47.0/prometheus-2.47.0.linux-amd64.tar.gz

2. 解压并安装 解压下载的文件:

tar -xvzf prometheus-2.47.0.linux-amd64.tar.gz
将解压后的文件夹移动到 /opt/prometheus:
sudo mv prometheus-2.47.0.linux-amd64 /opt/prometheus
  • 1.
  • 2.
  • 3.
  1. 创建 Prometheus 用户
1. 为了安全,创建一个专用用户来运行 Prometheus:
sudo useradd --no-create-home --shell /bin/false prometheus
sudo chown -R prometheus:prometheus /opt/prometheus
  • 1.
  • 2.
  • 3.
  1. 配置 Prometheus 编辑 Prometheus 配置文件 /opt/prometheus/prometheus.yml:
sudo nano /opt/prometheus/prometheus.yml
添加以下内容:
global:
scrape_interval:15s
scrape_configs:
-job_name:'node_exporter'
static_configs:
-targets:['localhost:9100']
-job_name:"prometheus"
static_configs:
-targets:["localhost:9090"]
  • 1.
  • 2.
  • 3.
  • 4.
  • 5.
  • 6.
  • 7.
  • 8.
  • 9.
  • 10.
  • 11.

5. 创建 Systemd 服务 创建 Systemd 服务文件 /etc/systemd/system/prometheus.service:

sudo nano /etc/systemd/system/prometheus.service
添加以下内容:
[Unit]
Description=Prometheus
Wants=network-online.target
After=network-online.target
[Service]
User=prometheus
Group=prometheus
ExecStart=/opt/prometheus/prometheus \
--config.file=/opt/prometheus/prometheus.yml \
--storage.tsdb.path=/opt/prometheus/data
Restart=always
[Install]
WantedBy=multi-user.target
  • 1.
  • 2.
  • 3.
  • 4.
  • 5.
  • 6.
  • 7.
  • 8.
  • 9.
  • 10.
  • 11.
  • 12.
  • 13.
  • 14.
  • 15.

6. 启动 Prometheus 启动并启用 Prometheus 服务:

sudo systemctl daemon-reload
sudo systemctl start prometheus
sudo systemctl enable prometheus
  • 1.
  • 2.
  • 3.

7. 验证 Prometheus 访问 http://<服务器IP>:9090,如果看到 Prometheus 的 Web 界面,说明安装成功。

二、安装 Node Exporter Node Exporter 用于收集系统指标(如 CPU、内存使用率)。

  1. 下载 Node Exporter
wget https://github.com/prometheus/node_exporter/releases/download/v1.6.1/node_exporter-1.6.1.linux-amd64.tar.gz
  • 1.
  1. 解压并安装
1. tar -xvzf node_exporter-1.6.1.linux-amd64.tar.gz
sudo mv node_exporter-1.6.1.linux-amd64/node_exporter /usr/local/bin/
  • 1.
  • 2.
  1. 创建 Systemd 服务文件 /etc/systemd/system/node_exporter.service:
sudo nano /etc/systemd/system/node_exporter.service
添加以下内容:
[Unit]
Description=Node Exporter
Wants=network-online.target
After=network-online.target
[Service]
User=node_exporter
Group=node_exporter
ExecStart=/usr/local/bin/node_exporter
[Install]
WantedBy=multi-user.target
  • 1.
  • 2.
  • 3.
  • 4.
  • 5.
  • 6.
  • 7.
  • 8.
  • 9.
  • 10.
  • 11.
  • 12.

4. 为用户和组增加权限

sudo useradd -rs /bin/false node_exporter
sudo chown node_exporter:node_exporter /usr/local/bin/node_exporter
sudo chmod 755 /usr/local/bin/node_exporter
  • 1.
  • 2.
  • 3.

5. 启动 Node Exporter

sudo systemctl daemon-reload
sudo systemctl start node_exporter
sudo systemctl enable node_exporter
  • 1.
  • 2.
  • 3.
  1. 验证 Node Exporter 访问 http://<服务器IP>:9100/metrics,如果看到系统指标数据,说明安装成功。

三、安装 Grafana

  1. 下载并安装 Grafana
sudo yum install -y https://dl.grafana.com/enterprise/release/grafana-enterprise-11.5.2-1.x86_64.rpm
  • 1.
  1. 启动 Grafana
sudo systemctl start grafana-server
sudo systemctl enable grafana-server
  • 1.
  • 2.
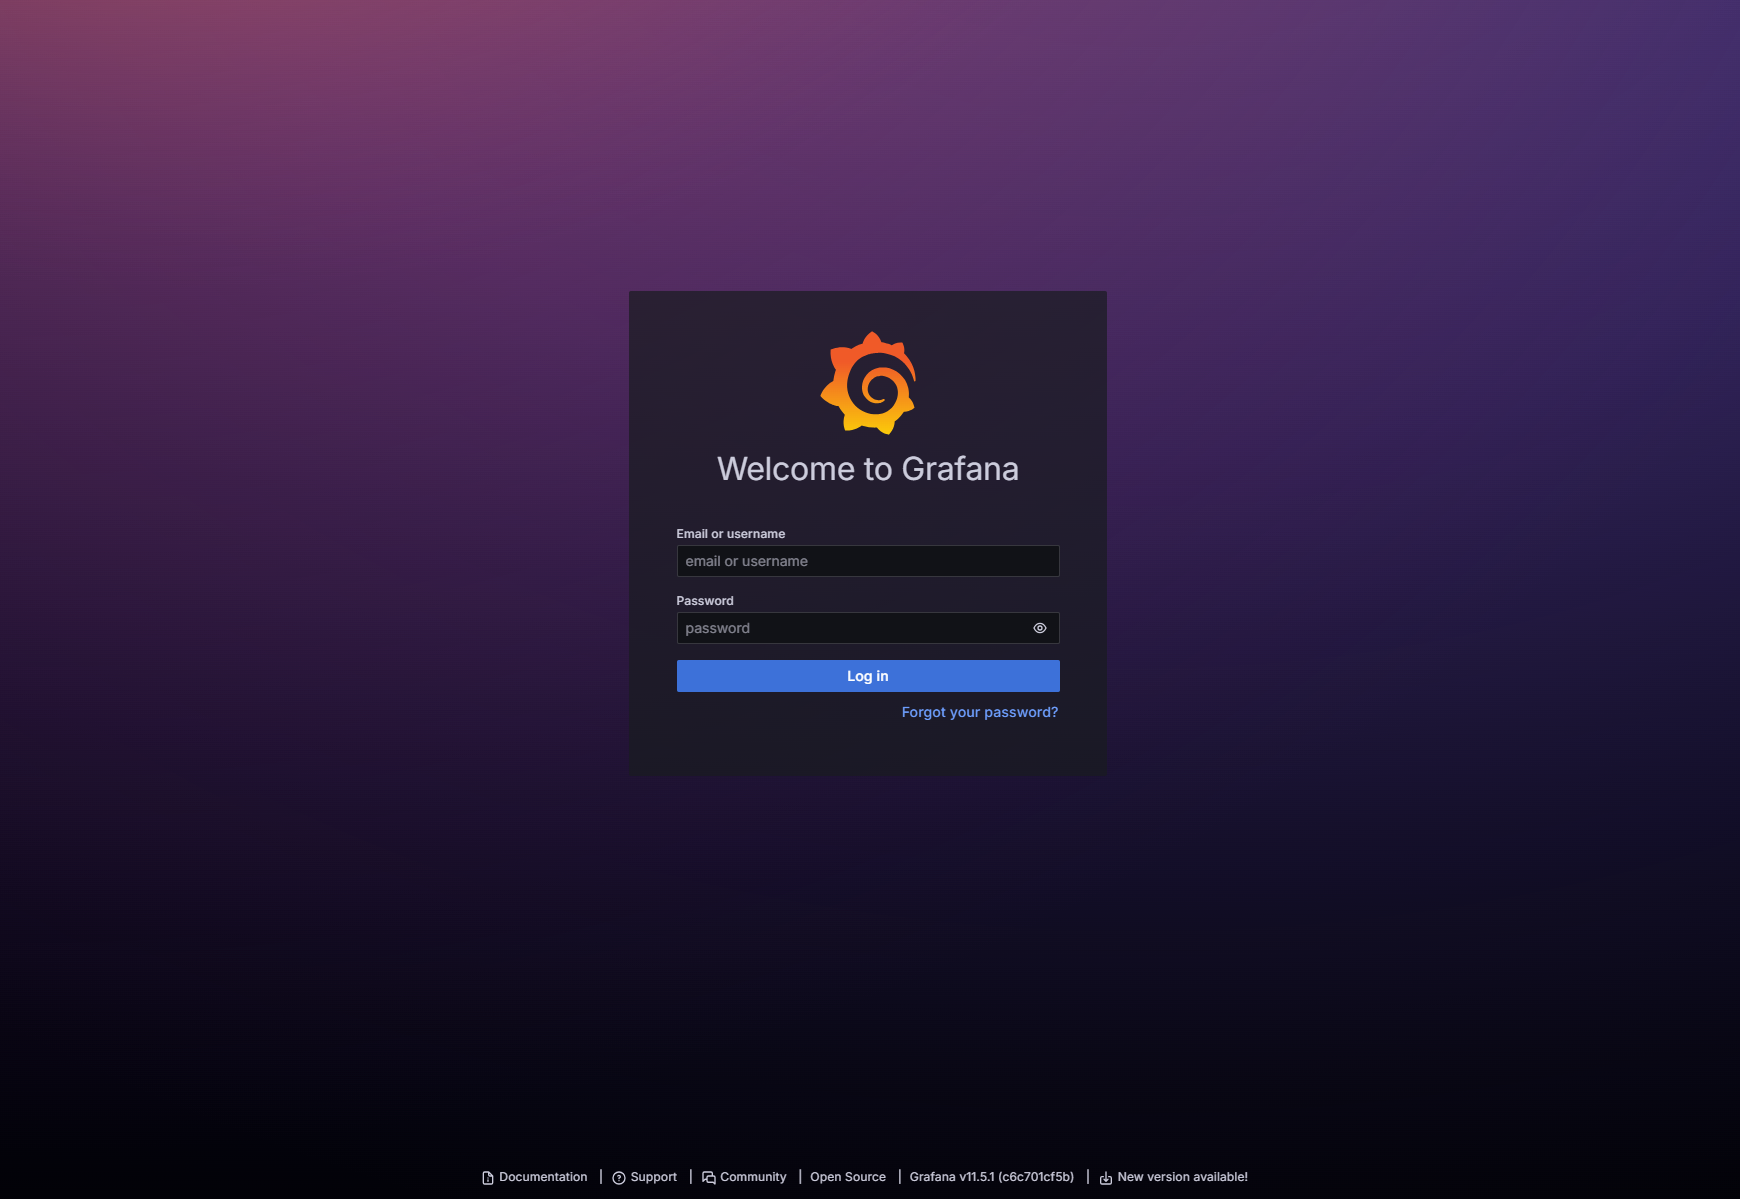
  1. 访问 Grafana 访问 http://<服务器IP>:3000,使用默认账号 admin 和密码 admin 登录。

安装Prometheus和Grafana监控主机性能_linux_02

四、配置 Grafana 仪表盘

  1. 添加 Prometheus 数据源 登录 Grafana,点击左侧菜单的 Configuration > Data Sources。 点击 Add data source,选择 Prometheus。 在 URL 中输入 http://localhost:9090,点击 Save & Test。

安装Prometheus和Grafana监控主机性能_linux_03

安装Prometheus和Grafana监控主机性能_linux_04

  1. 导入 Node Exporter 仪表盘 在 dashboad页面点击 Create > Import。 在 Import via  grafana.com 中输入仪表盘 ID 1860(Node Exporter 官方仪表盘)。 选择 Prometheus 数据源,点击 Import。

安装Prometheus和Grafana监控主机性能_linux_05

  1. 查看仪表盘 导入成功后,你可以看到一个完整的系统监控仪表盘,包含 CPU、内存、磁盘、网络等指标。

安装Prometheus和Grafana监控主机性能_Prometheus_06