


需求说明
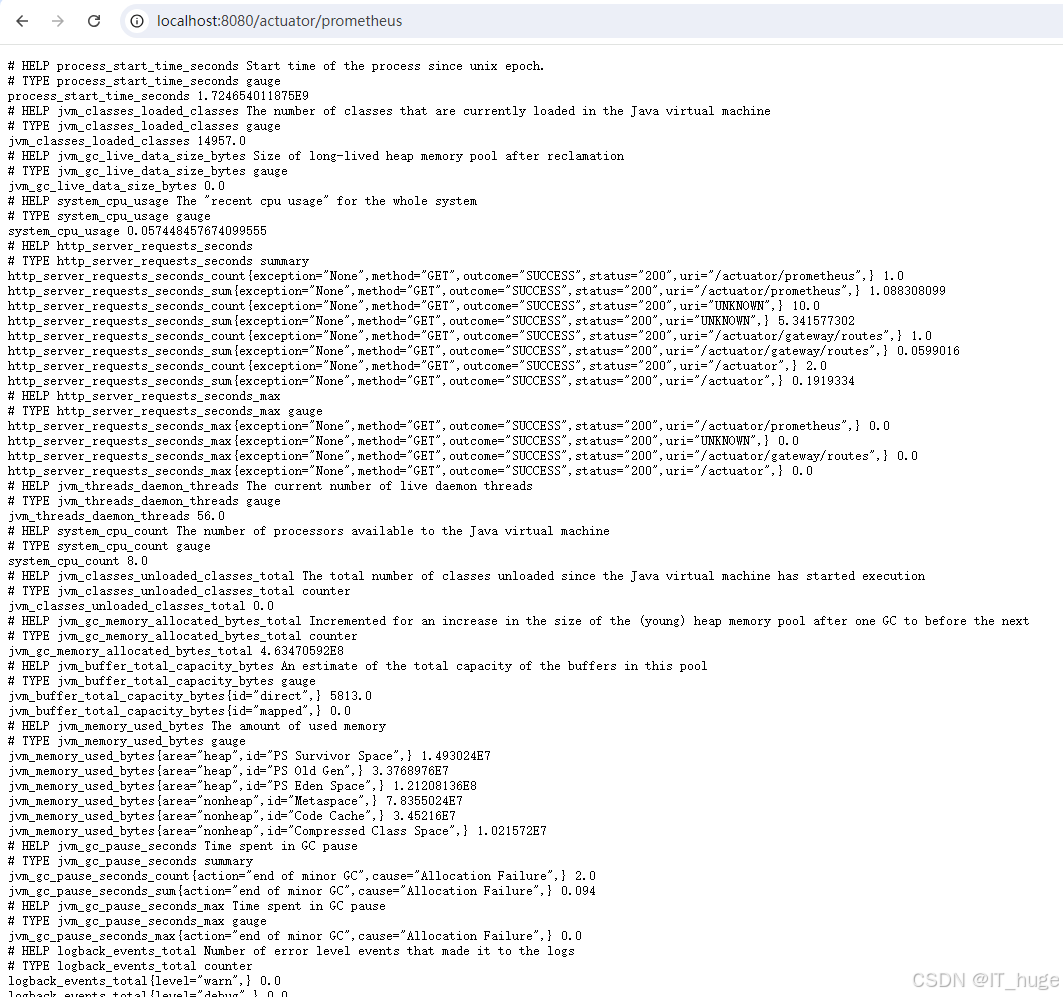
需要在prometheus中对gateway服务进行监控,例如jvm相关指标,计划gateway服务引入spring-boot-starter-actuator和micrometer-registry-prometheus,给prometheus提供端点获取指标数据。
依赖及配置
在gateway服务添加依赖及配置:
<dependency>
    <groupId>org.springframework.boot</groupId>
    <artifactId>spring-boot-starter-actuator</artifactId>
</dependency>
<dependency>
    <groupId>io.micrometer</groupId>
    <artifactId>micrometer-core</artifactId>
</dependency>
<dependency>
    <groupId>io.micrometer</groupId>
    <artifactId>micrometer-registry-prometheus</artifactId>
</dependency>
management:
  endpoints:
    web:
      exposure:
        include: "*"
  metrics:
    export:
      prometheus:
        enabled: true #开启prometheus端点
启动网关服务即可查看监控信息
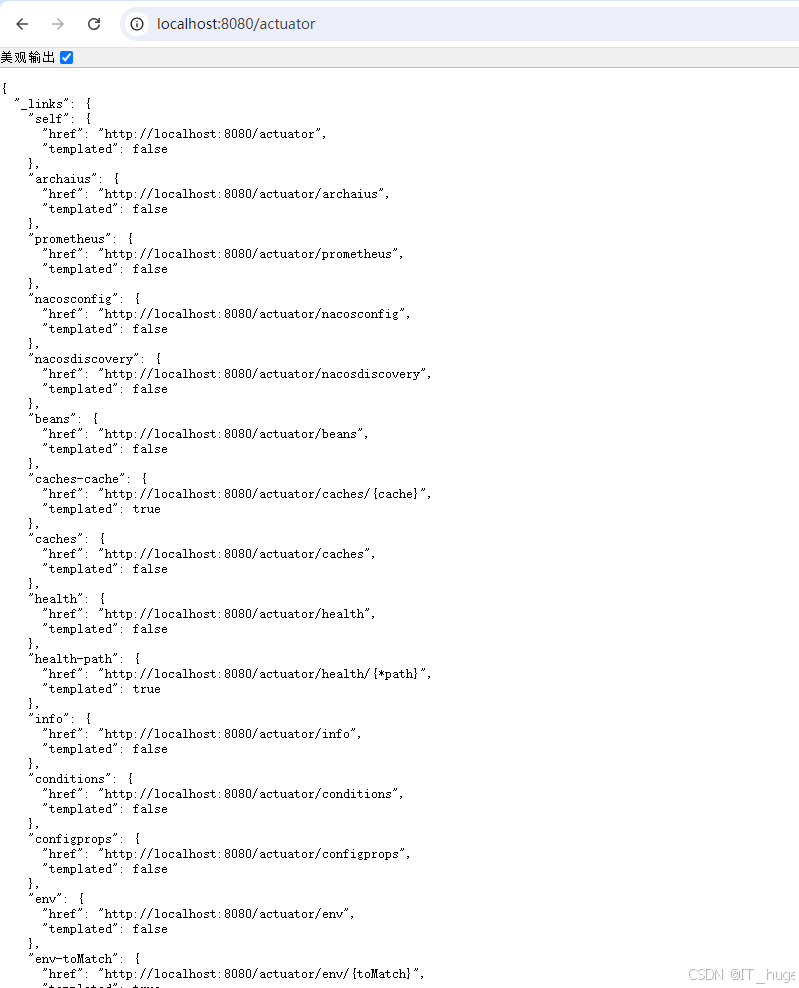
通过actuator可以看到我们开放了很多端点,能获取到很多监控信息,但同时也存在安全风险,例如通过/actuator/env可以获取到服务的环境变量,通过actuator/gateway/routes可以查看路由信息,甚至可以修改路由,这些都是非常危险的操作;下边我们将对这些安全风险进行优化。
安全风险修复
风险修复可以有有以下三点:
1.把不需要的端点关掉
2.修改base-path
3.增加配置访问权限验证
针对1和2是在配置文件中修改相应配置,3我这里是用filter来拦截请求做验证。
把不需要的端点关掉,修改base-path,在配置文件中修改:
management:
  endpoints:
    web:
      base-path: /newPath  #修改base-path
      exposure:
        include: "*"
        exclude: env,beans   #关掉不需要的端点
  metrics:
    export:
      prometheus:
        enabled: true  #开启prometheus端点
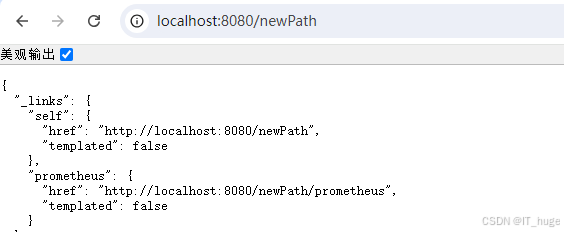
修改完重启网关服务,访问新端点获取监控数据
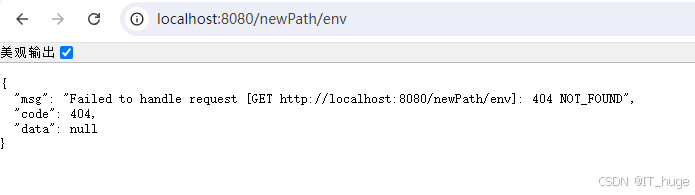
验证被关掉的端点已不存在
增加配置访问权限验证:
在gateway中我们通过WebFlux中的WebFilter来实现过滤,对监控相关的请求做验证
import org.springframework.stereotype.Component;
import org.springframework.web.server.ServerWebExchange;
import org.springframework.web.server.WebFilter;
import org.springframework.web.server.WebFilterChain;
import reactor.core.publisher.Mono;

@Component
public class CustomAuthenticationWebFilter implements WebFilter {
    @Override
    public Mono<Void> filter(ServerWebExchange exchange, WebFilterChain chain) {
       // 获取请求路径
       String path = exchange.getRequest().getURI().getPath();
       // 是否Actuator请求,判断请求路径是否包含newPath
       if(!path.contains("newPath")){
          return chain.filter(exchange);
       }
       String token = exchange.getRequest().getHeaders().getFirst("Actuator-Authorization");
       // 验证Token
       // 如果验证成功,则继续传递请求
       if (token != null && token.equals("xxxxxxxxxxxxx")) {
          return chain.filter(exchange);
       } else {
          // 如果验证失败,则返回401 Unauthorized
          return Mono.error(new RuntimeException("Unauthorized"));
       }
    }
}
import org.springframework.context.annotation.Bean;
import org.springframework.context.annotation.Configuration;

@Configuration
public class WebFilterConfiguration {
    @Bean
    public CustomAuthenticationWebFilter customAuthenticationWebFilter() {
       return new CustomAuthenticationWebFilter();
    }
}
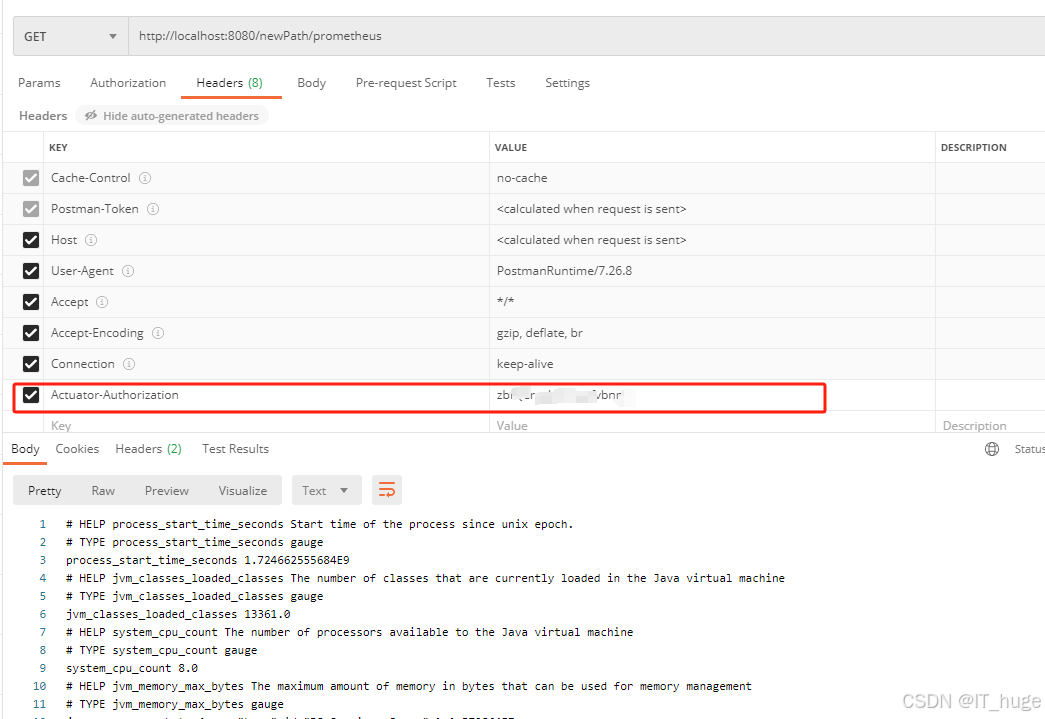
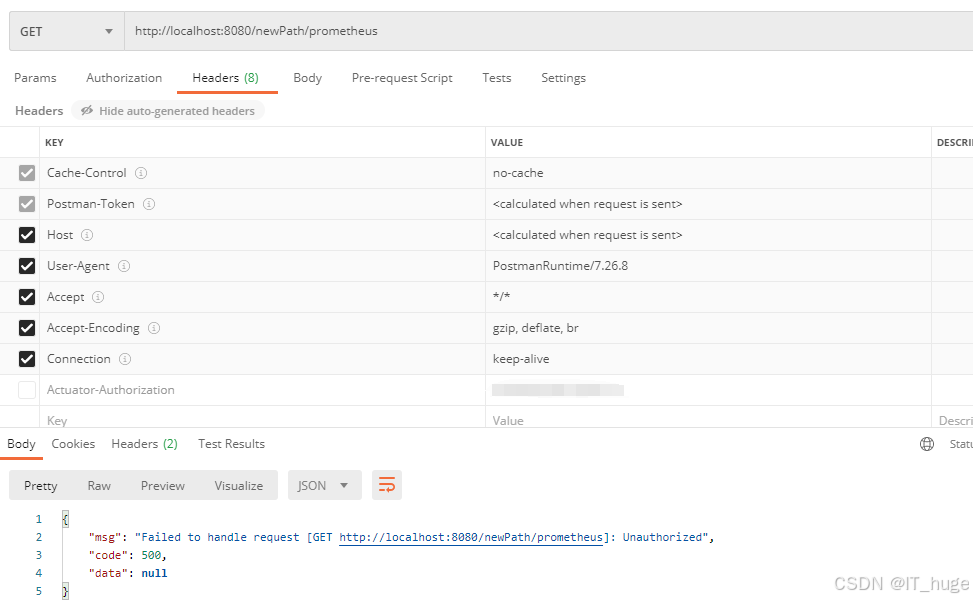
以上代码我们是在请求头中设置约定的token信息,在filter中做验证,没有token 信息或者与约定的token值不一致则认定非法调用。
验证带约定token调用,可以返回正常数据:
验证不带token调用,提示Unauthorized:


 1141
1141


 到【灌水乐园】发言


