Cumulative Histogram
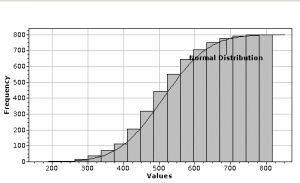
The cumulative histogram is a histogram in which the vertical axis gives not just the counts for a single bin, but rather gives the counts for that bin plus all bins for smaller values of the response variable.
Contents
[hide]Background
Let I:Q -> [0,1] be an image and h is the distribution of its values (a histogram). The cumulative histogram of I is the function H: [0,1] -> [0,1] defined by
<math> H(x)=\int_0 ^x h(t)d(t) </math>
Image types
One can apply the Cumulative Histogram algorithm to 2D, 2.5D and 3D grayscale and color (RGB) images. For RGB images the algorithm will display a separate cumulative histogram for each channel (R, G, and B).
Examples
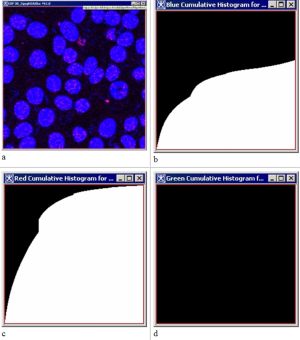
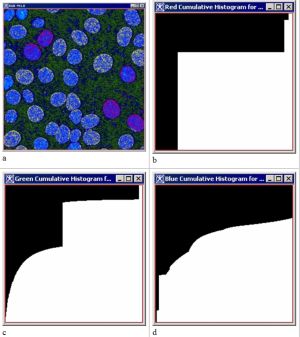
Following examples display cumulative histograms for grayscale and RGB images. Figure 12 shows a 3D grayscale image (a) and its cumulative histogram (b). Figure 13 and Figure 14 show 2D RGB images and their cumulative histograms for each channel. Note that, the RGB image from Figure 13 has in fact only two color channels - Red and Blue, therefore its cumulative histogram for the Green channel shows nothing.
Applying Cumulative Histogram algorithm to images
To apply Cumulative Histogram to grayscale images
- Open an image of interest.
- In the main MIPAV window, navigate to Algorithms > Histogram Tools > Cumulative Histogram.
- The algorithm starts running and the cumulative histogram appears in a new image frame. See Figure 12.
To apply Cumulative Histogram to RGB images
- Open an image of interest.
- Call Algorithms > Histogram Tools > Cumulative Histogram from the main MIPAV menu.
- The algorithm starts running and the cumulative histograms for each channel (R,G, and B) appear. See Figure 13 and Figure 14.
References
J. Delon, Midway Image Equalization, Journal of Mathematical Imaging and Vision, vol.21, no.2, pp.119-134, 2004.
Understanding Histograms in Digital Photography
See also:
- Histogram Equalization: Regional Adaptive
- Histogram Equalization: Neighborhood Adaptive
- Histogram Matching
- 2D Histogram


 本文深入探讨了累积直方图的概念及其在灰度和RGB图像中的应用。详细介绍了如何通过MIPAV工具实现累积直方图,并通过实例展示了其在图像分析中的作用。


 1097
1097

 被折叠的 条评论
为什么被折叠?


