


 本文是一篇关于Graphviz的详细教程,从安装到实际绘图,包括普通图、树状图、子图的创建,以及图形属性的调整。通过实例讲解如何使用dot语法绘制有向图、改变节点和边的属性,以及绘制复杂的树状图和哈希表结构。此外,还介绍了子图的定义及其高级用法,并列举了主要的节点、边和图属性。
介绍
Graphviz是一个常用的绘图工具,可以通过编写dot脚本绘制一系列的图片,例如流程图、树形图等框架图,并使用dot命令生成图片。
安装
可以到Graphviz官网下载安装包:下载地址
安装完成后,将其安装地址的...\Graphviz2.38\bin文件夹加入环境变量
普通图
简单画图
关于Graphviz的语法我就不详细说了,网上有许多资料,我希望是通过例子来帮助大家理解如何使用。
首先你需要新建一个文本文档(txt)就行,然后打开文档,开始画图吧。
首先画一个有向图:
digraph G{
}
这时候我们就定义个一个有向图,接下来我们需要在中间加入一些自定义的结点。
digraph G{
	a->b;
	b->c;
	a->c;
}
好了,我们已经定义好一个简单的有向图了,然后我们将其保存为deme.dot(记得要改后缀名.dot)。
接下来我们利用dot命令将其导出。
打开CMD窗口,进入该demo.dot所在目录,然后输入如下命令:
dot -Tpng demo.dot -o demo.png
我们可以看到已经生成了一个.png文件,如图所示

进阶画图
上面只是展示了如何画一个简单的图,那么,如果我想改变结点的形状,线的颜色之类的属性,如何画图呢?让我们看看下面的代码:
digraph G{
	a->b->c[color=red];
	a->c [label="a to c"];
	b->{d,e}  [style=dotted];
	a [shape=polygon,sides=5,peripheries=4,color=lightblue,style=filled];
	c [shape=box];
	d [shape=triangle,label="I am d"];
}
同样通过如下命令导出png图片:
dot -Tpng demo.dot -o demo.png

你会发现,我们修改了结点及边的属性,how?
对于每条边,只要在其后面增加一对[],里面填入需要修改的属性,而对于结点,只需要在后面增加几条语句对其定义属性就可以了,是不是很有趣?
树状图
digraph G {
	node [shape=record,height=.3];
		node0[label = "<f0> |<f1> G|<f2> "];
		node1[label = "<f0> |<f1> E|<f2> "];
		node2[label = "<f0> |<f1> B|<f2> "];
		node3[label = "<f0> |<f1> F|<f2> "];
		node4[label = "<f0> |<f1> R|<f2> "];
		node5[label = "<f0> |<f1> H|<f2> "];
		node6[label = "<f0> |<f1> Y|<f2> "];
		node7[label = "<f0> |<f1> A|<f2> "];
		node8[label = "<f0> |<f1> C|<f2> "];
		node0:f2 -> node4:f1;
		node0:f0 -> node1:f1;
		node1:f0 -> node2:f1;
		node1:f2 -> node3:f1;
		node2:f2 -> node8:f1;
		node2:f0 -> node7:f1;
		node4:f2 -> node6:f1;
		node4:f0 -> node5:f1;
	node [color=red,height=.1];
		a->b;
		c->d;

}
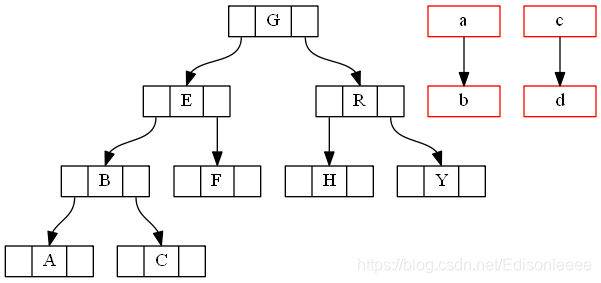
可以看到,我们用它画了一个树状图,代码中是什么含义呢?
- 首先我们定义一个
node类,其下的所有结点都是record类型,并且height=0.3 - 然后每个
record结点使用HTML语法<f0>添加标签,并且利用|类似表格分隔, - 接下来对每个结点,我们指定它的哪一部分和下一结点的哪一部分相连。
- 最后又定义一个
node类,为a指向b。 - 为了更清晰的了解每一个
node类的范围,最好用一对{}将其包围起来。
哈希表
digraph G {
    nodesep=.05;
    rankdir=LR;
    node [shape=record,width=.1,height=.1];
    node0 [label = "<f0> |<f1> |<f2> |<f3> |<f4> |<f5> |<f6> | ",height=2.5];
    node [width = 1.5];
    node1 [label = "{<n> n14 | 719 |<p> }"];
    node2 [label = "{<n> a1  | 805 |<p> }"];
    node3 [label = "{<n> i9  | 718 |<p> }"];
    node4 [label = "{<n> e5  | 989 |<p> }"];
    node5 [label = "{<n> t20 | 959 |<p> }"];
    node6 [label = "{<n> o15 | 794 |<p> }"];
    node7 [label = "{<n> s19 | 659 |<p> }"];
    node0:f0 -> node1:n;
    node0:f1 -> node2:n;
    node0:f2 -> node3:n;
    node0:f5 -> node4:n;
    node0:f6 -> node5:n;
    node2:p -> node6:n;
    node4:p -> node7:n;
  }
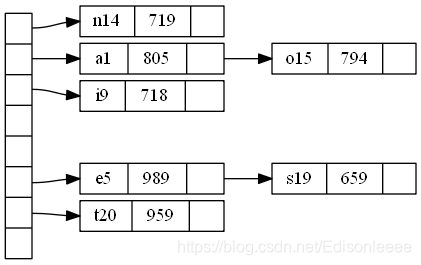
解释一下:
- 首先我们设定了一些属性:
nodesep为,rankdir=LR(left to right为结点的方向,默认是TP(top to bottom) - 然后再定义了一个结点类,为左边的竖框
- 再定义一个新的结点类,为右边的哈希结点
- 注意到这次使用的标签不再是
<f>而是换成了其他的<n>, <p>
子图
定义子图
digraph G {
	subgraph cluster0 {
		node [style=filled,color=white];
		style=filled;
		color=lightgrey;
		a0 -> a1 -> a2 -> a3;
		label = "process #1";
	}
	subgraph cluster1 {
		node [style=filled];
		b0 -> b1 -> b2 -> b3;
		label = "process #2";
		color=blue
	}
	start -> a0;
	start -> b0;
	a1 -> b3;
	b2 -> a3;
	a3 -> a0;
	a3 -> end;
	b3 -> end;

	start [shape=Mdiamond];
	end [shape=Msquare];
}
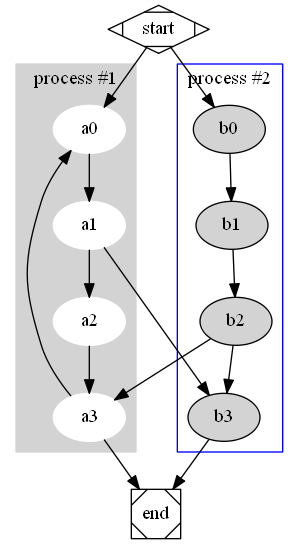
这时我们定义了两个子图,并且在子图中定义子图的label、color,filled等属性,并且在其中还定义了结点类,其中一些语句的功能,相信你看代码能够理解。
子图进阶
digraph G {
	compound=true;
	subgraph cluster0 {
		a -> b;
		a -> c;
		b -> d;
		c -> d;
	}
	subgraph cluster1 {
		e -> g;
		e -> f;
	}
	b -> f [lhead=cluster1];
	d -> e;
	c -> g [ltail=cluster0,lhead=cluster1];
	c -> e [ltail=cluster0];
	d -> h;
}
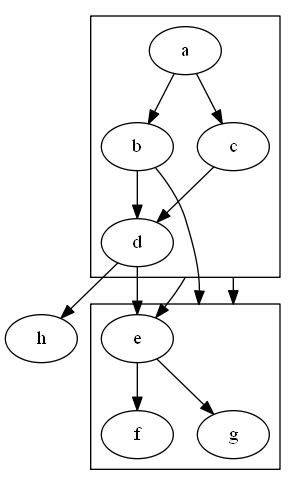
这里我们设定了compound属性,使其能够使得结点与子图相连,同时,连接线不覆盖子图,并使用ltail和lhead定义连接的头尾。
附录
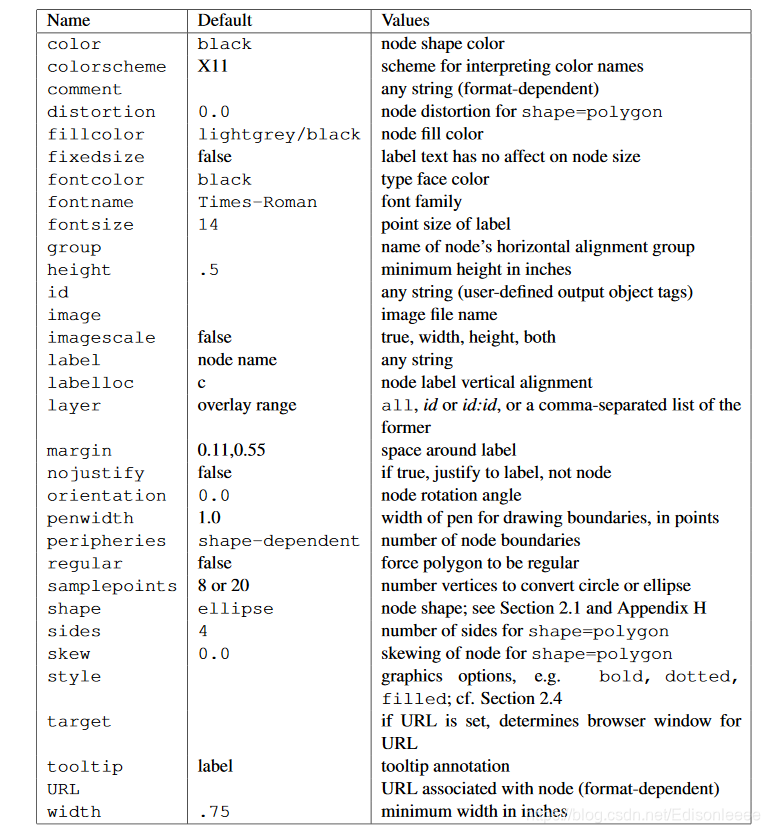
主要结点属性
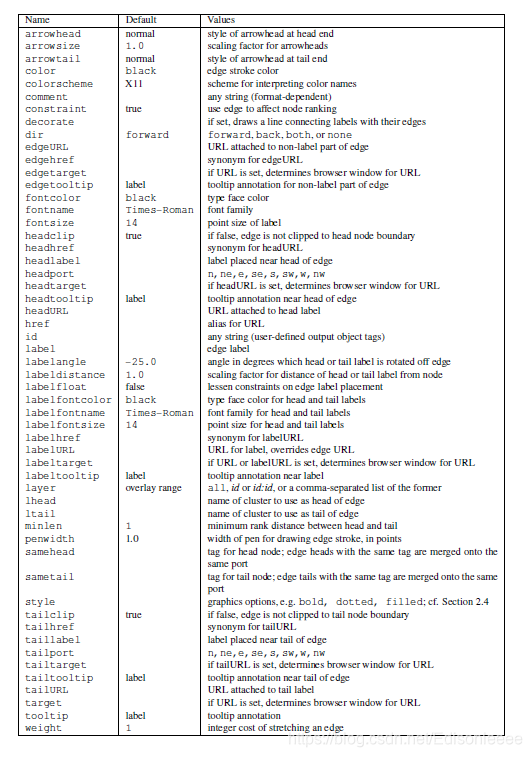
主要边属性
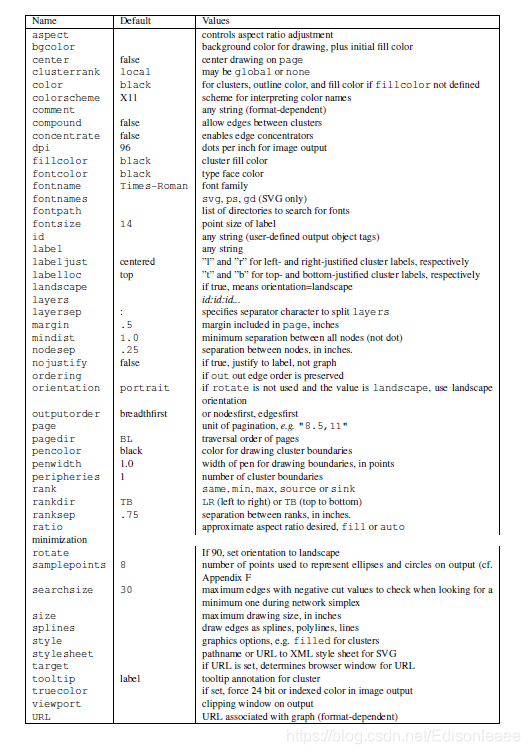
主要图属性
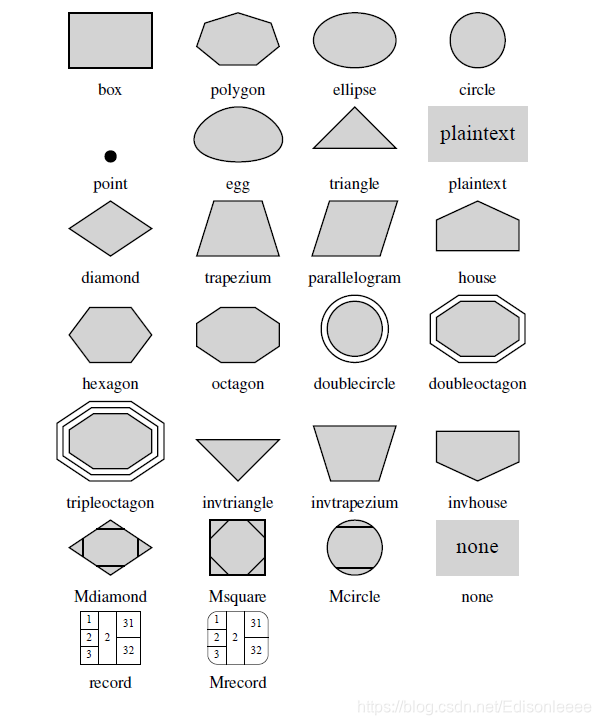
结点形状
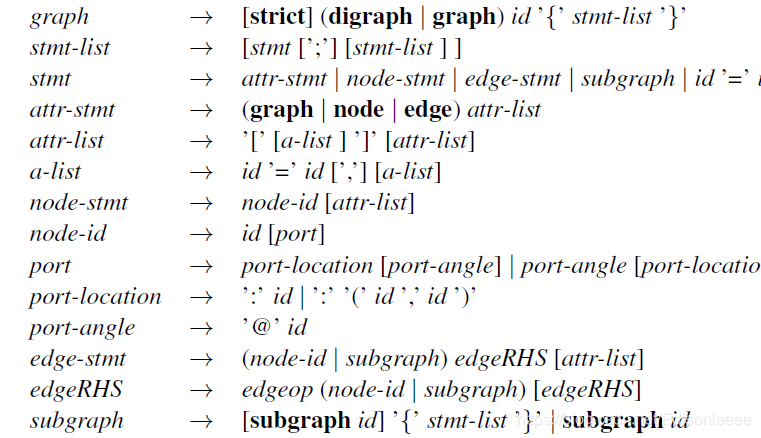
dot语法


 3万+
3万+

 被折叠的 条评论
为什么被折叠?
被折叠的 条评论
为什么被折叠?
 到【灌水乐园】发言


