


 本文介绍了如何爬取必应网站上的新冠疫情数据并利用folium、geopandas和cartopy进行地图可视化。通过folium创建交互式地图,geopandas结合地理信息进行空间分析,cartopy则提供多种投影方式绘制高颜值地图。
众所周知,新冠肺炎疫情是一次很流行的全球性公共卫生事件。如今我国疫情已经好了许多,但世界各国的疫情依然严峻。特殊时期,正好尝试一下疫情网络数据的抓取,并用几种python库对数据进行简单的地图可视化(folium,geopandas,cartopy)。
1. 爬取疫情数据
许多网站都记录了实时的疫情数据,但不是所有的数据都可爬。这里用的是必应的新冠肺炎追踪(https://www.bing.com/covid),理由是(1)它的源代码里有所有详细的数据;(2)从全球到国家到地方都有数据,结构是嵌套的,详细全面可爬;(3)重点,数据居然带经纬度信息!这对地理制图就很友好了。
import urllib.request as req
import bs4
import json
# read source code and scrape data
url = 'https://www.bing.com/covid'
response = req.urlopen(url)
data = response.read().decode('utf-8')
root = bs4.BeautifulSoup(data, "html.parser")
text = root.find(id="main").get_text()
maintext = text[9:-1]
textlist = json.loads(maintext) # str to list
del url, response, data
# country data
countryData = textlist["areas"]
for country in countryData:
templist = []
templist.append(country["id"])
templist.append(country["displayName"])
templist.append(country["totalConfirmed"])
templist.append(country["totalDeaths"])
templist.append(country["totalRecovered"])
try: # some coordinate data is missed
templist.append(country["long"])
templist.append(country["lat"])
except:
pass
datalist.append(templist)
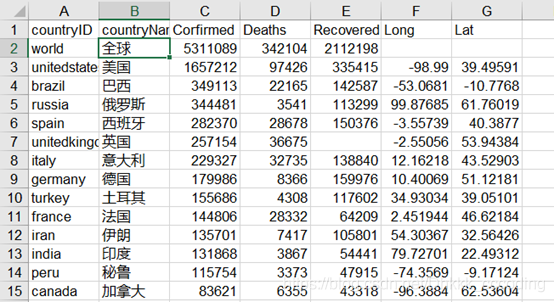
del templist根据网页源代码,每个地区的数据都存在一个字典里面,字典字段包含id,displayName,areas,totalConfirmed,totalDeaths,totalRecovered,lat,long等等,其中areas里面是该地区内的子区域数据,例如美国加州的数据就在美国字典里的areas里面,所以各级的数据都可以找到。这里就简单爬个全球各国家、地区的确诊,死亡,治愈人数。爬下来之后写进excel,一共有两百多个国家或地区,长这样:
2 可视化
有了这些数据之后开始制图,这里尝试了三种python库:(1)folium;(2)
 最低0.47元/天 解锁文章


 7万+
7万+

 被折叠的 条评论
为什么被折叠?
被折叠的 条评论
为什么被折叠?
 到【灌水乐园】发言


