


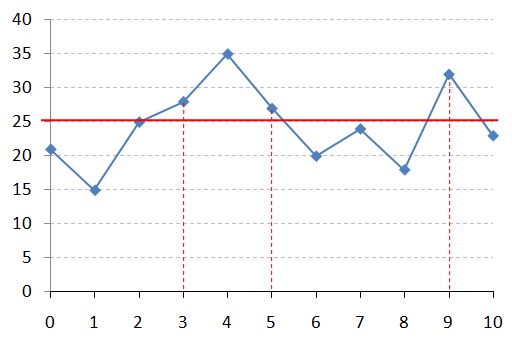
上图是用某科学研究中采集的数据绘制成的折线图,其中红色横线表示正常数据的阈值(在此图中阈值是 25)。你的任务就是把超出阈值的非正常数据所在的区间找出来。例如上图中横轴 [3, 5] 区间中的 3 个数据点超标,横轴上点 9 (可以表示为区间 [9, 9])对应的数据点也超标。
输入格式:
输入第一行给出两个正整数 N(≤104)和 T(≤100),分别是数据点的数量和阈值。第二行给出 N 个数据点的纵坐标,均为不超过 1000 的正整数,对应的横坐标为整数 0 到 N−1。
输出格式:
按从左到右的顺序输出超标数据的区间,每个区间占一行,格式为 [A, B],其中 A 和 B 为区间的左右端点。如果没有数据超标,则在一行中输出所有数据的最大值。
输入样例 1:
11 25
21 15 25 28 35 27 20 24 18 32 23
输出样例 1:
[3, 5]
[9, 9]
输入样例 2:
11 40
21 15 25 28 35 27 20 24 18 32 23
输出样例 2:
35
C++:
#include <iostream>
#include <vector>

using namespace std;

int main() {
    int N, T;
    cin >> N >> T;
    vector<int> data(N);
    for (int i = 0; i < N; i++) {
        cin >> data[i];
    }

    int max_val = 0;
    vector<pair<int, int>> over_threshold_intervals;
    bool is_over_threshold = false;
    int start_idx = 0;

    for (int i = 0; i < N; i++) {
        max_val = max(max_val, data[i]);
        if (data[i] > T) {
            if (!is_over_threshold) {
                is_over_threshold = true;
                start_idx = i;
            }
        } else {
            if (is_over_threshold) {
                over_threshold_intervals.push_back({start_idx, i-1});
                is_over_threshold = false;
            }
        }
    }

    // Handle the case when the last interval goes up to the end
    if (is_over_threshold) {
        over_threshold_intervals.push_back({start_idx, N-1});
    }

    if (over_threshold_intervals.empty()) {
        cout << max_val << endl;
    } else {
        for (const auto& interval : over_threshold_intervals) {
            cout << "[" << interval.first << ", " << interval.second << "]" << endl;
        }
    }

    return 0;
}


 125
125

 被折叠的 条评论
为什么被折叠?
被折叠的 条评论
为什么被折叠?
 到【灌水乐园】发言


