1、首先添加以下四个dll引用
System.Drawing.dll

System.Windows.Forms.dll

WindowsFormsIntegration.dll

System.Windows.Forms.DataVisualization.dll
2、xml添加命名空间
xmlns:Wchart="clr-namespace:System.Windows.Forms.DataVisualization.Charting;assembly=System.Windows.Forms.DataVisualization"
3、WPF是不可以直接引用WinForm Chart,但可以托管在WindowsFormsHost中使用,所以我们要添加一个宿主容器
**ps:Windows窗口 设置 AllowsTransparency="False",才能显示Winfrom Chart控件**
<Grid Margin="4 4 4 2">
  <Grid.ColumnDefinitions>
       <ColumnDefinition/>
       <ColumnDefinition Width="100"/>
   </Grid.ColumnDefinitions>
   <Grid  Margin="5" Background="WhiteSmoke">
       <WindowsFormsHost >
           <Wchart:Chart x:Name="ChartPlot" >
               <!--<Wchart:Chart.ChartAreas>
                       <Wchart:ChartArea>
                           <Wchart:ChartArea.AxisY>
                               <Wchart:Axis></Wchart:Axis>
                           </Wchart:ChartArea.AxisY>
                       </Wchart:ChartArea>
                   </Wchart:Chart.ChartAreas>-->
           </Wchart:Chart>
       </WindowsFormsHost>
   </Grid>
   <StackPanel x:Name="IsEnableChannel" Orientation="Vertical" Grid.Column="1" VerticalAlignment="Center" HorizontalAlignment="Center">

   </StackPanel>
</Grid>
4.后台代码.cs添加命名空间
using System.Windows.Forms;
using System.Windows.Forms.DataVisualization.Charting;
5、后台代码:
a、图表初始化
#region 初始化图表
private ChartArea AREA = new ChartArea() {
Name = "Line" };
private Legend LEGEND = new Legend();
private void initChart(int lineCount)
{
ChartPlot.Series.Clear();
ChartPlot.ChartAreas.Clear();
ChartPlot.Legends.Clear();
AREA.AxisX.Enabled


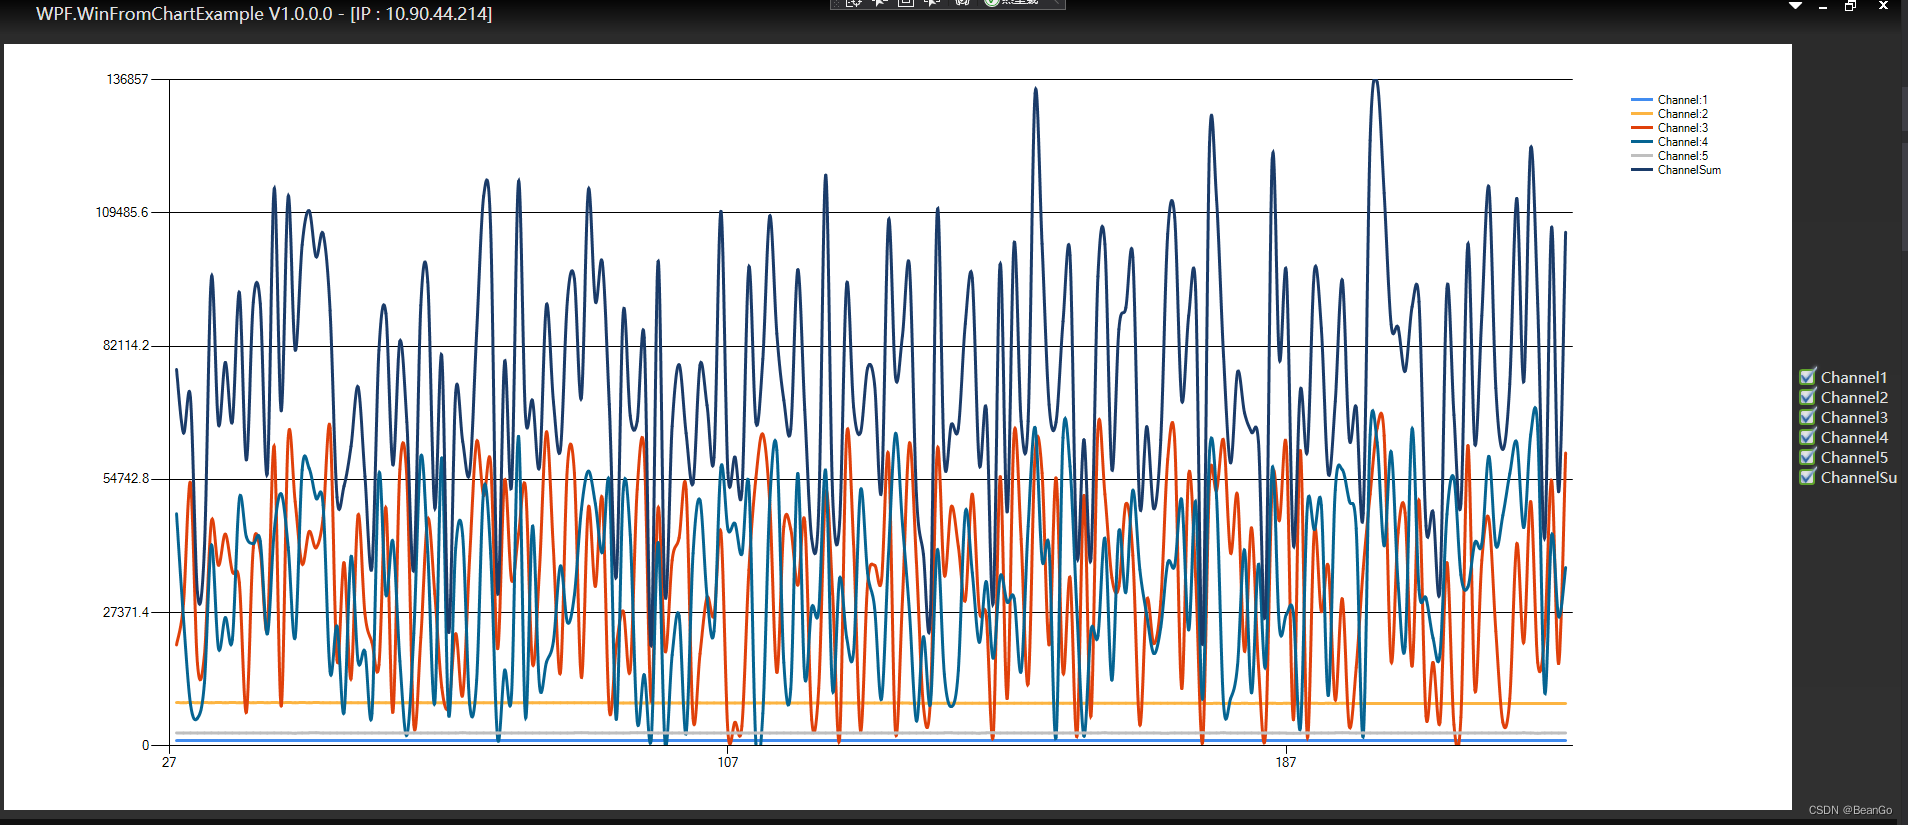
 本文介绍了如何在WPF应用中使用Windows Forms的Chart控件来显示实时曲线。首先需要添加相关DLL引用和XML命名空间,接着在WPF界面中通过WindowsFormsHost作为宿主容器嵌入Chart控件。然后在后台代码中初始化图表并实时从USB设备获取数据进行更新。
 最低0.47元/天 解锁文章


 3万+
3万+

 被折叠的 条评论
为什么被折叠?
被折叠的 条评论
为什么被折叠?
 到【灌水乐园】发言


