


 本文介绍了在WPF应用程序中如何控制WinForm Chart控件的曲线显示与隐藏,通过设置Series的Enabled属性来实现线条的开关,并利用IsVisibleInLegend属性控制线条在图例中的显示状态。
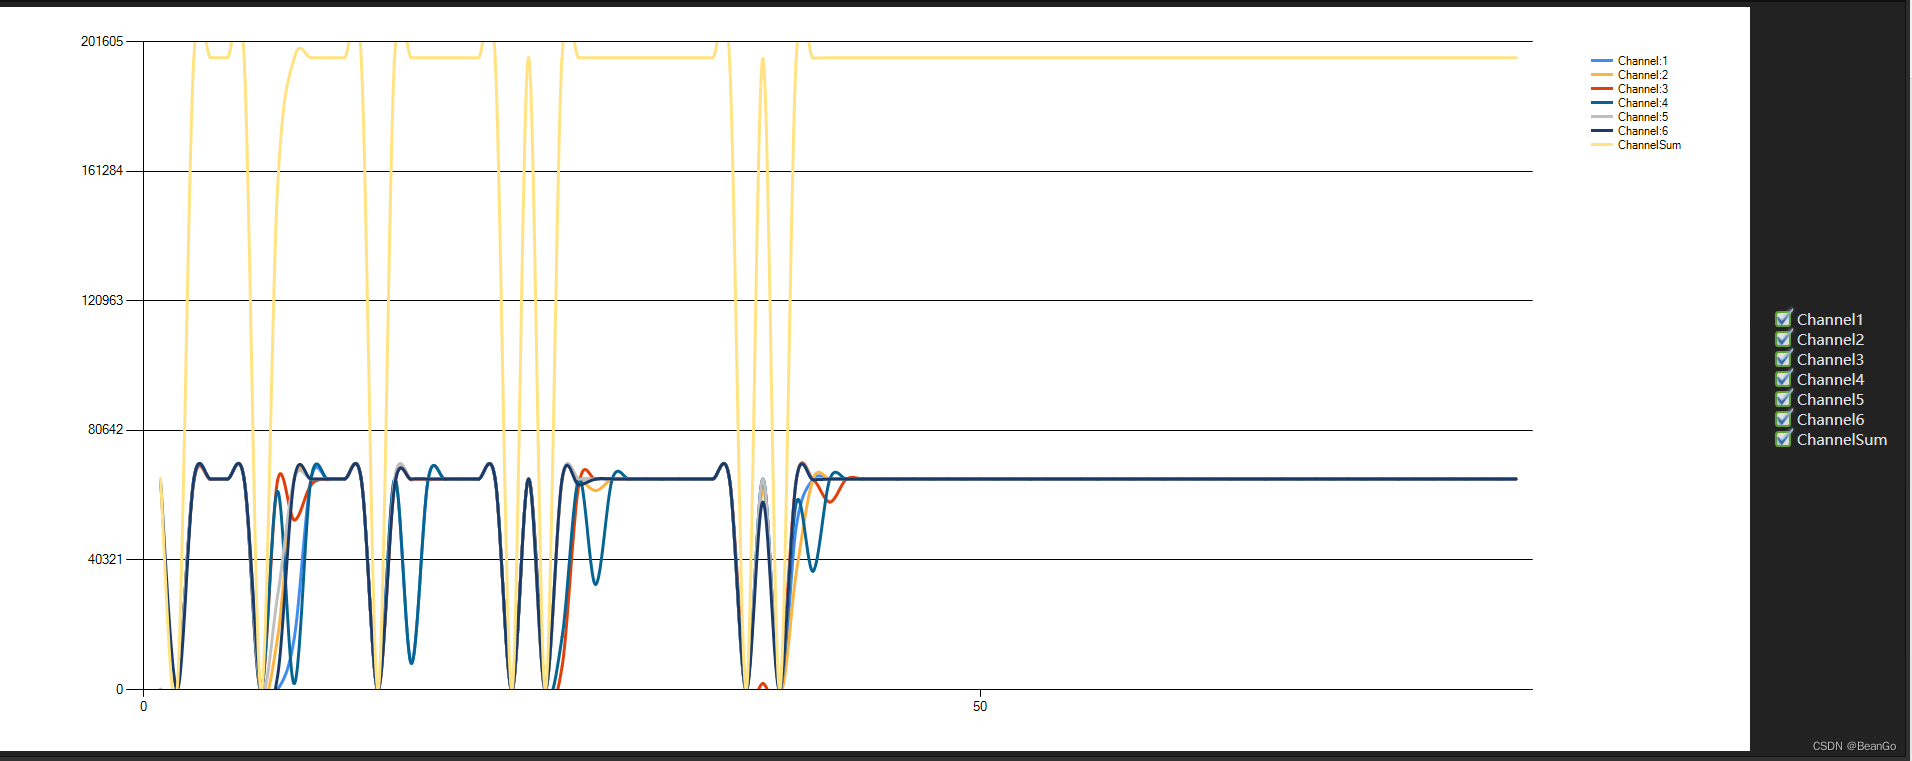
图表
Xml
<Grid>
   <Grid.ColumnDefinitions>
       <ColumnDefinition/>
       <ColumnDefinition Width="150"/>
   </Grid.ColumnDefinitions>
   <Grid  Margin="5" Background="WhiteSmoke">
       <WindowsFormsHost >
           <Wchart:Chart x:Name="ChartPlot" >
               <!--<Wchart:Chart.ChartAreas>
               <Wchart:ChartArea>
                   <Wchart:ChartArea.AxisY>
                       <Wchart:Axis></Wchart:Axis>
                   </Wchart:ChartArea.AxisY>
               </Wchart:ChartArea>
           </Wchart:Chart.ChartAreas>-->
           </Wchart:Chart>
       </WindowsFormsHost>
   </Grid>
   <StackPanel x:Name="IsEnableChannel" Orientation="Vertical" Grid.Column="1" VerticalAlignment="Center" HorizontalAlignment="Center">

   </StackPanel>
</Grid>
初始化图表
       private ChartArea AREA = new ChartArea() { Name = "Line" };             // 画图区域
        private Legend LEGEND = new Legend();                                   // 一个图例
        private void initChart(int lineCount,bool isChannelSum)
        {
            ChartPlot.Series.Clear();
            ChartPlot.ChartAreas.Clear();
            ChartPlot.Legends.Clear();

            AREA.AxisX.Enabled = AxisEnabled.True;                  // 使X轴可用
            AREA.AxisX.Interval = 50;
            AREA.AxisX.IntervalAutoMode = IntervalAutoMode.VariableCount;//IntervalAutoMode.FixedCount;// IntervalAutoMode.VariableCount;   // X 轴标签数量,由显示的数据点数量自动调整
            AREA.AxisX.MajorGrid.Enabled = false;
            AREA.AxisY.Enabled = AxisEnabled.True;
            //AREA.AxisY.Interval = 5.0;
            AREA.AxisY.MajorTickMark.Enabled = true;
            AREA.AxisY.Maximum = 22;//double.Parse(TestConfig.Instance.AxisYMax);
            AREA.AxisY.Minimum = 0.0;

            //AREA.CursorX.IsUserSelectionEnabled = true;             // 鼠标选择区域放大
            //AREA.BackColor = System.Drawing.Color.FromArgb(0, 0, 0);


            // series设置
            //SERIES.Color = System.Drawing.Color.FromArgb(0, 0, 0);
            //SERIES.ChartArea = "Line";
            //SERIES.ChartType = SeriesChartType.Spline;                // 折线图
            //SERIES.Name = "重力值";
            //SERIES.ToolTip = "数值:\n#VALY";                      // 鼠标悬浮在点上面显示提示(不够灵敏)
            //SERIES.BorderWidth = 2;

            // series设置
            //SERIES1.Color = System.Drawing.Color.FromArgb(255, 0, 0);
            //SERIES1.ChartArea = "Line";
            //SERIES1.ChartType = SeriesChartType.Line;                // 折线图
            //SERIES1.Name = "限值";

            for(int i = 0; i < lineCount; i++)
            {
                Series SERIES = new Series();
                SERIES.ChartType = SeriesChartType.Spline;
                SERIES.BorderWidth = 3;

                SERIES.Name = "Channel:" + (i + 1).ToString();

                if (isChannelSum)
                {
                    if(i == lineCount -1)
                    {
                        SERIES.Name = "ChannelSum";
                    }
                }

                ChartPlot.Series.Add(SERIES);
            }

            // legend设置
            LEGEND.Alignment = System.Drawing.StringAlignment.Near;         // legend靠近显示,不然太占用地方了
            LEGEND.Docking = Docking.Right;                                  // 靠左显示
            LEGEND.DockedToChartArea = "Line";                              // 默认图例是显示在图的外面,占用地方
            LEGEND.IsDockedInsideChartArea = false;                          // 将图例放在图里面
            LEGEND.BackColor = System.Drawing.Color.Transparent;            // 无背景色,不然会挡住折线

            // 添加area series legend
            ChartPlot.ChartAreas.Add(AREA);

            ChartPlot.Legends.Add(LEGEND);

			this.IsEnableChannel.Children.Clear();

            for (int i= 0; i < lineCount; i++)
            {
                CheckBox checkBox = new CheckBox();
                checkBox.Name ="Channel_" +  i.ToString();
                checkBox.Content = "Channel_" + (i+1).ToString();
                checkBox.IsChecked = true;
                checkBox.Checked += CheckBox_Checked;
                checkBox.Unchecked += CheckBox_Unchecked;

                this.IsEnableChannel.Children.Add(checkBox);
            }

}
 private void CheckBox_Unchecked(object sender, RoutedEventArgs e)
        {
            CheckBox checkBox = (CheckBox)sender;

            int posID = Convert.ToInt32(((CheckBox)sender).Name.Substring(8, 1));

            ChartPlot.Series[posID].Enabled = false;

        }

        private void CheckBox_Checked(object sender, RoutedEventArgs e)
        {
            CheckBox checkBox = (CheckBox)sender;

            int posID = Convert.ToInt32(((CheckBox)sender).Name.Substring(8,1));

            ChartPlot.Series[posID].Enabled = true;

        }
ChartPlot.Series[posID].Enabled = false;//隐藏线条
ChartPlot.Series[posID].Enabled = true;//显示线条
ChartPlot.Series[posID].IsVisibleInLegend = false//隐藏线条图例
ChartPlot.Series[posID].IsVisibleInLegend = true//显示线条图例


 1230
1230

 被折叠的 条评论
为什么被折叠?
被折叠的 条评论
为什么被折叠?
 到【灌水乐园】发言


