


option = {
title: {
text: “一天分布”,
subtext: “纯属虚构”,
},
tooltip: {
trigger: “axis”,
},
toolbox: {
show: true,
feature: {
saveAsImage: {},
},
},
xAxis: {
type: “category”,
boundaryGap: true,
splitLine: {
show: true,
},
data: [
“00:00”,
“01:15”,
“02:30”,
“03:45”,
“05:00”,
“06:15”,
“07:30”,
],
},
yAxis: {
type: “value”,
splitLine: {
show: false,
},
axisLabel: {
formatter: “{value} W”,
},
},
series: [
{
name: “计划”,
type: “line”,
smooth: true,
showSymbol: false,
symbol: false,
lineStyle: {
normal: {
color: new echarts.graphic.LinearGradient(
0,
0,
1,
0,
[
{
offset: 0.7,
color: “#993CED”, // 0% 处的颜色
},
{
offset: 1,
color: “#993CED”, // 100% 处的颜色
},
],
false
),
width: 50,
},
},
markPoint: {
data: [
{
name: “最大值”,
type: “max”,
valueIndex: 0,
},
],
},
data: [300, 300, 300, 300, 300, 300],
markLine: {
data: [
[
{
// 一条线的终点
coord: [“00:00”, 300],
symbol: “none”,
},
{
name: “”,
// 起始点,根据x轴坐标自定义,可画斜线
label: {
position: “start”,
},
coord: [“00:00”, 0],
symbol: “none”,
},
],
[
{ coord: [“01:15”, 200], symbol: “none” },
{
name: “”,
label: {
position: “start”,
},
coord: [“01:15”, 0],
symbol: “none”,
},
],
[
{ coord: [“02:30”, 100], symbol: “none” },
{
name: “”,
label: {
position: “start”,
},
coord: [“02:30”, 0],
symbol: “none”,
},
],
],
},
},
{
name: “用电量”,
type: “line”,
smooth: true,
showSymbol: false,
symbol: false,
lineStyle: {
normal: {
color: new echarts.graphic.LinearGradient(
0,
0,
1,
0,
[
{
offset: 0.7,
color: “#993CED”, // 0% 处的颜色
},
{
offset: 1,
color: “#993CED”, // 100% 处的颜色
},
],
false
),
width: 50,
},
},
markPoint: {
data: [
{
name: “最大值”,
type: “max”,
valueIndex: 0,
},
],
},
data: [“-”, 200, 200, 200, 200, 200],
},
{
name: “用电量”,
type: “line”,
smooth: true,
showSymbol: false,
symbol: false,
lineStyle: {
normal: {
color: new echarts.graphic.LinearGradient(
0,
0,
1,
0,
[
{
offset: 0.7,
color: “#993CED”, // 0% 处的颜色
},
{
offset: 1,
color: “#993CED”, // 100% 处的颜色
},
],
false
),
width: 50,
},
},
markPoint: {
data: [
{
name: “最大值”,
type: “max”,
valueIndex: 0,
},
],
},
data: [“-”, “-”, 100, 100],
},
],
};
echarts 柱状图 甘特图
于 2022-10-21 14:57:42 首次发布
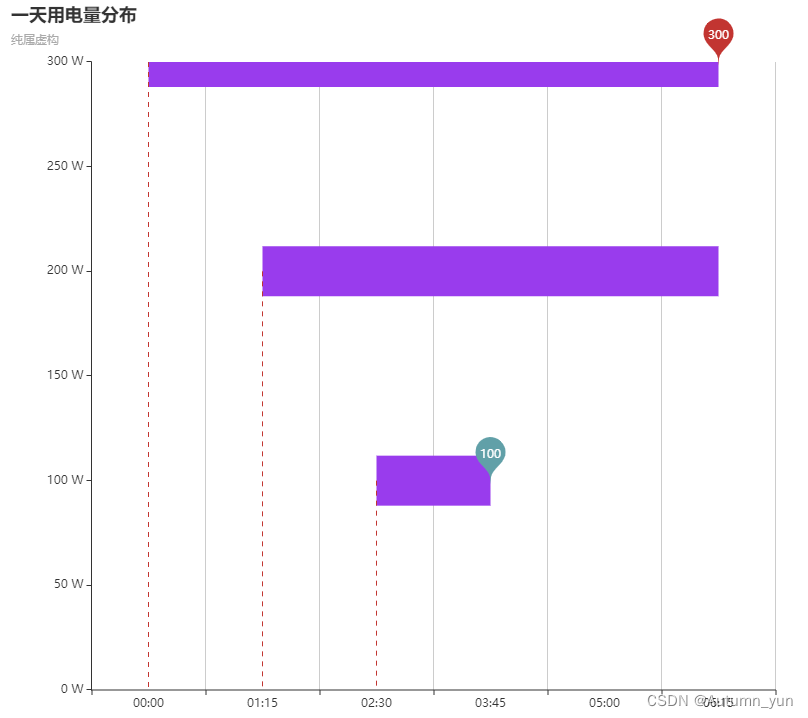
 本文展示了如何使用Echarts库创建柱状图和甘特图,通过详细的配置选项,包括数据、样式和标记,来展示一天中不同时间段的计划和实际用电量。示例中包含了多条线性渐变颜色的线条,用于突出最大值,并使用了markPoint和markLine来增强数据可视化的表现力。


 2132
2132

 被折叠的 条评论
为什么被折叠?
被折叠的 条评论
为什么被折叠?
 到【灌水乐园】发言


