


 本文探讨了树基模型如决策树和随机森林在医学数据分析中的应用,以及如何处理缺失数据的问题。文中详细解释了随机森林的工作原理,指出在面对缺失数据时,模型可能表现不佳的原因,并介绍了几种缺失数据类别及其对模型的影响。最后,提出了数据填补方法,包括使用训练数据的平均值填充和回归预测。
一. Tree-based model
a) Decision tree
-
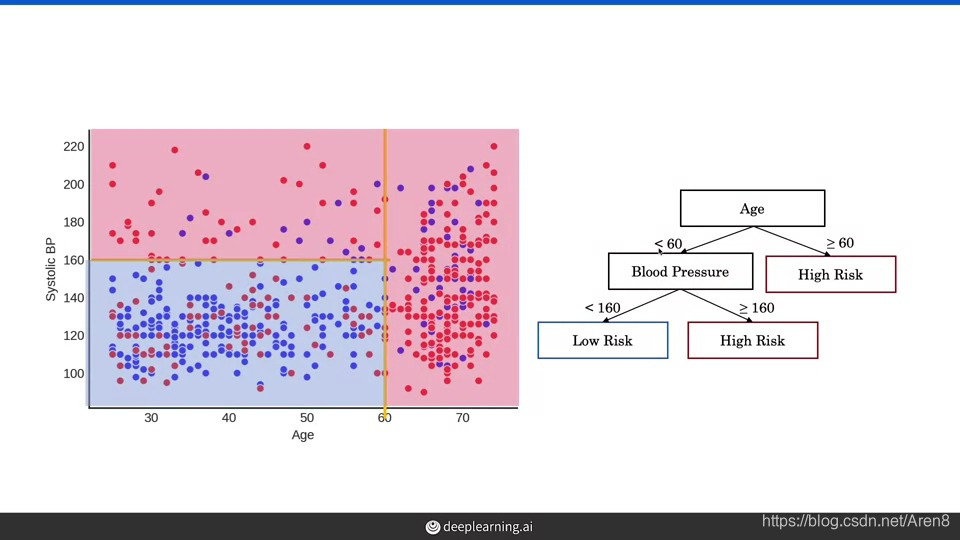
Decision tree boundaries are always vertical or horizontal.
-
Decision trees can model nonlinear associations. Notice how they’re
able to capture here that the risk is low when both age and BP are
low. -
The step of building a decision tree is to pick a variable and a
value of that variable that partitions the data, such that one
partition contains mostly red and the other partition contains
mostly blue.
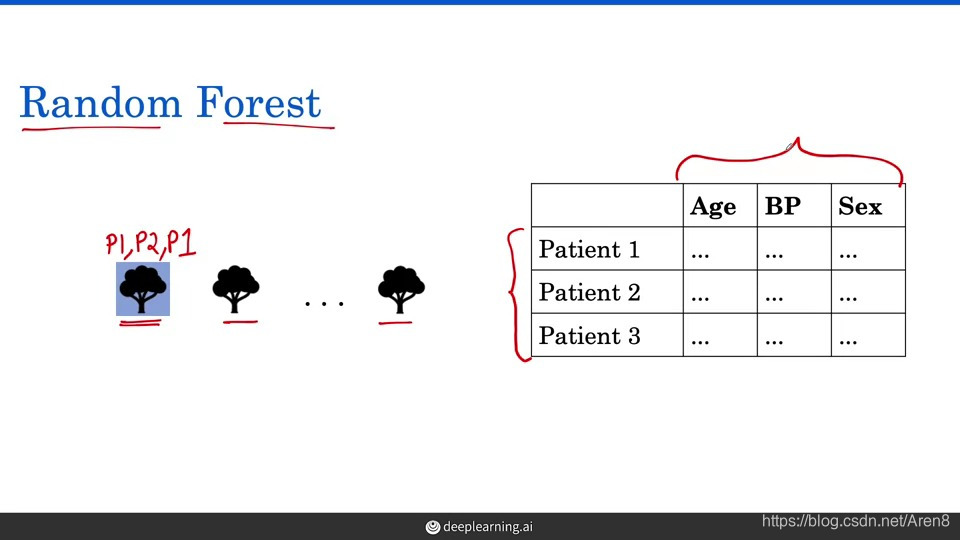
b) Random forest -
First, each tree in the forest is constructed using a random sample
of the patients. For instance, for the first tree, we might draw P1,
P2, P1, which can happen because the random forest samples with
replacement. -
Second, the random forest algorithm also uses a subset of features
when creating decision boundaries. -
With these two key concepts, a random forest algorithm learns to
build multiple decision trees on given data. And the random forest
takes the simple average of those risk as the risk prediction. -
Random forests are called an ensemble learning method. There are
other popular algorithms that use ensembles including Gradient
Boosting, XGBoost, and LightGBM which are also able to achieve high
performance when working with structured data in medicine and in
other domains.
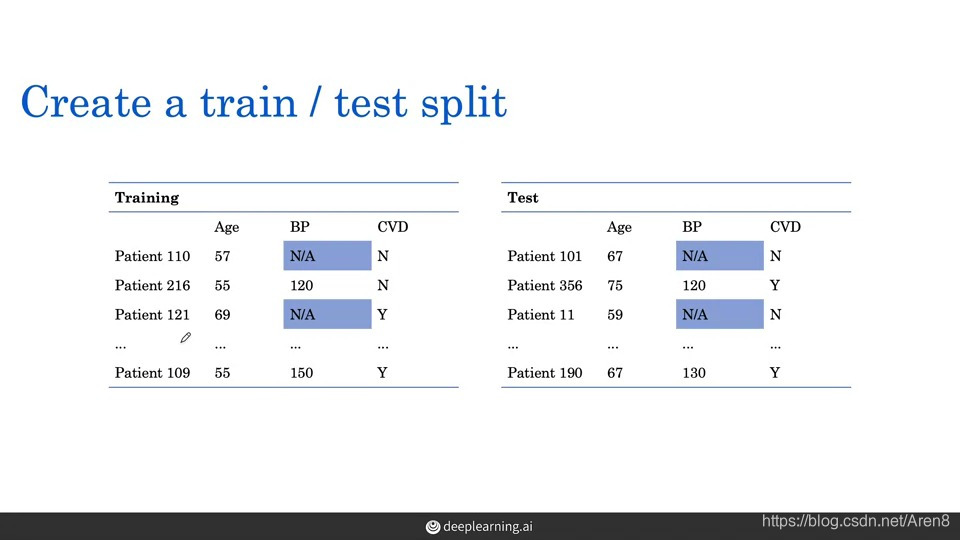
二. identify missing data -
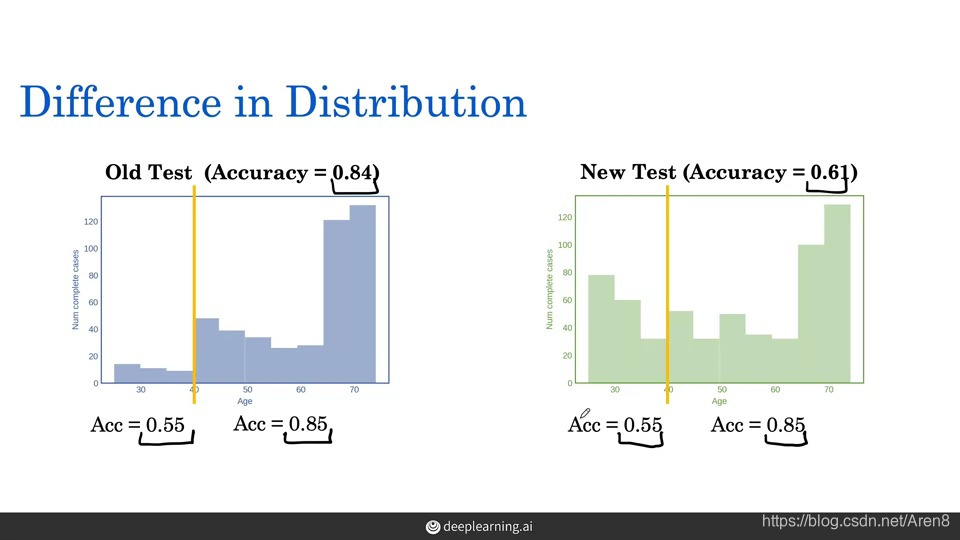
Problem: New test set with the same study design comes with no
missing data. Our random forest model performs poor on this new test
data set. -
The reason why missing data is common in medical field: One reason
this might happen is in the clinic, physicians may not regularly
record blood pressure for young patients but might be a routine part
of care for older patients. And there are a lot of patterns like this
which can generate a systematic missingness to the data. -
The reason why random forest model performs poor: the distribution of
previous data set and the new data set are different. As the figure
shows, we got to eliminating a lot of young patients (the missing group) after dropping. So, we’re performing poorly on patients that are younger (the missing group) but we don’t know it when we using the data after dropping.
三. Missing data category: -
Missing completely at random: flip the coin to decide whether to
record the BP, this will not lead to bias model. -
Missing at random: when the patient is younger than 60, flip the coin
to decide whether to record the BP(So missing at random is when
missingness depends only on the available information). -
Missing not at random: when there are patients waiting, flip the coin
to decide whether to record the BP (It would be something that would be unobservable in the data——whether there are patient waiting)##we cannot be sure what the cause of the missing data##
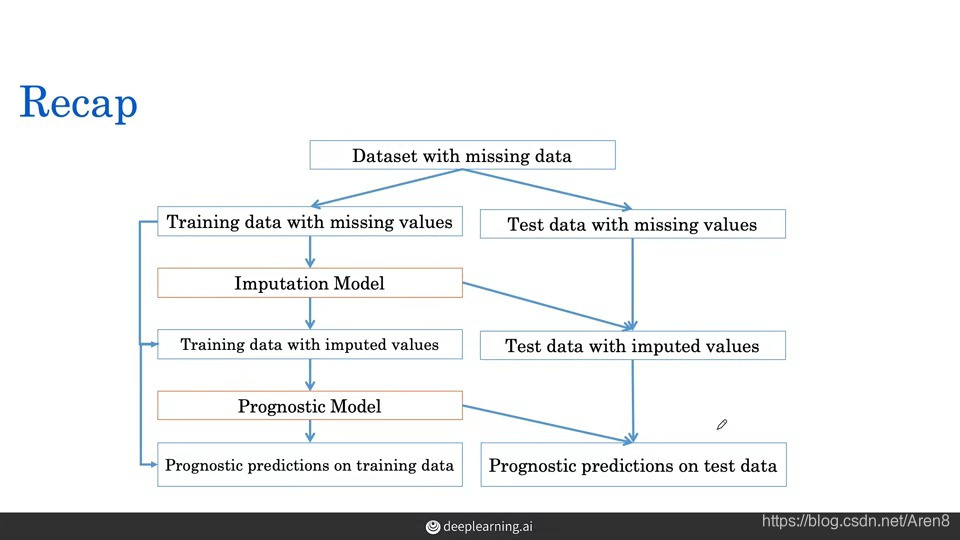
四. Imputation——fill in the missing data by estimation
- Use the mean value of the training data to fill in the blank of the training data and testing data
- Use regression: fit a linear model to the training set and apply it to the test set


 被折叠的 条评论
为什么被折叠?
被折叠的 条评论
为什么被折叠?
 到【灌水乐园】发言


