


 本文介绍了Flame Graph,一种用于性能调优的直观工具,它通过可视化的火焰图帮助开发者快速定位资源消耗。内容包括Flame Graph的概念、工作原理,以及如何利用Linux的perf命令进行CPU profile数据采集。文章还提到了整合到系统代码中的ProfileServlet,以方便快速获取profile结果。
前言
当我们很多时候在分析定位一个比较隐秘的问题时,我们马上能脱口而出好几种方法,查日志找异常,再细致一点的,jmap,jstack分析stack trace。但是一般如果到了分析stack trance的阶段时,说明这个很可能已经是performance的问题了。但其实很多时候,jstack这种默认的命令工具对于开发者来说还不够直观与好理解。它所展现的只是一堆的当前stack trance的展现,没有汇聚的阶段性的调用占比。jstack的结果还需要人工进行二次分析。因此,本文笔者来聊聊在这方面比较适用的一个工具:Flame Graph(火焰图)。
什么是Flame Graph
首先我们来了解火焰图的概念,以下是比较官方的解释:
This visualization of software execution is a new necessity for performance profiling and debugging.
以上译为:一种软件执行情况的形象化的反映,用于做性能profile和debug。
以下是flame graph的一张呈现效果图
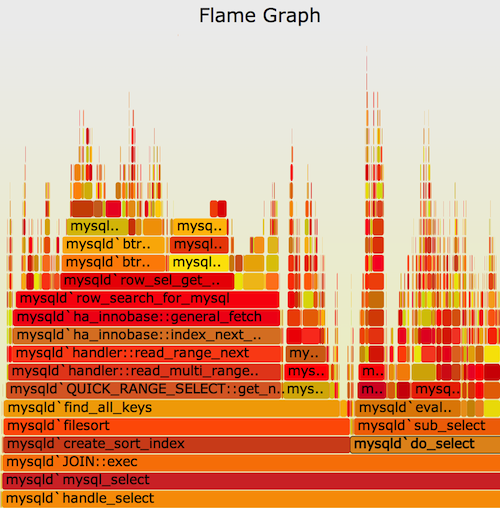
后面笔者再介绍上图的含义。
Flame Graph的工作原理
在Flame Graph在呈现出整个最终结果之前,其中主要的工作并不是图形的展现,而是前面profile数据的采集。
这里数据的采集首先按照profile的类型分为以下几类:
- CPU的profile分析,那需要进行的stack trace的采集,可以借助于Linux的perf命令
- Memory的profile,那我们需要sample一些malloc类似的系统调用。
- Off-CPU的profile,那些没有消耗CPU的线程的profile,可以理解为被block住的线程。
…
以上不同类型的profile需要依赖不同的采集工具,比较常见的还是CPU profile,对于CPU的profile,它要做的其实就是进程stack trace的收集。这个收集可以按照采集总时间,采集频率来进行。
假设我们用Linux的perf命令,对某进程id为1234的进程,进行持续60s,采集频率为每秒99次的CPU使用情况要求,命令如下:
sudo perf record -F 99 -p 1234 -g --sleep 60
上述生成的stack trace全部展现出来会相当的庞大,补过perf命令可以帮助对此进行折叠,汇总统计,然后将结果文件交由Flame Graph进行最后展示。展现效果如上小节图中所示。
上述图中,y轴高度表示的stack trace的调用深度,从上往下为从child–>parent的关系,x轴宽度表示调用的频率,所以我们在观察flame Graph的时候,要观察最顶部的那些宽度比较宽的stack信息。
Flame Graph通过图形的方式能够帮助开发者迅速定位出明显消耗资源的调用,唯一可能不足的地方在于上面每个小格子的显示空间有限,没有办法显示全操作方法名,需要再次点进去进行更一步的查看。
附:Profile的页面快速执行构建工具
最近发现有些系统代码把profile行为整合到了系统代码中,做了一个ProfileServlet,然后用户可通过页面url访问能快速得到指定进程的profile结果,相当方便,代码如下(最原始来自于Hive社区),作为和本文主题的相关内容,贴出代码,后续对大家可能有所帮助
:
/*
 * Licensed to the Apache Software Foundation (ASF) under one
 * or more contributor license agreements.  See the NOTICE file
 * distributed with this work for additional information
 * regarding copyright ownership.  The ASF licenses this file
 * to you under the Apache License, Version 2.0 (the
 * "License"); you may not use this file except in compliance
 * with the License.  You may obtain a copy of the License at
 * http://www.apache.org/licenses/LICENSE-2.0
 * Unless required by applicable law or agreed to in writing, software
 * distributed under the License is distributed on an "AS IS" BASIS,
 * WITHOUT WARRANTIES OR CONDITIONS OF ANY KIND, either express or implied.
 * See the License for the specific language governing permissions and
 * limitations under the License.
 */
package org.apache.hadoop.hdds.server;

import javax.servlet.http.HttpServlet;
import javax.servlet.http.HttpServletRequest;
import javax.servlet.http.HttpServletResponse;
import java.io.File;
import java.io.FileInputStream;
import java.io.IOException;
import java.io.InputStream;
import java.lang.management.ManagementFactory;
import java.nio.file.Files;
import java.nio.file.Path;
import java.nio.file.Paths;
import java.util.ArrayList;
import java.util.List;
import java.util.concurrent.TimeUnit;
import java.util.concurrent.atomic.AtomicInteger;
import java.util.concurrent.locks.Lock;
import java.util.concurrent.locks.ReentrantLock;

import com.google.common.base.Joiner;
import org.apache.commons.io.IOUtils;
import org.slf4j.Logger;
import org.slf4j.LoggerFactory;

/**
 * Servlet that runs async-profiler as web-endpoint.
 * <p>
 * Source: https://github.com/apache/hive/blob/master/common/src/java/org
 * /apache/hive/http/ProfileServlet.java
 * <p>
 * Following options from async-profiler can be specified as query paramater.
 * //  -e event          profiling event: cpu|alloc|lock|cache-misses etc.
 * //  -d duration       run profiling for <duration> seconds (integer)
 * //  -i interval       sampling interval in nanoseconds (long)
 * //  -j jstackdepth    maximum Java stack depth (integer)
 * //  -b bufsize        frame buffer size (long)
 * //  -t                profile different threads separately
 * //  -s                simple class names instead of FQN
 * //  -o fmt[,fmt...]   output format:
 * summary|traces|flat|collapsed|svg|tree|jfr
 * //  --width px        SVG width pixels (integer)
 * //  --height px       SVG frame height pixels (integer)
 * //  --minwidth px     skip frames smaller than px (double)
 * //  --reverse         generate stack-reversed FlameGraph / Call tree
 * Example:
 * - To collect 30 second CPU profile of current process (returns FlameGraph
 * svg)
 * curl "http://localhost:10002/prof"
 * - To collect 1 minute CPU profile of current process and output in tree
 * format (html)
 * curl "http://localhost:10002/prof?output=tree&duration=60"
 * - To collect 30 second heap allocation profile of current process (returns
 * FlameGraph svg)
 * curl "http://localhost:10002/prof?event=alloc"
 * - To collect lock contention profile of current process (returns
 * FlameGraph svg)
 * curl "http://localhost:10002/prof?event=lock"
 * Following event types are supported (default is 'cpu') (NOTE: not all
 * OS'es support all events)
 * // Perf events:
 * //    cpu
 * //    page-faults
 * //    context-switches
 * //    cycles
 * //    instructions
 * //    cache-references
 * //    cache-misses
 * //    branches
 * //    branch-misses
 * //    bus-cycles
 * //    L1-dcache-load-misses
 * //    LLC-load-misses
 * //    dTLB-load-misses
 * //    mem:breakpoint
 * //    trace:tracepoint
 * // Java events:
 * //    alloc
 * //    lock
 */
public class ProfileServlet extends HttpServlet {


  private static final long serialVersionUID = 1L;
  private static final Logger LOG =
      LoggerFactory.getLogger(ProfileServlet.class);
  private static final String ACCESS_CONTROL_ALLOW_METHODS =
      "Access-Control-Allow-Methods";
  private static final String ALLOWED_METHODS = "GET";
  private static final String ACCESS_CONTROL_ALLOW_ORIGIN =
      "Access-Control-Allow-Origin";
  private static final String CONTENT_TYPE_TEXT = "text/plain; charset=utf-8";
  private static final String ASYNC_PROFILER_HOME_ENV = "ASYNC_PROFILER_HOME";
  private static final String ASYNC_PROFILER_HOME_SYSTEM_PROPERTY =
      "async.profiler.home";
  private static final String PROFILER_SCRIPT = "/profiler.sh";
  private static final int DEFAULT_DURATION_SECONDS = 10;
  private static final AtomicInteger ID_GEN = new AtomicInteger(0);
  static final Path OUTPUT_DIR =
      Paths.get(System.getProperty("java.io.tmpdir"), "prof-output");

  private Lock profilerLock = new ReentrantLock();
  private Integer pid;
  private String asyncProfilerHome;
  private transient Process process;

  public ProfileServlet() {


    this.asyncProfilerHome = getAsyncProfilerHome();
    this.pid = getPid();
    LOG.info("Servlet process PID: {} asyncProfilerHome: {}", pid,
        asyncProfilerHome);
    try {


      Files.createDirectories(OUTPUT_DIR);
    } catch (IOException e) {


      LOG.
最低0.47元/天 解锁文章


 3490
3490

 被折叠的 条评论
为什么被折叠?
被折叠的 条评论
为什么被折叠?
 到【灌水乐园】发言


