


前言:
今天给大家分享一个基于PythonWeb的django框架结合爬虫以及数据可视化和数据库的项目,该项目总体来说还是挺不错的,项目的流程和大多数数据可视化的项目流程相似,采用爬虫技术爬取目标网站数据然后将其存储在MySQL数据库中,然后利用Python后端语言进行数据分析处理成需要的数据结构类型结合E-charts可视化平台进行图表呈现。
1:项目涉及技术:
项目后端语言:Python,Django框架
项目页面布局展现:前端bootstrap框架
项目数据可视化呈现:Echarts,matplotlib
项目数据存储:MySQL数据库
项目数据获取方式:爬虫Xpath
2:数据库设计
数据库有3个,一个数用户User用来存储用户的数据信息,一个是House用来存储爬取的二手房房源数据信息,一个是Collect用来存储各个用户收藏的房源数据。
爬取爬取了链家网二手房的如下字段:
'标题', '关注', '小区', '位置', '城市', '房屋类型', '面积', '单价', '总价', '介绍', '详情网址', '图片'
接下来直接附上爬虫代码如下,这个代码可以正常爬取,只需要输入要爬取的城市和页码即可:
import requests
import threading
import pandas as pd
from lxml import etree
import csv
from datetime import datetime
import pymysql
cnx = pymysql.connect(
    host="localhost",
    user="root",
    password="123456",
    database="bjhz_ershoufang"
)
cursor = cnx.cursor()
# 全部信息列表
count = []

city = '杭州'

# CSV文件名(带时间戳)
filename = f'{city}.csv'


# 生成1-10页url
def url_creat():
    url = 'https://hz.lianjia.com/ershoufang/pg{}/'
    return [url.format(i) for i in range(1, 21)]


# CSV存储函数
def save_to_csv(data):
    # 定义CSV表头
    headers = ['标题', '关注', '小区', '位置', '城市', '房屋类型', '面积', '单价', '总价', '介绍', '详情网址', '图片']

    # 首次写入时创建文件并写入表头
    with open(filename, 'a', newline='', encoding='utf-8-sig') as f:
        writer = csv.DictWriter(f, fieldnames=headers)
        if f.tell() == 0:
            writer.writeheader()
        writer.writerow(data)


# 页面解析
def url_parse(url):
    headers = {
        'User-Agent': 'Mozilla/5.0 (Windows NT 10.0; Win64; x64) AppleWebKit/537.36 (KHTML, like Gecko) Chrome/91.0.4472.164 Safari/537.36'}
    try:
        response = requests.get(url=url, headers=headers, timeout=10)
        response.encoding = 'utf-8'
        tree = etree.HTML(response.text)

        li_List = tree.xpath("//*[@class='sellListContent']/li")
        lock = threading.RLock()

        with lock:
            for li in li_List:
                # 数据提取部分保持不变
                title = li.xpath('./div/div/a/text()')[0]
                link = li.xpath('./div/div/a/@href')[0]
                attention = li.xpath('./div/div/text()')[0].split('人')[0]
                # 位置
                postion = li.xpath('./div/div[2]/div/a/text()')[0] + li.xpath('./div/div[2]/div/a[2]/text()')[0]
                # 类型
                types = li.xpath('./div/div[3]/div/text()')[0].split(' | ')[0]
                # 面积
                area = li.xpath('./div/div[3]/div/text()')[0].split(' | ')[1]
                # 房屋信息
                info = li.xpath('./div/div[3]/div/text()')[0].split(' | ')[2:-1]
                info = ''.join(info)
                # 总价
                count_price = li.xpath('.//div/div[6]/div/span/text()')[0] + '万'
                # 单价
                angle_price = li.xpath('.//div/div[6]/div[2]/span/text()')[0]
                # 图片链接
                pic_link = li.xpath('./a/img/@data-original')[0]

                dic = {
                    '标题': title,
                    '关注': attention,
                    '小区': postion.split(' ')[0],
                    '位置': postion.split(' ')[1],
                    '城市': city,
                    '房屋类型': types,
                    '面积': area,
                    "单价": angle_price,
                    '总价': count_price,
                    '介绍': info,
                    "详情网址": link,
                    '图片': pic_link
                }
                print(dic)

                # 实时保存到CSV
                save_to_csv(dic)
                count.append(dic)

    except Exception as e:
        print(f"Error processing {url}: {str(e)}")


def run():
    links = url_creat()
    threads = []

    # 创建并启动线程
    for url in links:
        t = threading.Thread(target=url_parse, args=(url,))
        threads.append(t)
        t.start()

    # 等待所有线程完成
    for t in threads:
        t.join()

    # 可选:将所有数据再次保存为完整CSV(防止漏存)
    pd.DataFrame(count).to_csv(filename, index=False, encoding='utf-8-sig')
    print(f"数据已保存至 {filename},共爬取 {len(count)} 条记录")


def csv_to_mysql_simple(csv_file):
    """极简版CSV数据入库"""
    with open(csv_file, 'r', encoding='utf-8-sig') as f:
        reader = csv.DictReader(f)
        # 批量插入SQL模板
        sql = """INSERT INTO House(title, attention, community, location, city, house_type, area, unit_price, total_price, description, detail_url, image_url)
                VALUES (%s, %s, %s, %s, %s, %s, %s, %s, %s, %s, %s, %s)"""

        # 遍历每一行数据
        for row in reader:
            try:
                cursor.execute(sql, (
                    row['标题'],
                    int(row['关注']),  # 转换为整数
                    row['小区'],
                    row['位置'],
                    row['城市'],
                    row['房屋类型'],
                    row['面积'],
                    row['单价'],
                    row['总价'],
                    row['介绍'],
                    row['详情网址'],
                    row['图片']
                ))
                cnx.commit()  # 提交事务
            except Exception as e:
                print(f"插入失败: {row['标题']},错误原因: {str(e)}")
                cnx.rollback()  # 回滚当前事务

    print("数据导入完成!")

if __name__ == '__main__':
    # run()
    csv_to_mysql_simple('杭州.csv')
代码比较简单易理解,就是采用了Xpath路径解析的技术爬取各个字段然后可以存储在Csv文件里面,然后调用函数将其Csv的数据存入数据库中,用的时候只需要将相关数据替换成自己的就可以啦!
同时这是在Django的models.py声明的各个数据表的详细字段:
from django.db import models

# Create your models here.
# models.py
from django.db import models
from django.utils.safestring import mark_safe


class User(models.Model):
    id = models.AutoField('id',primary_key=True)
    username = models.CharField(verbose_name="姓名", max_length=22, default='')
    password = models.CharField(verbose_name="密码", max_length=32, default='')
    phone = models.CharField(verbose_name="手机号", max_length=11, default='')
    email = models.CharField(verbose_name="邮箱", max_length=22, default='')
    time = models.DateField(verbose_name="创建时间", auto_now_add=True)
    avatar = models.FileField(verbose_name="头像", default='user/avatar/default.gif', upload_to="user/avatar/")
    def admin_sample(self):
        return mark_safe('<img src="/media/%s" height="60" width="60" />' % (self.avatar,))
    admin_sample.short_description = '用户头像'
    admin_sample.allow_tags = True
    def __str__(self):
        return self.username
    class Meta:
        db_table = 'User'
        verbose_name_plural = '用户管理'

class House(models.Model):
    title = models.CharField("标题", max_length=200)
    attention = models.PositiveIntegerField("关注人数", default=0)
    community = models.CharField("小区", max_length=50)
    location = models.CharField("位置", max_length=30)
    city = models.CharField("城市", max_length=10)
    house_type = models.CharField("房屋类型", max_length=20)
    area = models.CharField("面积", max_length=20)
    unit_price = models.CharField("单价", max_length=20)
    total_price = models.CharField("总价", max_length=20)
    description = models.TextField("介绍", max_length=500)
    detail_url = models.URLField("详情网址", max_length=500)
    image_url = models.URLField("图片链接", max_length=500)

    class Meta:
        db_table = "house"  # 自定义数据库表名
        verbose_name = "房源数据"

    def __str__(self):
        return self.title

class Histroy(models.Model):
    id = models.AutoField(primary_key=True, verbose_name='ID')
    house = models.ForeignKey(House,on_delete=models.CASCADE)
    user = models.ForeignKey(User,on_delete=models.CASCADE)
    count = models.IntegerField("点击次数",default=1)
    class Meta:
        db_table = "histroy"
    class Meta:
        db_table = 'History'
        verbose_name_plural = '房源收藏'
这就是项目的准备动作啦。
3:项目功能:
1、用户登录注册,2、个人信息编辑以及个人密码修改,3、数据分页总览以及实现了用户可以对心仪二手房房源进行收藏和删除,4、首页大屏展示了用户的注册数据以及数据库中所有房源数据的基本属性数据,5、针对爬取的房源数据的各个字段做可视化图表分析处理!
3.1:登陆注册:
基本上所有Web的登陆注册流程都一样,都是将输入框写下前端的form表单中,然后再后端post方法提交获取输入的数据然后将其存储数据库中:
# 02用户注册
def register(request):
    if request.method == 'POST':
        name = request.POST.get('name')
        password = request.POST.get('password')
        phone = request.POST.get('phone')
        email = request.POST.get('email')
        avatar = request.FILES.get('avatar')
        stu = User.objects.filter(username=name)
        if stu:
            msg = '用户已存在!'
            return render(request, 'register.html', {"msg": msg})
        else:
            User.objects.create(username=name,password=password,phone=phone,email=email,avatar=avatar)
            msg = "注册成功!"
            return render(request, 'login.html', {"msg": msg})
    if request.method == 'GET':
        return render(request,'register.html')

登录也差不多,就是获取你账号密码的输入的内容,和数据库的数据校验,看是否存在和当前输入的账号密码都相同的数据,如果满足则可以进入后续页面,负责做别的提示处理即可:
def login(request):
    if request.method == 'GET':
        return render(request, 'login.html')
    if request.method == 'POST':
        name = request.POST.get('name')
        password = request.POST.get('password')
        if User.objects.filter(username=name, password=password):
            user=User.objects.get(username=name, password=password)
            request.session['username'] = {'username':user.username,'avatar':str(user.avatar)}
            return redirect('index')
        else:
            msg = '信息错误!'
            return render(request, 'login.html', {"msg": msg})

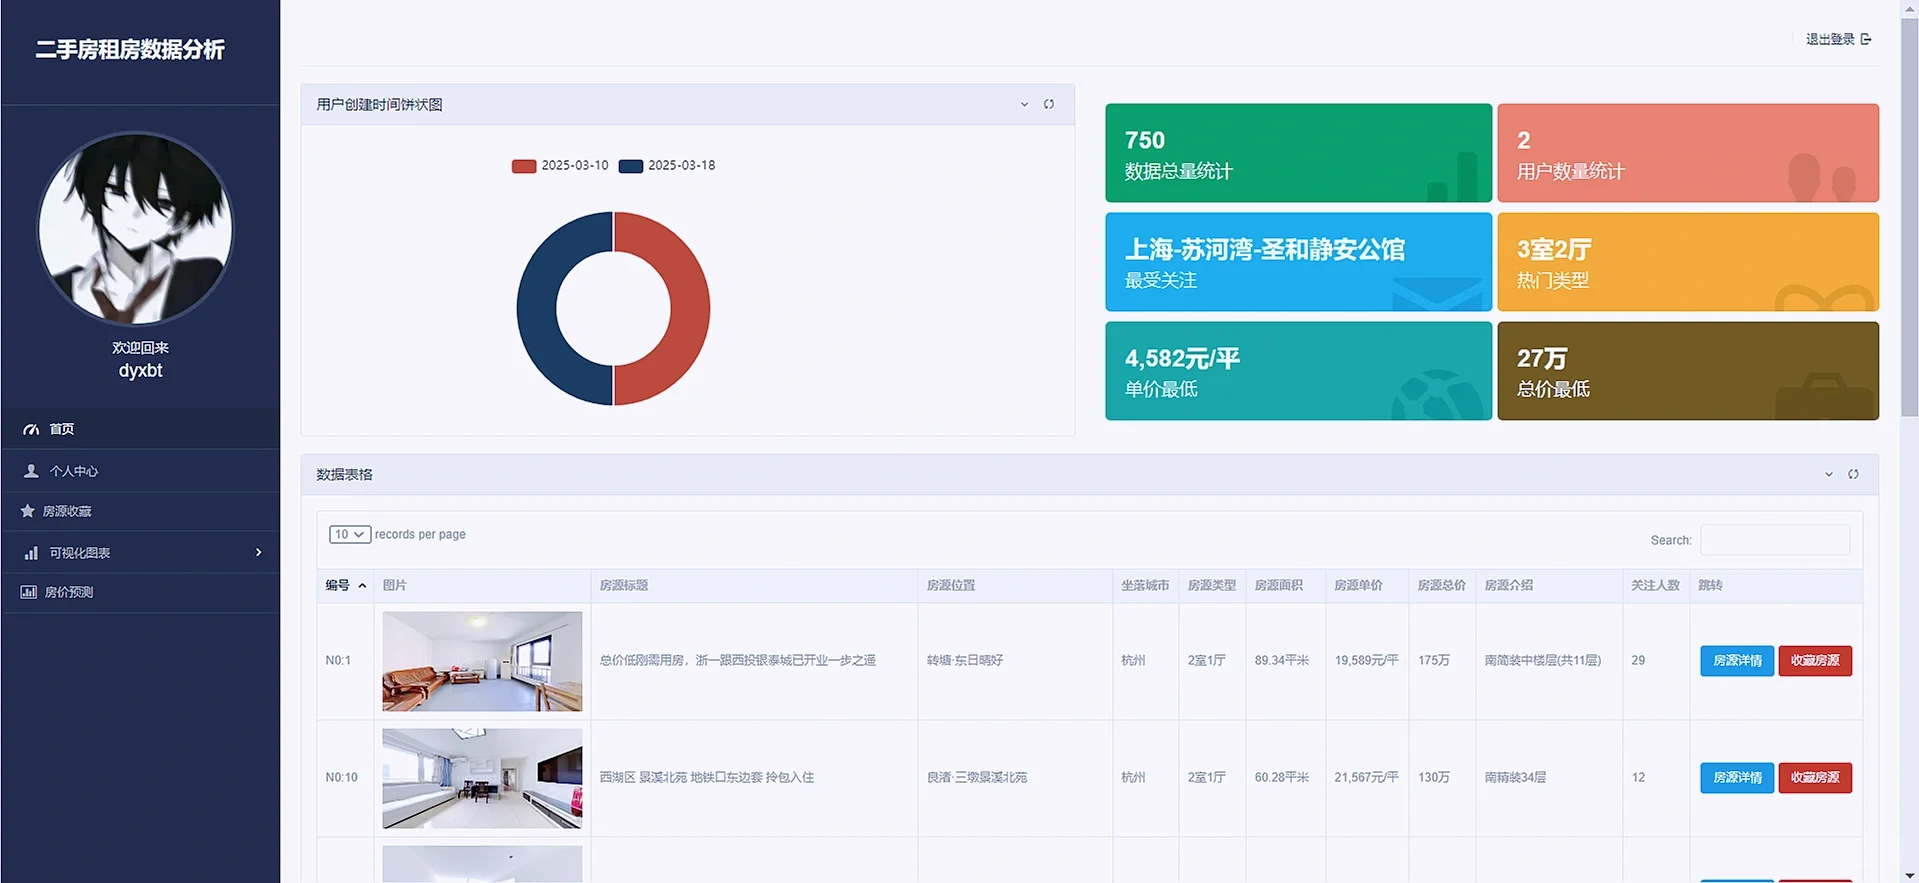
3.2 首页
首页是对数据库的字段集中做了一些处理,如统计了用户和房源数据的数量,以及关注人数和热门的房源和加钱的优势房源等,在下方做了一个数据的总览,并允许用户搜索房源。
def index(request):


    users = User.objects.all()
    data = {}
    for u in users:
        if data.get(str(u.time),-1) == -1:
            data[str(u.time)] = 1
        else:
            data[str(u.time)] += 1
    result = []
    for k,v in data.items():
        result.append({
            'name':k,
            'value':v
        })
    timeFormat = time.localtime();year = timeFormat.tm_year;month = timeFormat.tm_mon;day = timeFormat.tm_mday
    monthList = ["January","February","March","April","May","June","July","August","September","October","November","December"]
    username = request.session['username'].get('username');useravatar = request.session['username'].get('avatar')
    newuserlist = User.objects.all().order_by('-time')[0:5]

    houses=House.objects.all().distinct()
    # 数据总量
    houseslength=len(houses)
    # 用户总量
    userlength=len(User.objects.all())

    # 1. 关注人数最多的小区(城市-位置-小区)
    community_query = House.objects.values('city', 'location', 'community') \
        .annotate(total_attention=Sum('attention')) \
        .order_by('-total_attention')

    if community_query:
        most_attended = community_query.first()
        community_str = f"{most_attended['city']}-{most_attended['location']}-{most_attended['community']}"
    else:
        community_str = "暂无数据"

    # 2. 出现最多的房源类型
    house_type_query = House.objects.values('house_type') \
        .annotate(type_count=Count('house_type')) \
        .order_by('-type_count')

    most_common_type = house_type_query.first()['house_type'] if house_type_query else "暂无数据"

    # 3. 最低单价处理
    min_unit_price = None
    for house in House.objects.all():
        # 提取数字并转换(示例格式:"56,668元/平")
        price_str = house.unit_price.replace(',', '')
        match = re.search(r'(\d+\.?\d*)', price_str)
        if match:
            price = float(match.group(1))
            if (min_unit_price is None) or (price < min_unit_price[0]):
                min_unit_price = (price, house.unit_price)

    # 4. 最低总价处理
    min_total_price = None
    for house in House.objects.all():
        # 提取数字并转换(示例格式:"320万")
        match = re.search(r'(\d+\.?\d*)', house.total_price)
        if match:
            price = float(match.group(1))
            if (min_total_price is None) or (price < min_total_price[0]):
                min_total_price = (price, house.total_price)

    context={'username':username,'useravatar':useravatar,'houses':houses,'userTime':result,'newuserlist':newuserlist,
             'year':year,'month':monthList[month-1],'day':day,'houseslength':houseslength,'userlength':userlength,
             "most_attended_community": community_str,
        "most_common_house_type": most_common_type,
        "min_unit_price": min_unit_price[1] if min_unit_price else "暂无数据",
        "min_total_price": min_total_price[1] if min_total_price else "暂无数据",
           }
    return render(request,'index.html',context)
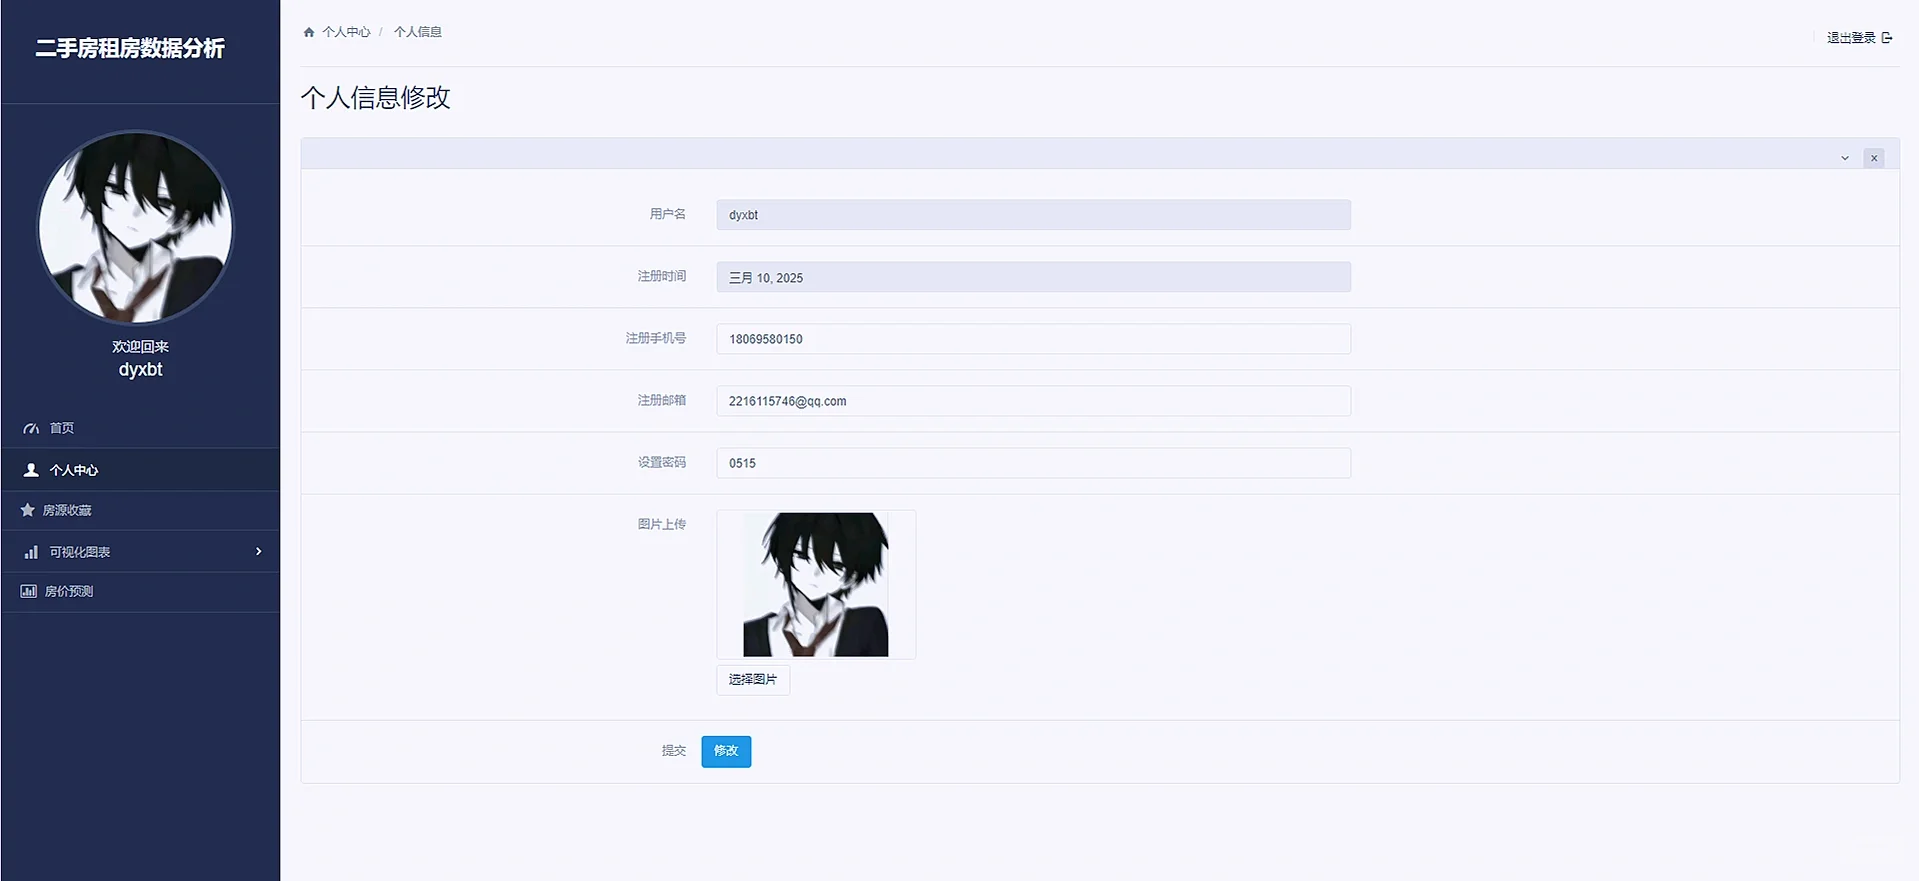
3.3 个人中心
个人中心展示了用户的基本数据信息,并同时允许用户修改个人的信息和密码
def selfInfo(request):
    username = request.session['username'].get('username')
    useravatar = request.session['username'].get('avatar')
    if request.method == 'POST':
        phone=request.POST.get("phone")
        email=request.POST.get("email")
        password=request.POST.get("password")

        selfmes=User.objects.get(username=username)
        selfmes.phone=phone
        selfmes.email=email
        selfmes.password=password
        # selfmes.avatar = request.FILES['avatar']
        selfmes.save()
        userInfo = User.objects.get(username=username)
        context = {'username': username, 'useravatar': useravatar, 'userInfo': userInfo}
        return render(request, 'selfInfo.html', context)

    userInfo=User.objects.get(username=username)
    context={'username':username,'useravatar':useravatar,'userInfo':userInfo}
    return render(request,'selfInfo.html',context)
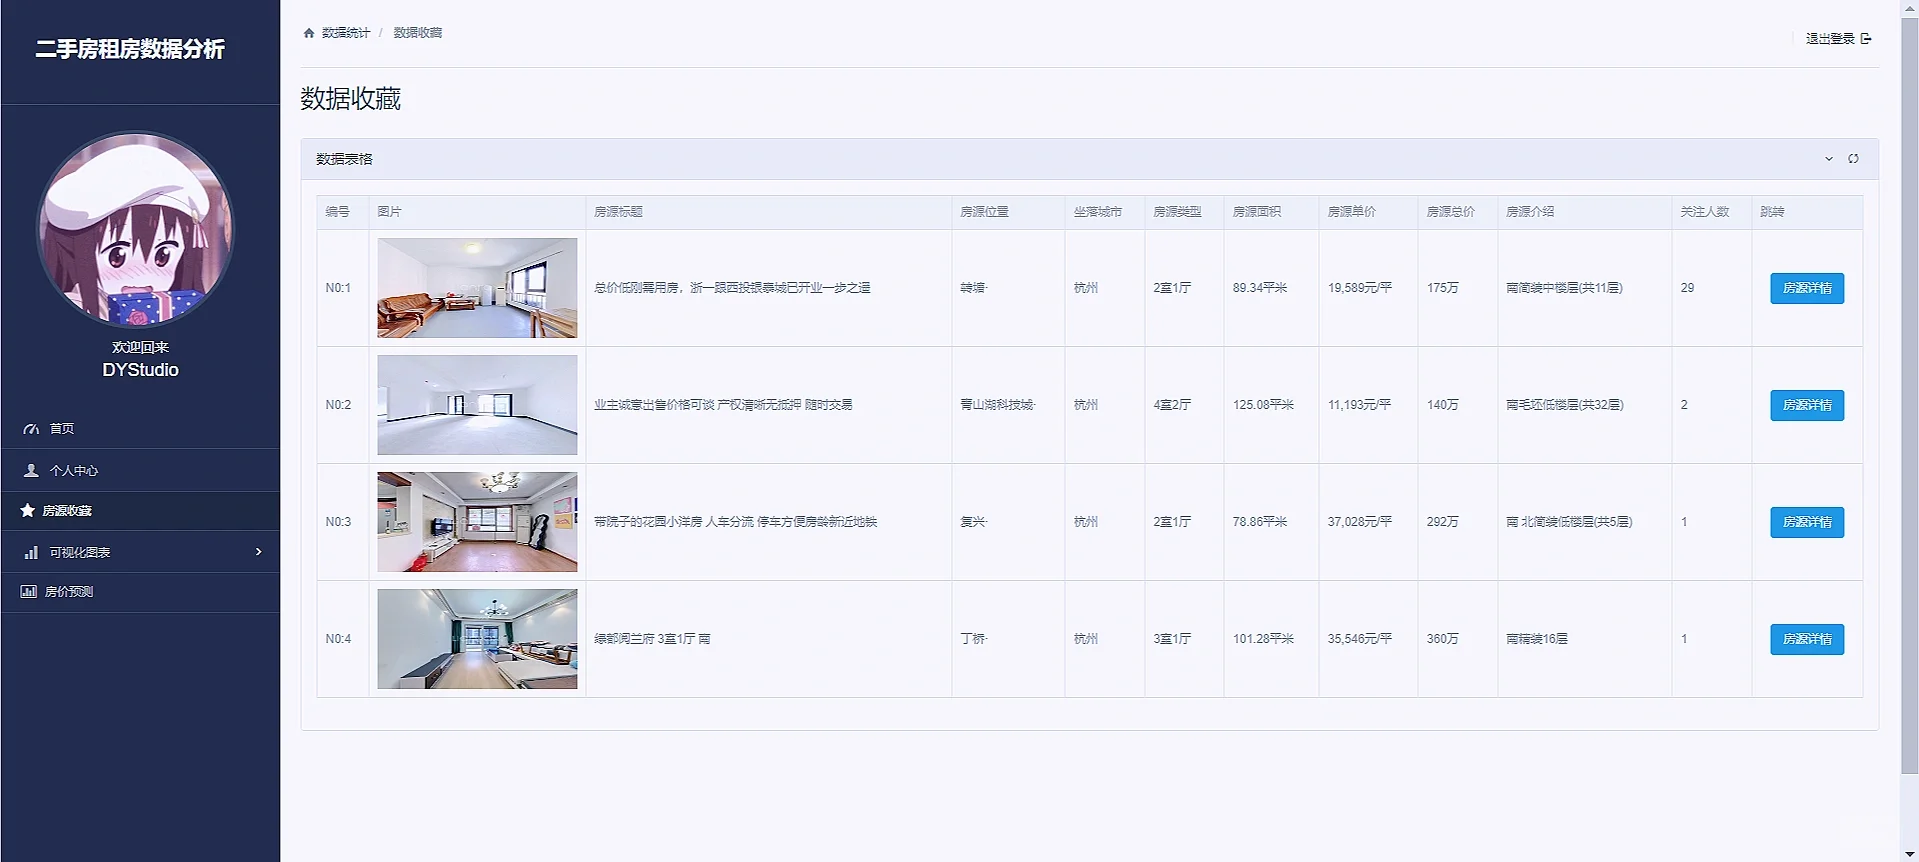
3.4 数据收藏
收藏的原理也很简单,就是通过获取点击的房源的id,因为每个房源的id都是唯一的,然后根据获取的房源的id,进而可以获取该id的其他字段的信息,然后将该id创建写入收藏标中,收藏表中的房源字段和House表是一对多ForeignKey的关系。
def historyTableData(request):
    username = request.session['username'].get('username')
    userInfo = User.objects.get(username=username)
    historyData = getHistoryTableData.getHistoryData(userInfo)
    return render(request, 'collectTableData.html', {
        'username':username,
        'userInfo': userInfo,
        'historyData':historyData
    })
# 收藏
def addHistory(request,houseID):
    username = request.session.get("username").get('username')
    userInfo = User.objects.get(username=username)
    getHistoryTableData.addHistory(userInfo,houseID)
    return redirect('historyTableData')
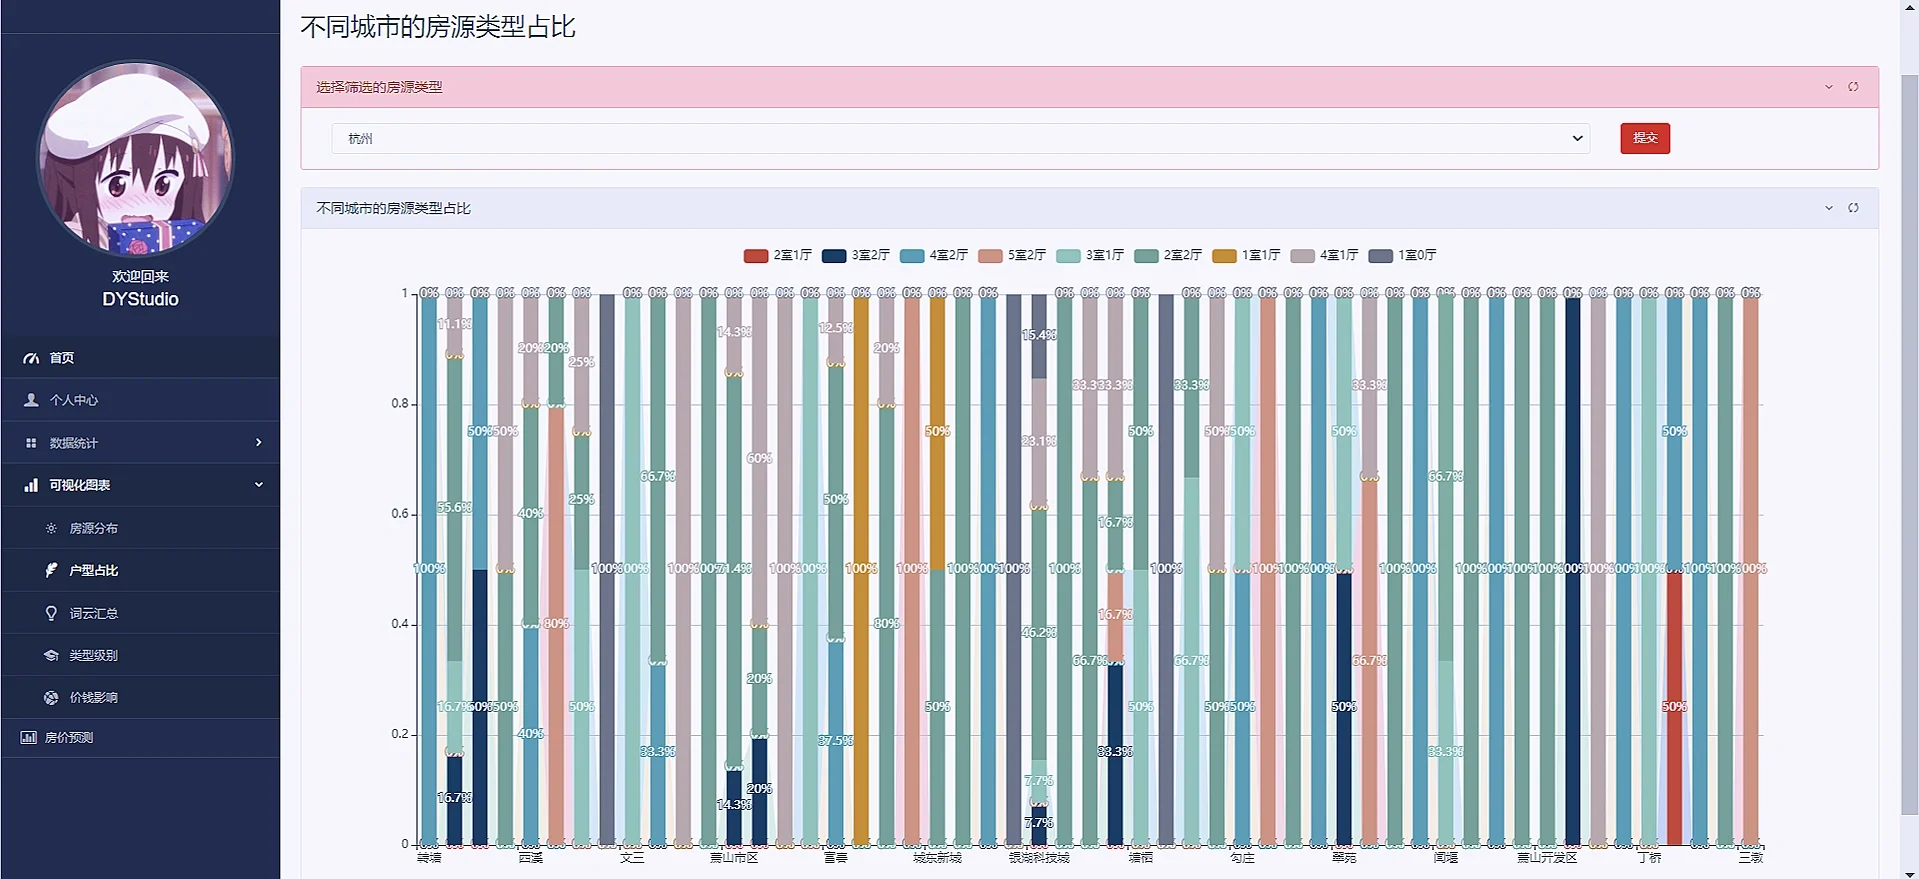
3.4 数据可视化
数据分析可视化就是利用django框架的orm对数据库的数据进行处理,处理成所需要展示的E-charts所需要的类型即可,由于图表过多,这里我就重点阐述一下第一个图表:
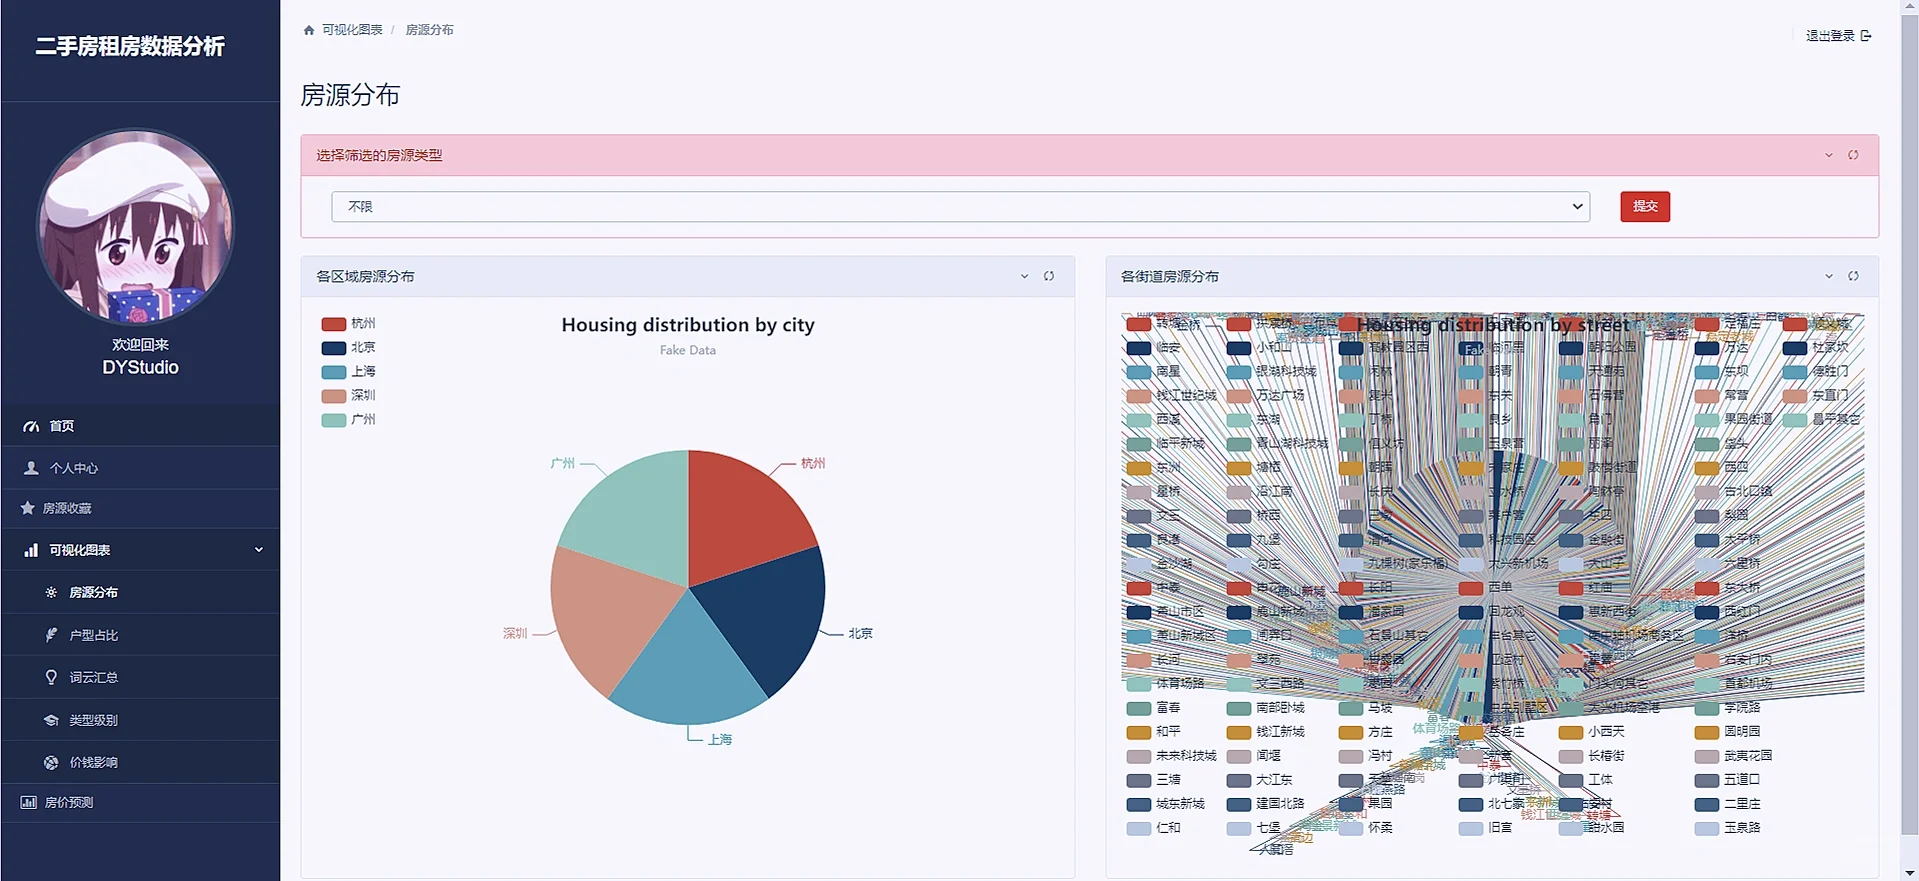
这个页面的图表由上方的下拉框和下方的图表组成,下拉框内可以选择房源的类型如一室一厅,二室一厅,三室一厅等,下方的图表展示的是每个地区该类型的二手房的数量占比,实现也比较简单,就是前端一个select抱歉,在后台获取该标签的内容,然后使用orm的过滤filter函数功能即可,代码如下:
def houseDistribute(request):
    username = request.session['username'].get('username')
    useravatar = request.session['username'].get('avatar')
    types = list(House.objects.values_list('house_type', flat=True).distinct())
    type_name = request.GET.get('type_name')
    print(type_name)
    if type_name != '不限' and type_name != None:
        house = House.objects.all().filter(house_type=type_name).distinct().distinct()
    else:
        house = House.objects.all()
    dict1={};result1=[];dict2={};result2=[]
    for i in house:
        if dict1.get(i.city,-1)==-1:
            dict1[i.city]=1
        else:
            dict1[i.city]+=1
    for k,v in dict1.items():
        result1.append({
            'value': v,
            "name":k
        })
    for i in house:
        if dict2.get(i.location, -1) == -1:
            dict2[i.location] = 1
        else:
            dict2[i.location] += 1
    for k, v in dict2.items():
        result2.append({
            'value': v,
            "name": k
        })

    for k,v in dict2.items():
        result2.append({
            'value': v,
            "name":k
        })
    context={'result1':result1,'result2':result2,'username':username,'useravatar':useravatar,'types':types}
    return render(request,'houseDistribute.html',context)
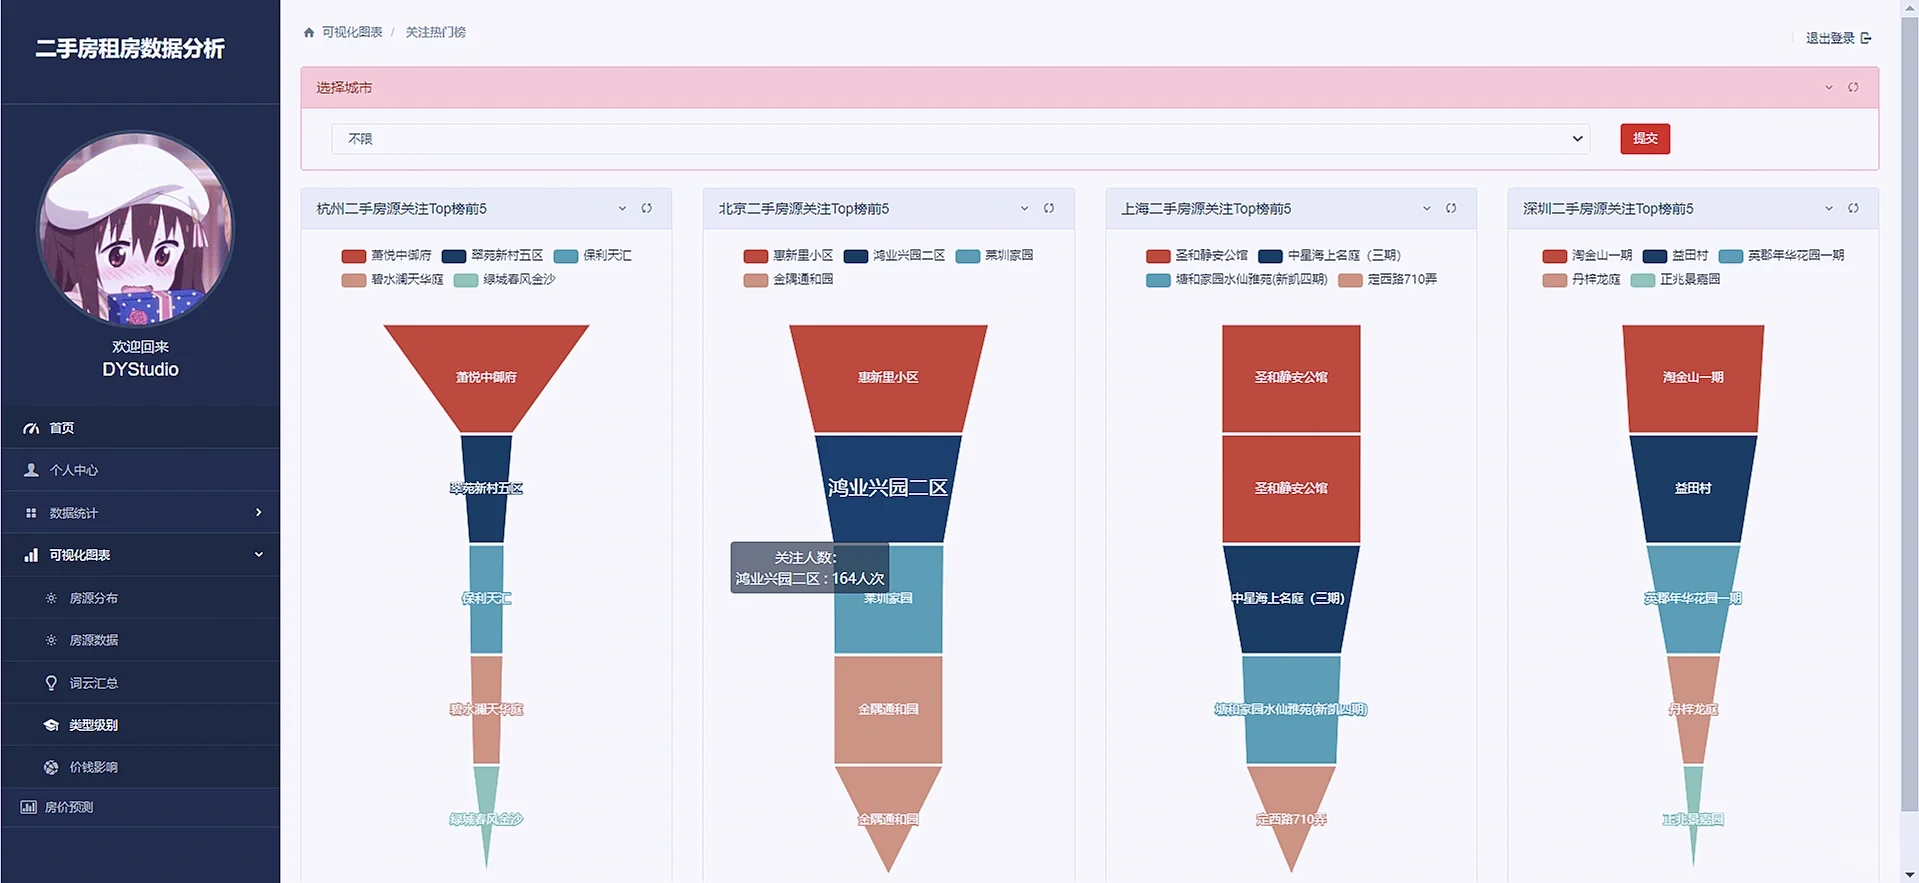
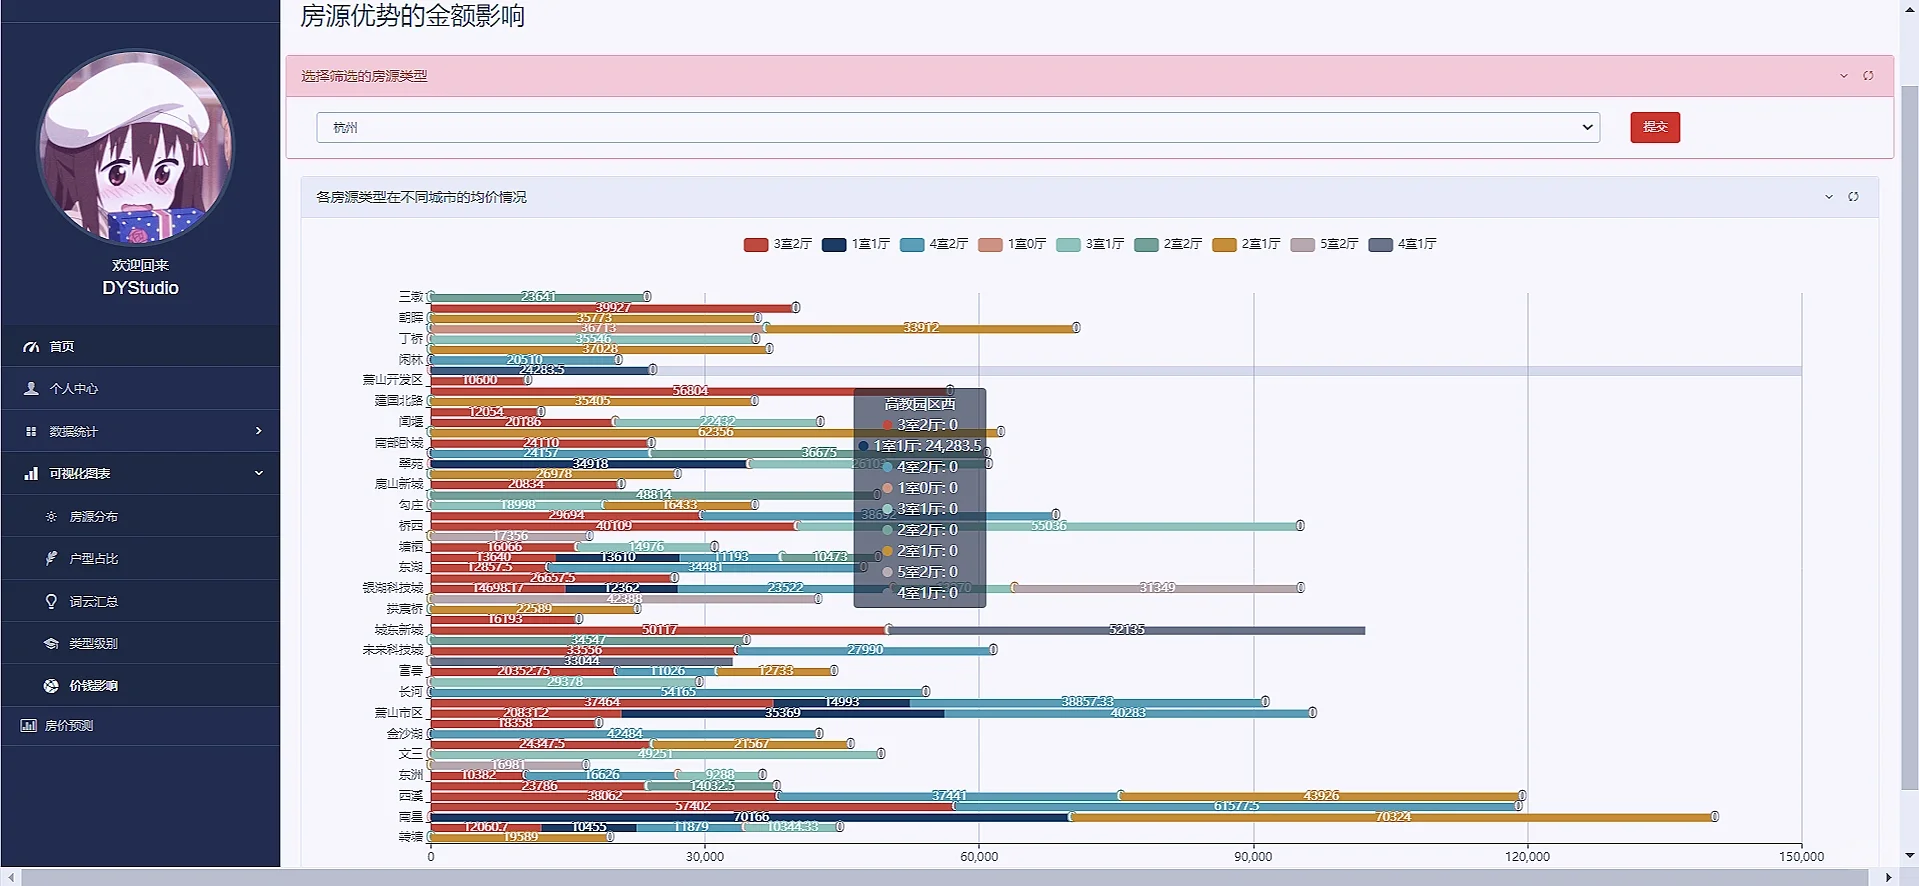
接着把其他可视化也直接把效果图粘贴下来吧“

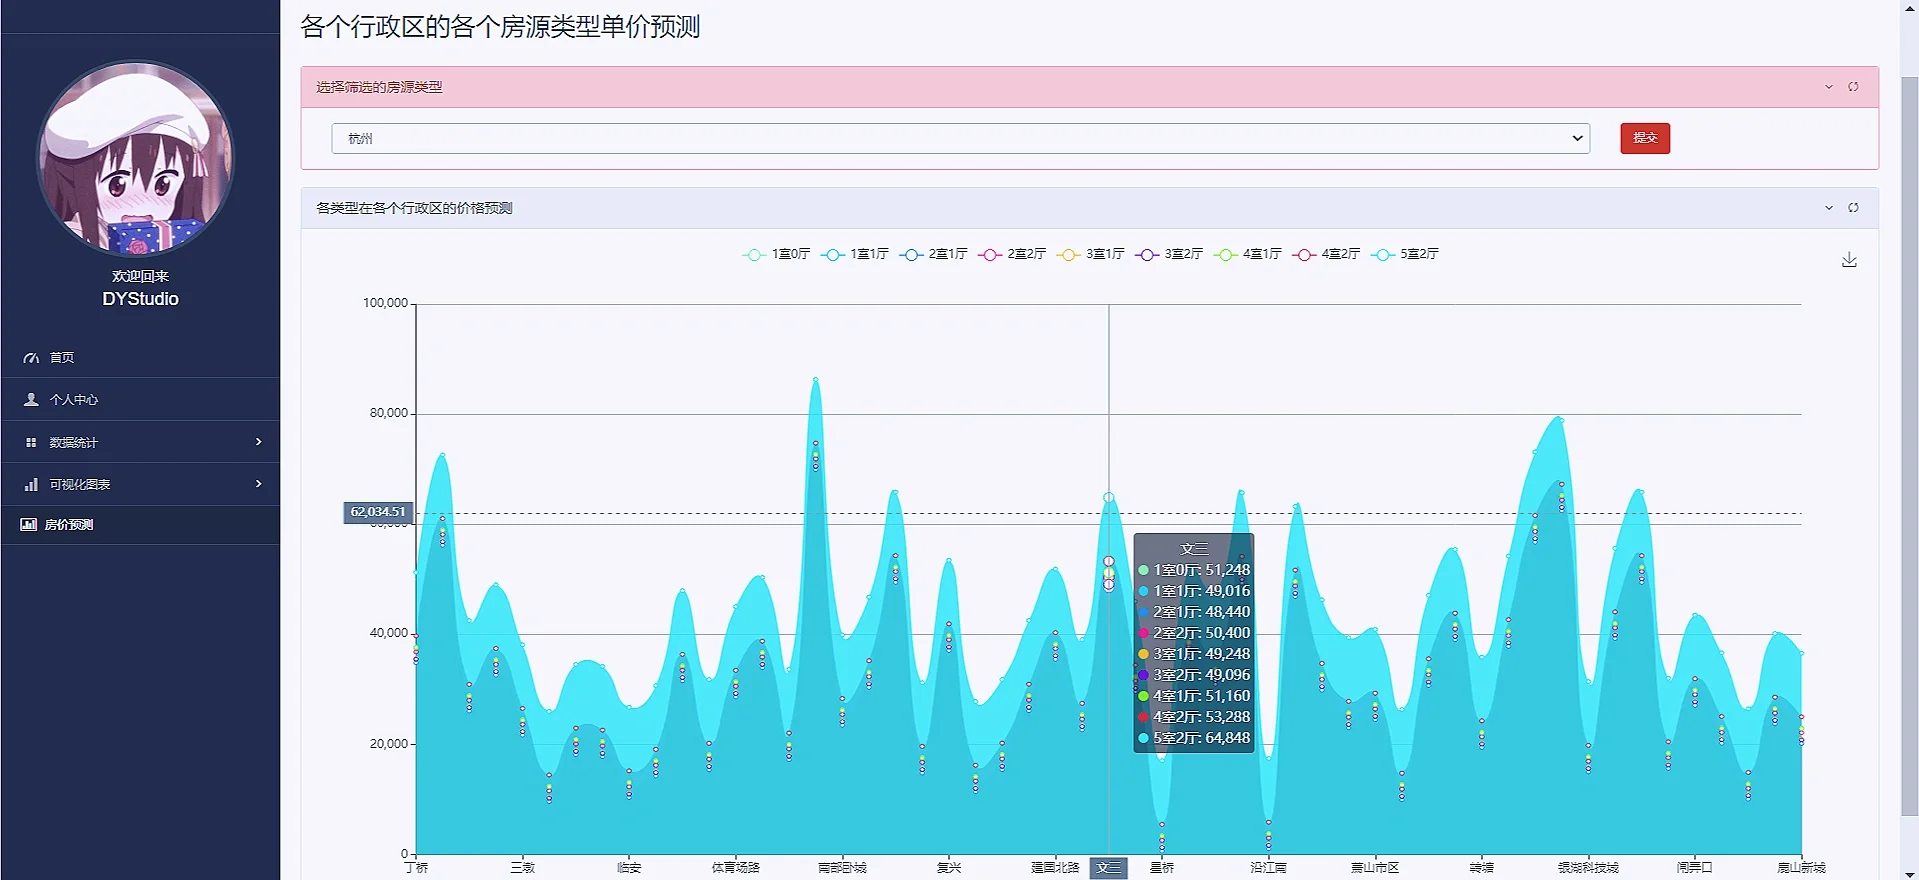
4:模型预测
模型预测使用机器学习的随机森林算法来预测各个城市行政区的各个类型的单价情况:
代码如下:
def predict_unit_price(request):
    # 用户缓存数据
    username = request.session['username'].get('username')
    useravatar = request.session['username'].get('avatar')
    # models.cities
    all_cities = list(House.objects.values_list('city', flat=True).distinct())
    default_name = '杭州'
    city_name = request.GET.get('city_name')
    if city_name != None:
        default_name = city_name
    else:
        city_name = default_name

    # 1. 获取杭州房源数据
    queryset = House.objects.filter(city=default_name)

    # 2. 数据清洗和转换
    data = []
    for house in queryset:
        # 清洗单价数据(去除逗号和单位)
        cleaned_price = house.unit_price \
            .replace('元/平', '') \
            .replace(',', '')

        if cleaned_price.isdigit():
            data.append({
                'location': house.location,
                'house_type': house.house_type,
                'unit_price': float(cleaned_price)
            })

    # 3. 转换数据结构
    df = pd.DataFrame(data)

    if df.empty:
        return JsonResponse({'error': 'No valid data available'}, status=400)

    # 4. 特征编码
    df = pd.get_dummies(df, columns=['location', 'house_type'])

    # 5. 训练预测模型
    X = df.drop('unit_price', axis=1)
    y = df['unit_price']

    if X.shape[0] < 2:
        return JsonResponse({'error': 'Insufficient data for prediction'}, status=400)

    model = LinearRegression()
    model.fit(X, y)

    # 6. 生成预测结果
    predictions = []
    locations = queryset.values_list('location', flat=True).distinct()
    house_types = queryset.values_list('house_type', flat=True).distinct()

    for location in locations:
        for house_type in house_types:
            # 创建特征向量
            features = {
                f'location_{location}': 1,
                f'house_type_{house_type}': 1
            }

            # 转换为DataFrame
            input_df = pd.DataFrame([features]).fillna(0)

            # 确保列顺序匹配
            input_df = input_df.reindex(columns=X.columns, fill_value=0)

            # 进行预测
            predicted_price = model.predict(input_df)

            predictions.append({
                'location': location,
                'house_type': house_type,
                'predicted_unit_price': round(predicted_price[0], 2)
            })


    # 原始数据
    data = predictions

    # 1. 获取所有不同的house_type
    house_types = sorted(list({item['house_type'] for item in data}))

    # 2. 获取所有不同的location(按字母排序)
    locations = sorted(list({item['location'] for item in data}))

    # 3. 生成颜色梯度配置
    color_pool = [
        '#80FFA5', '#00DDFF', '#37A2FF', '#FF0087', '#FFBF00',
        '#8A2BE2', '#7FFF00', '#DC143C', '#00FFFF', '#FFD700'
    ]

    # 生成series数据
    series = []
    for idx, house_type in enumerate(house_types):
        # 随机生成颜色(确保颜色不同)
        color = color_pool[idx % len(color_pool)] if idx < len(color_pool) else \
            f"rgb({random.randint(0, 255)},{random.randint(0, 255)},{random.randint(0, 255)})"

        # 按location顺序收集价格数据
        price_data = []
        for loc in locations:
            # 查找匹配的数据
            match = next((item for item in data if
                          item['house_type'] == house_type and
                          item['location'] == loc), None)
            price_data.append(round(match['predicted_unit_price'], 2) if match else 0)

        series.append({
            'name': house_type,
            'type': 'line',
            'smooth': 'true',
            'lineStyle': {'width': 0},
            'showSymbol': 'false',
            'areaStyle': {
                'opacity': 0.8,
                'color': color  # 这里直接使用颜色值,前端需要处理渐变
            },
            'emphasis': {'focus': 'series'},
            'data': price_data
        })
    print(house_types)
    print(locations)
    print(series)


    return render(request,'predict_unit_price.html', {'username': username, 'useravatar':useravatar,
                                                     'predictions': predictions,'house_types': house_types,'locations': locations,'series': series,
                                                      'color_pool': color_pool, 'all_cities': all_cities,'default_name':default_name})
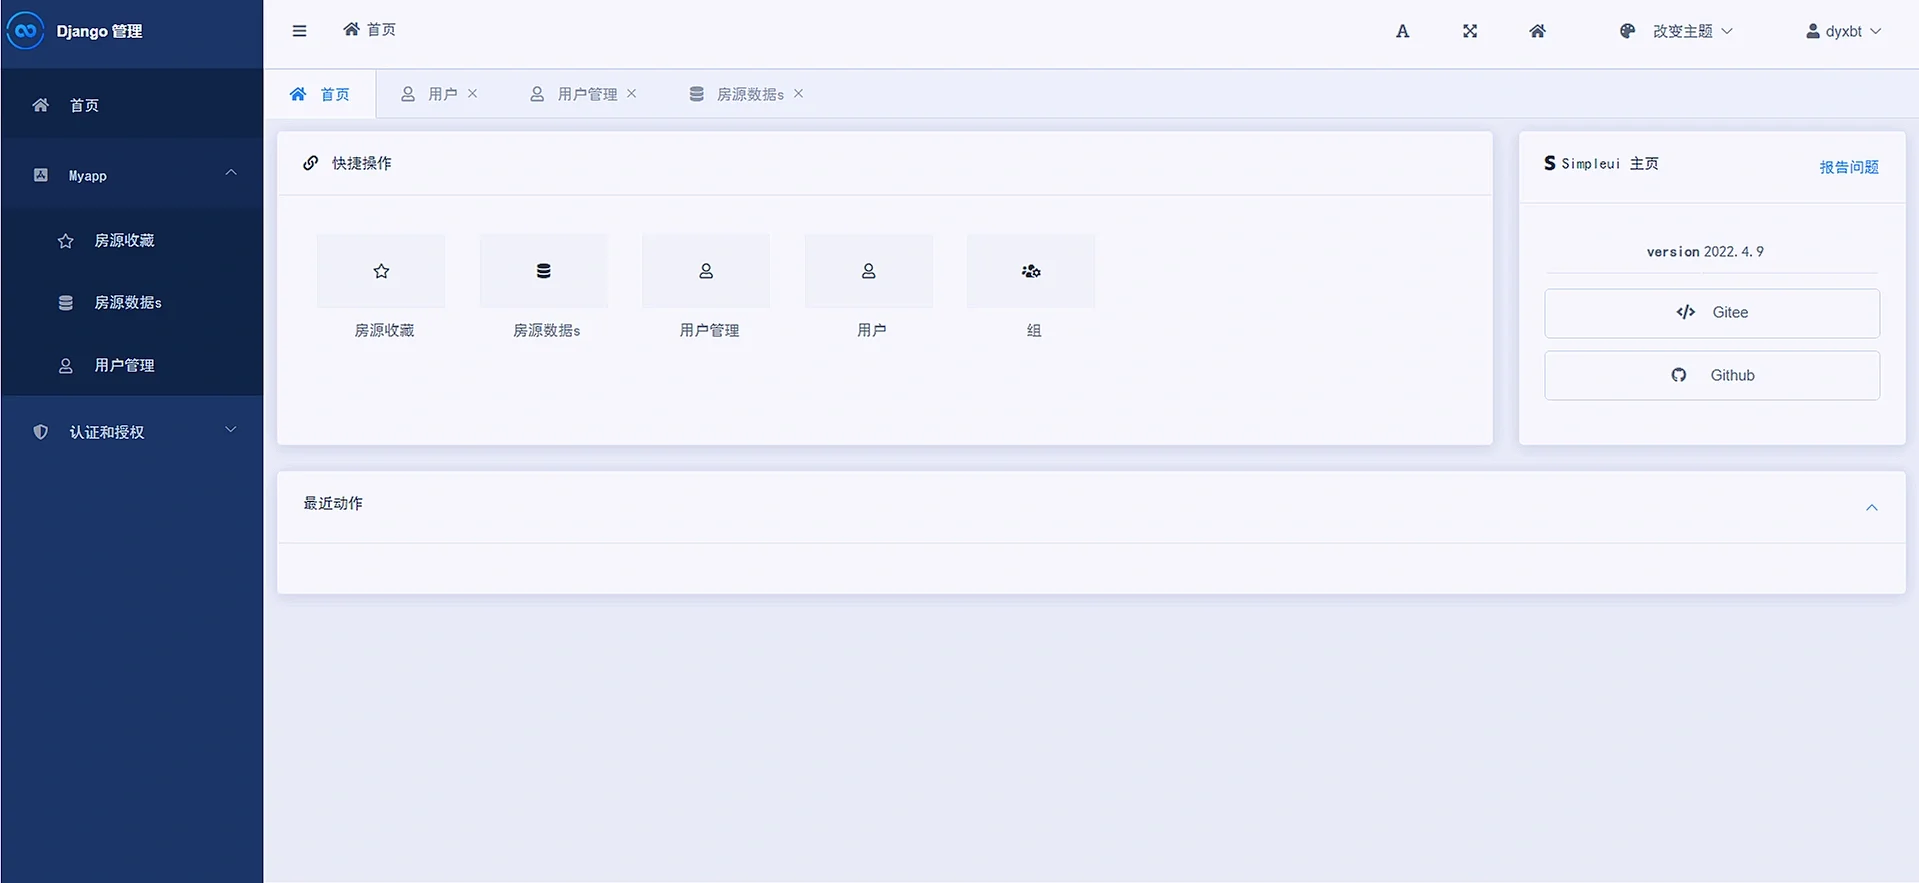
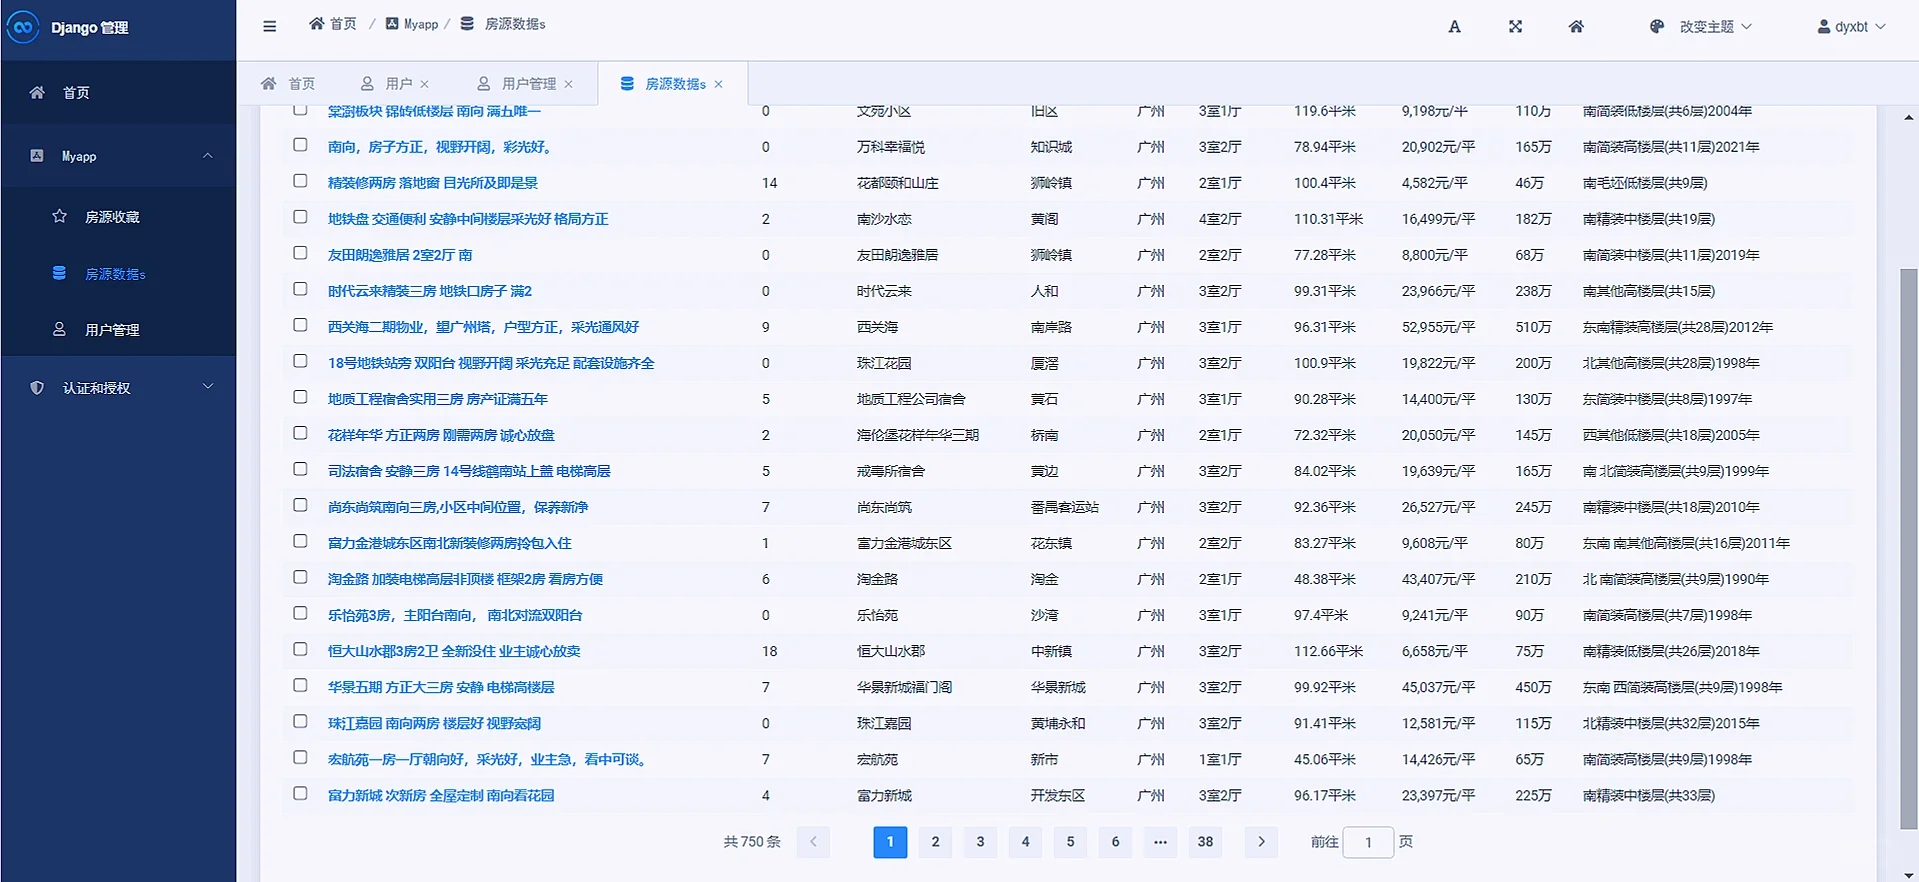
 5:后台管理
使用django框架自带的admin后台管理simpleui优化,只需要在settings里声明即可:
7:结尾
数据可视化的项目重在利用后端语言处理数据,无论是使用orm还是numpy,或者pandas等效果都可以实现的,然后想用web的形式表现出来的话就可以把web框架结构了解一下即可!


 3585
3585

 被折叠的 条评论
为什么被折叠?
被折叠的 条评论
为什么被折叠?
 到【灌水乐园】发言


