


 本文介绍了如何在SpringBoot项目中使用Highcharts库创建动态的扇形和柱状统计图。首先,讲述了Highcharts的环境配置,包括jQuery的安装和Highcharts的下载或引入CDN。接着,详细说明了新建spring-boot项目的过程,涉及controller、mapper和简单的SQL查询。最后,展示了运行效果,并提醒读者根据数据库数据动态调整图表,并鼓励在遇到问题时保持耐心解决。
1.Highcharts 环境配置
1)安装 jQuery
2)安装 Highcharts
Highcharts 安装可以使用以下两种方式:
- 1、访问 highcharts.com 下载 Highcharts 包。
- 2、使用官方提供的 CDN 地址:http://code.highcharts.com/highcharts.js
2.新建spring-boot项目
PS:后台代码过程有点像单表查询!建项目请百度其它,菜单于下:
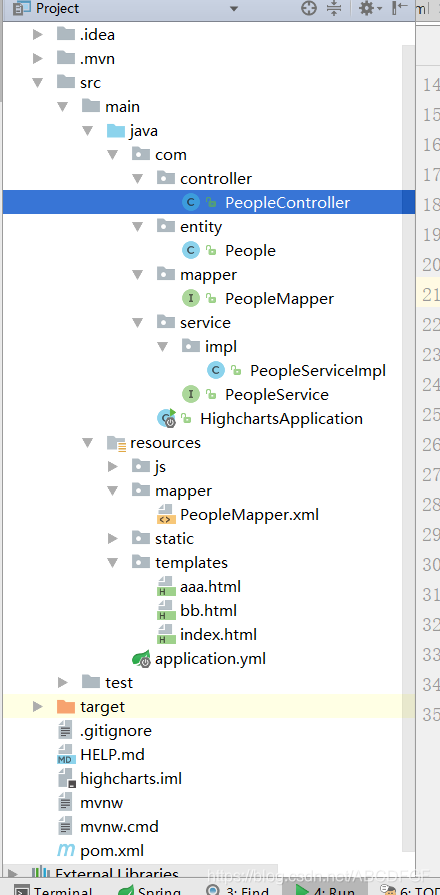
1)controller类
package com.highchart.controller;

import com.highchart.pojo.cylinder;
import com.highchart.service.cylinderService;
import org.springframework.beans.factory.annotation.Autowired;
import org.springframework.stereotype.Controller;
import org.springframework.ui.Model;
import org.springframework.web.bind.annotation.RequestMapping;
import org.springframework.web.bind.annotation.ResponseBody;

import java.util.List;

/**
 * Created by dell on 2020/1/3.
 */
@Controller
public class higController {
    @Autowired
    private cylinderService cylinde
最低0.47元/天 解锁文章


 693
693

 被折叠的 条评论
为什么被折叠?
被折叠的 条评论
为什么被折叠?
 到【灌水乐园】发言


