


在这里,衷心感谢 uvcode、可爱的卤蛋、摆砸 、 噜噜噜~~ 和 WZB不虎彡。对他们提出的宝贵意见和精心的修改表示深深的谢意。本博客整理了往年国科大的数据挖掘试题,本次整合涵盖绝大多数题型,并在我们的通力合作下,完成了这些答案。内容可能尚不完美,仅供大家学习和参考。
第一套试卷
第 1 题
1、Suppose a hospital tested the age and body fat for 18 randomly selected adults with the following result:
| age | 39 | 57 | 41 | 58 | 47 | 58 | 49 | 60 | 50 | 61 | 23 | 52 | 23 | 54 | 27 | 54 | 27 | 56 |
| %fat | 31.4 | 30.2 | 25.9 | 34.1 | 27.4 | 32.9 | 27.2 | 41.2 | 31.2 | 35.7 | 9.5 | 34.6 | 26.5 | 42.5 | 7.8 | 28.8 | 17.8 | 33.4 |
(a) Use smoothing by bin means to smooth the age data, using a bin depth of 6. Illustrate your steps. (5 points)
(b) Partition the age into 3 bins by equal-width partitioning, and use bin boundary to smooth each bin. (5 points)
(c) Use min-max normalization to transform the value 49 for age onto the range [0.0, 1.0]. (5 points)
(d) Use z-score normalization to transform the value 41.2 for body fat, where the standard deviation of body fat is 9.25. (5 points)
解:
(a) Use smoothing by bin means to smooth the age data, using a bin depth of 6. Illustrate your steps.
先对 age 进行排序:
23,23,27,27,39,41,47,49,50,52,54,54,56,57,58,58,60,61
将数据划分为深度为 6 的等深分箱:
-
第一个箱:23, 23, 27, 27, 39, 41
-
第二个箱:47, 49, 50, 52, 54, 54
-
第三个箱:56, 57, 58, 58, 60, 61
计算每个箱的平均值,并用平均值替换箱内的所有数据:
-
第一个箱平均值:
-
第二个箱平均值:
-
第三个箱平均值:
用平均值替换箱内的所有数据:
-
平滑后的第一个箱:30, 30, 30, 30, 30, 30
-
平滑后的第二个箱:51, 51, 51, 51, 51, 51
-
平滑后的第三个箱:58, 58, 58, 58, 58, 58
因此平滑后的答案为:30, 30, 30, 30, 30, 30, 51, 51, 51, 51, 51, 51, 58, 58, 58, 58, 58, 58
(b) Partition the age into 3 bins by equal-width partitioning, and use bin boundary to smooth each bin.
最大值为 61, 最小值为 23, 分箱数量为 3,故分箱宽度为:
因此第一个分箱:[23,36),第二个分箱:[36, 49),第三个分箱为:[49, 62),因此分箱后的数据为:
-
第一个箱:23,23,27,27
-
第二个箱:39,41,47
-
第三个箱:49,50,52,54,54,56,57,58,58,60,61
边界平滑的结果:
-
第一个箱:23,23,27,27
-
第二个箱:39,39,47
-
第三个箱:49,49,49,49,49,61,61,61,61,61,61
因此平滑后的答案为:23,23,27,27,39,39,47,49,49,49,49,49,61,61,61,61,61,61
(c) Use min-max normalization to transform the value 49 for age onto the range [0.0, 1.0].
最小值为 23,最大值为 61,根据 min-max 公式:
因此答案为:0.68
(d) Use z-score normalization to transform the value 41.2 for body fat, where the standard deviation of body fat is 9.25.
fat 的总和为:
fat 的平均值为:
根据 z-score 的公式可得:
因此答案为:1.34
新增题
下面是一个超市商品 A 连续 20 个月的销售数据(单位为百元)。
21,16,19,24,27,23,22,21,20,17,16,20,23,22,18,24,26, 25,20,26。
对以上数据进行噪声平滑,使用深度为 5 的 Equal-depth binning 方法。
(a) 采用bin median方法进行平滑;
(b) 采用bin boundaries方法进行平滑。
解:
先排序!排序后的序列为 {16,16,17,18,19,20,20,20,21,21,22,22,23,23,24,24,25,26,26,27}。
bin 1: 16, 16, 17, 18, 19 中位数 17
bin 2: 20, 20, 20, 21, 21 中位数 20
bin 3: 22, 22, 23, 23, 24 中位数 23
bin 4: 24, 25, 26, 26, 27 中位数 26
(a) 采用bin median方法进行平滑;
bin 1: 17, 17, 17, 17, 17
bin 2: 20, 20, 20, 20, 20
bin 3: 23, 23, 23, 23, 23
bin 4: 26, 26, 26, 26, 26
(b) 采用bin boundaries方法进行平滑。
bin 1: 16, 16, 16, 19, 19
bin 2: 20, 20, 20, 21, 21
bin 3: 22, 22, 24, 24, 24
bin 4: 24, 24, 27, 27, 27
第 2 题
2、Given a transaction database below, let min_support = 50% and min_confidence = 75%:
| TID | Items-bought |
| T1 | {a, b, e} |
| T2 | {a, b, c, e} |
| T3 | {a, b, d, e} |
| T4 | {a, c, d,e} |
| T5 | {b, c, e} |
| T6 | {b, d, e} |
| T7 | {c, d} |
| T8 | {a, b, c} |
| T9 | {a, b, e} |
| T10 | {a, b, e} |
(a) Find all frequent itemsets using Apriori method. Write up frequent itemsets and candidate set at each level. (10 points)
(b) Find all frequent itemsets using FP-growth method. Write up the conditional pattern base for each item, and the conditional FP-tree for each item. (10 points)
(c) Using the resulting frequent itemsets, find all strong associations in terms of the following rule format:
For any transaction x, buys(x, item1) ∧ buys(x, item2) ⇒ buys(x, item3) [s=?, c=?]. (5 points)
解:
(a) Find all frequent itemsets using Apriori method. Write up frequent itemsets and candidate set at each level.
候选 1 项集: C1 = {a},{b},{c},{d},{e},计算每个项出现的次数:
-
a:出现于 T1, T2, T3, T4, T8, T9, T10,共7次。
-
b:出现于 T1, T2, T3, T5, T6, T8, T9, T10,共8次。
-
c:出现于 T2, T4, T5, T7, T8,共5次。
-
d:出现于 T3, T4, T6, T7,共4次。
-
e:出现于 T1, T2, T3, T4, T5, T6, T9, T10,共8次。
由于最小支持度为 50%,因此最小出现的次数为 5,满足条件的是 a,b,c,e。
因此筛选出支持度大于等于 50% 的频繁 1 项集为:
L1 = {a}, {b}, {c}, {e}
根据 L1 生成候选 2 项集:C2 = {a,b}, {a,c}, {a,e}, {b,c}, {b,e}, {c,e},计算每个项出现的次数:
-
{a,b}:出现于 T1, T2, T3, T8, T9, T10,共6次。
-
{a,c}:出现于 T2, T4, T8,共3次。
-
{a,e}:出现于 T1, T2, T3, T4, T9, T10,共6次。
-
{b,c}:出现于 T2, T5, T8,共3次。
-
{b,e}:出现于 T1, T2, T3, T5, T6, T9, T10,共7次。
-
{c,e}:出现于 T2, T4, T5,共3次。
因此筛选出支持度大于等于 50% 的频繁 2 项集为:
L2 = {a,b}, {a,e}, {b,e}
根据 L2 生成候选 3 项集:C3 = {a, b, e},计算每个项出现的次数:
-
{a,b,e}:出现于 T1, T2, T3, T9, T10,共5次。
因此筛选出支持度大于等于 50% 的频繁 3 项集为:
L3 = {a,b,e}
因此答案为:
-
候选 1 项集(C1): {a},{b},{c},{d},{e}
-
频繁 1 项集(L1): {a}, {b}, {c}, {e}
-
候选 2 项集(C2): {a,b}, {a,c}, {a,e}, {b,c}, {b,e}, {c,e}
-
频繁 2 项集(L2): {a,b}, {a,e}, {b,e}
-
候选 3 项集(C3): {a,b,e}
-
频繁 3 项集(L3): {a,b,e}
(b) Find all frequent itemsets using FP-growth method. Write up the conditional pattern base for each item, and the conditional FP-tree for each item. (使用 FP-growth 方法找到所有频繁项集。为每个项写出条件模式基和条件 FP 树)
知识学习参考博客:FP-tree(频繁模式增长)算法原理详解(通俗易懂)-优快云博客。本题与第二套试卷第 5 题相似。
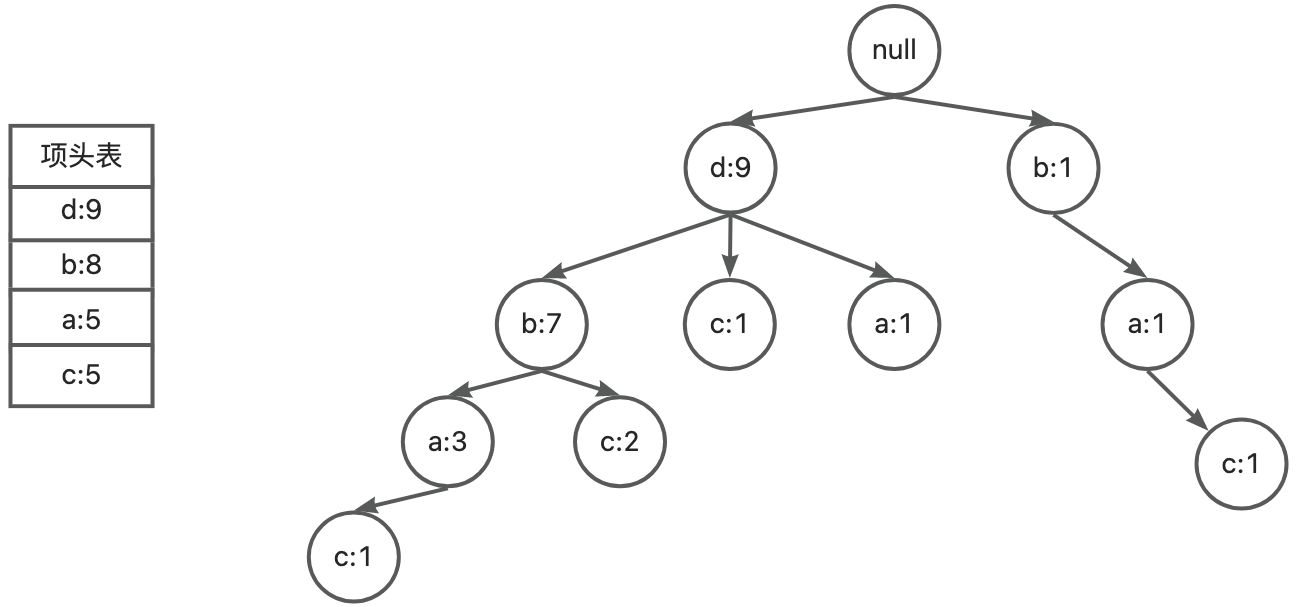
计算频繁 1 项集 {a:7},{b:8},{c:5},{e:8} 的支持度并按照支持度降序排列项,对表中数据进行进行筛选、排序。
| TID | Items-bought |
| T1 | {b, e, a} |
| T2 | {b, e, a, c} |
| T3 | {b, e, a} |
| T4 | {e, a, c} |
| T5 | {b, e, c} |
| T6 | {b, e} |
| T7 | {c} |
| T8 | {b, a, c} |
| T9 | {b, e, a} |
| T10 | {b, e, a} |
按照排序后的频繁项集开始构建 FP-tree
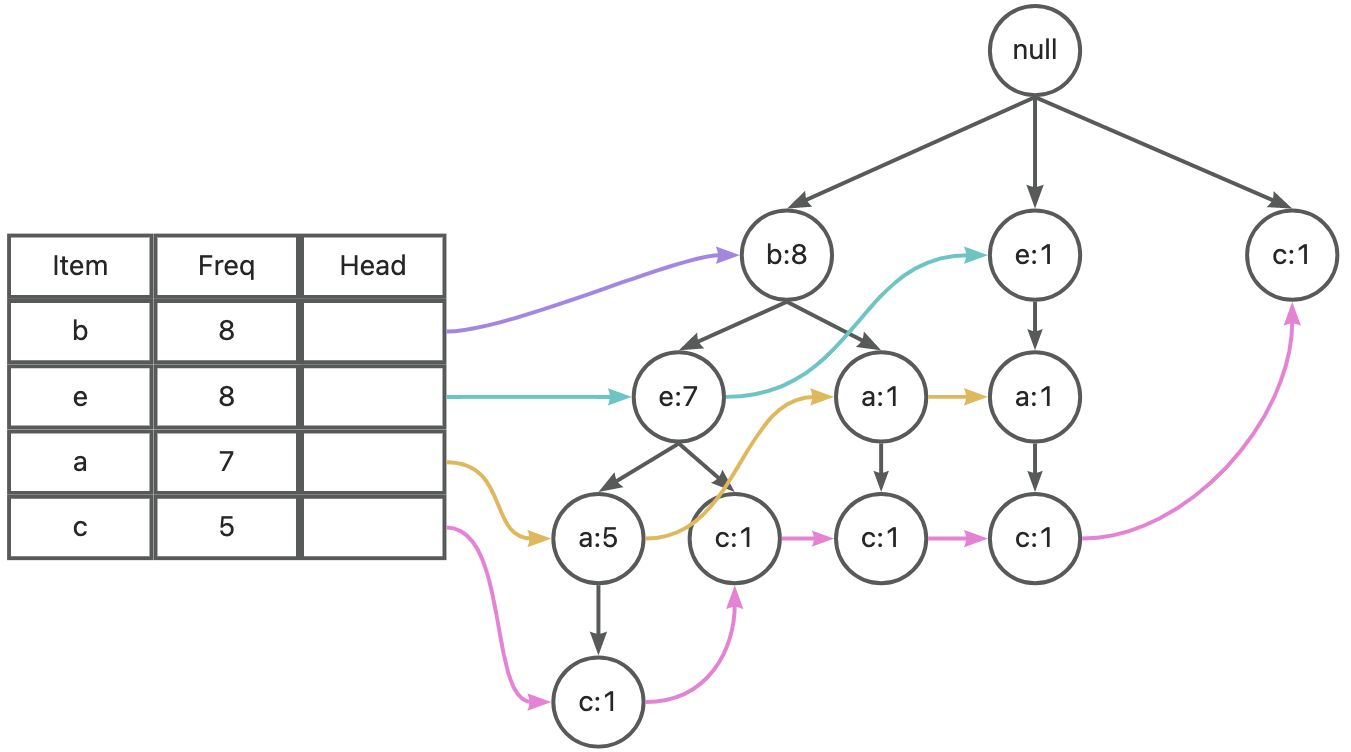
从出现频次少的 item 开始确定条件模式基、条件 FP 树和频繁项集。
-
项 c
c 的条件模式基为:
{b, e, a}, {b, e} ,{e, a},{b, a}
在 c 的条件下各项出现的次数:
{a:3},{b:3},{e:3}
均小于最小支持度,无法构建条件 FP 树,也没法构建频繁 2 项集。
-
项 a
a 的条件模式基为:
{b, e},{b}, {e}
在 a 的条件下各项出现的次数:
{b:6},{e:6}
都大于最小支持度,所以可以构建 FP 树。
a 的条件 FP 树为:
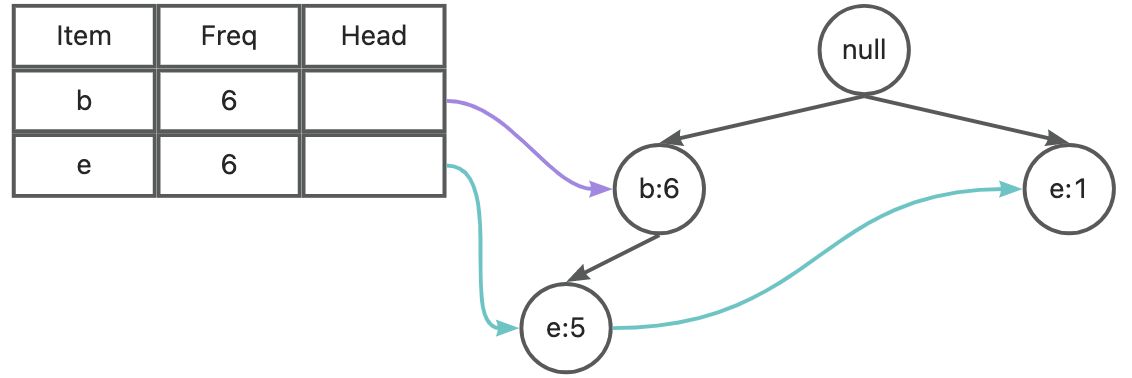
根据 a 对应的条件 FP 树统计的频繁 2 项集为:
{a:6, b:6} {a:6, e:6}
然后递归得到一个频繁 3 项集:
{a:5, b:5, e:5}
-
项 b
项 b 是支持度最高的项,条件模式基为空,所以不考虑。
-
项 e
e 的条件模式基为:
{b}
在 e 的条件下各项出现的次数:
{b:7}
大于最小支持度,所以可以构建 FP 树。
e 的条件 FP 树为:
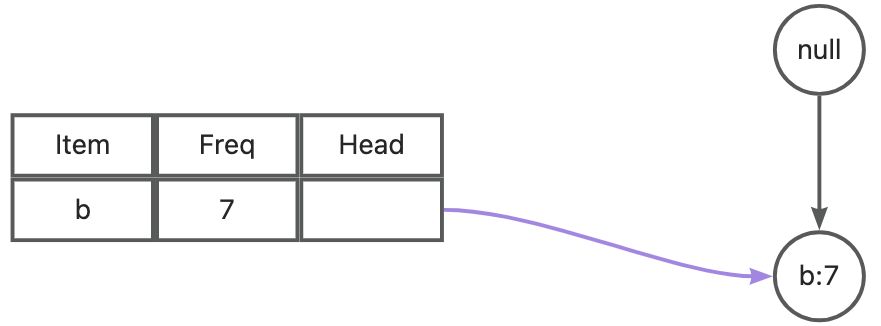
根据 e 对应的条件 FP 树统计的频繁 2 项集为:
{b:7, e:7}
综上,汇总所有频繁项集为:
-
频繁 1 项集:{a},{b},{c},{e}
-
频繁 2 项集:{a, b},{a, e},{b, e}
-
频繁 3 项集:{a, b, e}
(c) Using the resulting frequent itemsets, find all strong associations in terms of the following rule format:For any transaction x, buys(x, item1) ∧ buys(x, item2) ⇒ buys(x, item3) [s=?, c=?].
从频繁项集生成关联规则:
-
频繁3项集:{a, b, e}
-
规则1: {a, b} ⇒ e
- {a, b} 支持度:60%
- 置信度:
是强关联规则
- {a, b, e} 支持度:50%
- 规则2: {a, e} ⇒ b
- {a, e} 支持度:60%
- 置信度:
是强关联规则
- {a, b, e} 支持度:50%
- 规则 3: {b, e} ⇒ a
- {b, e} 支持度:70%
- 置信度:
不是强关联规则
- {a, b, e} 支持度:50%
-
因此满足最小支持度和最小置信度的强关联规则为:
-
buys(x, a) ∧ buys(x, b) ⇒ buys(x, e) [s=50%, c=83.33%]
-
buys(x, a) ∧ buys(x, e) ⇒ buys(x, b) [s=50%, c=83.33%]
第 3 题
3、Given a data set below with three attributes {A, B, C} and two classes {C1, C2}. Build a decision tree, using information gain to select and split attribute. (15 points)
| Instance | A | B | C | Class |
| 1 | 0 | 0 | 0 | C1 |
| 2 | 0 | 0 | 1 | C1 |
| 3 | 0 | 1 | 0 | C1 |
| 4 | 0 | 1 | 1 | C2 |
| 5 | 1 | 0 | 0 | C1 |
| 6 | 1 | 0 | 0 | C1 |
| 7 | 1 | 1 | 0 | C2 |
| 8 | 1 | 0 | 1 | C1 |
| 9 | 1 | 1 | 0 | C2 |
| 10 | 1 | 1 | 0 | C2 |
解:
计算整个数据集的熵,已知:
根据熵的公式:
可得:
计算属性 A、B、C 的信息增益,选择信息增益最大的属性进行划分。
计算 A 的信息增益:
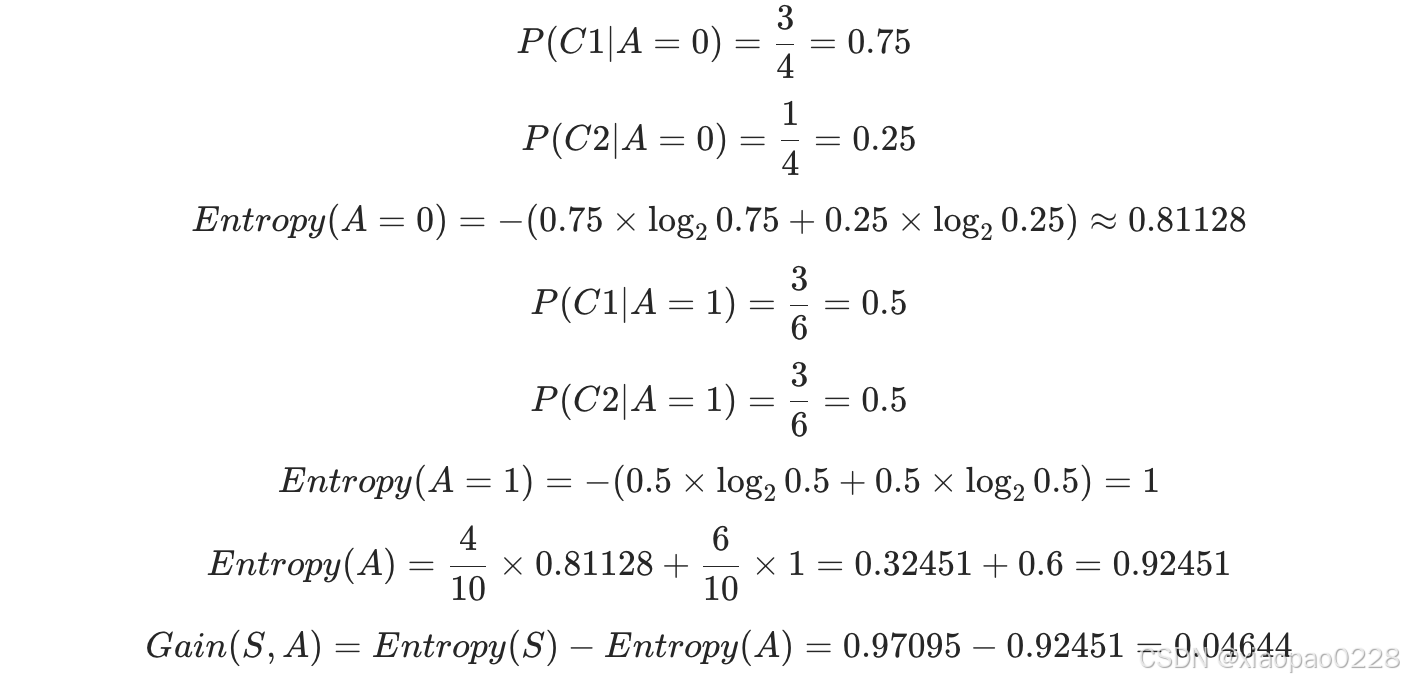
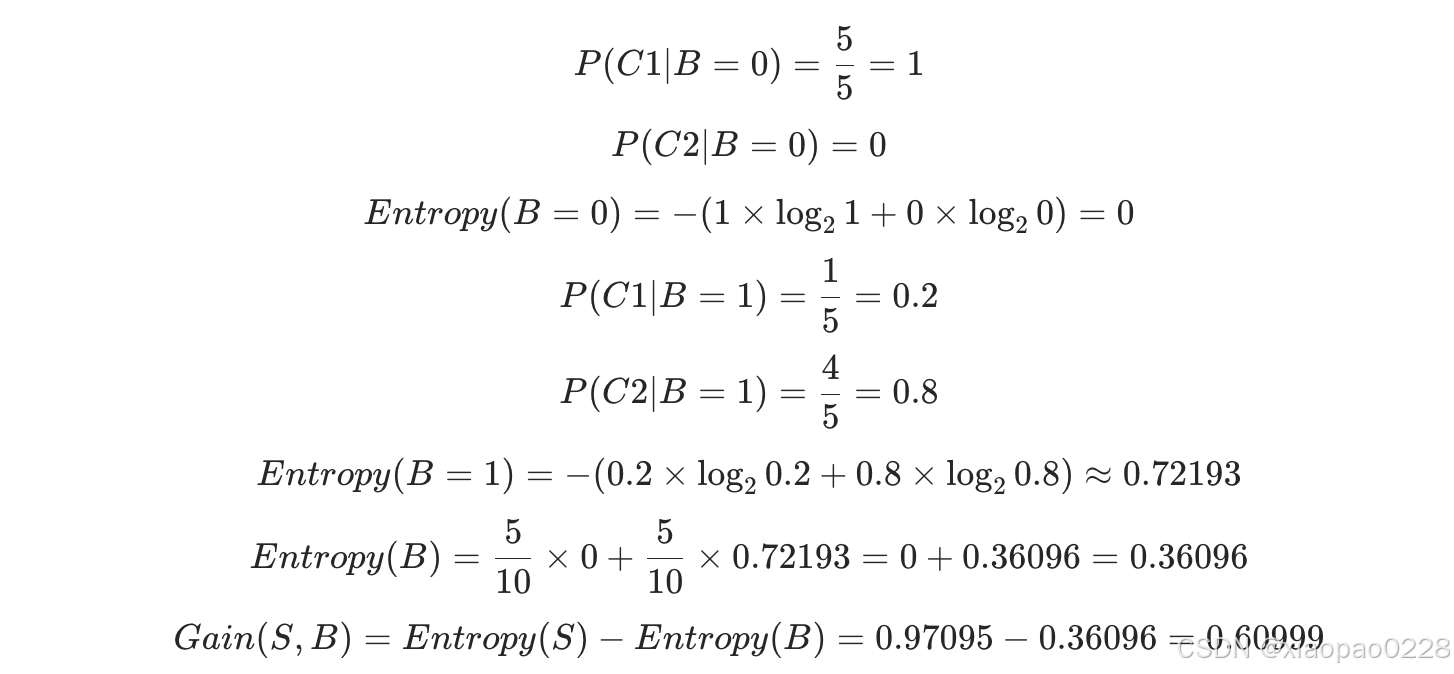
计算 B 的信息增益:
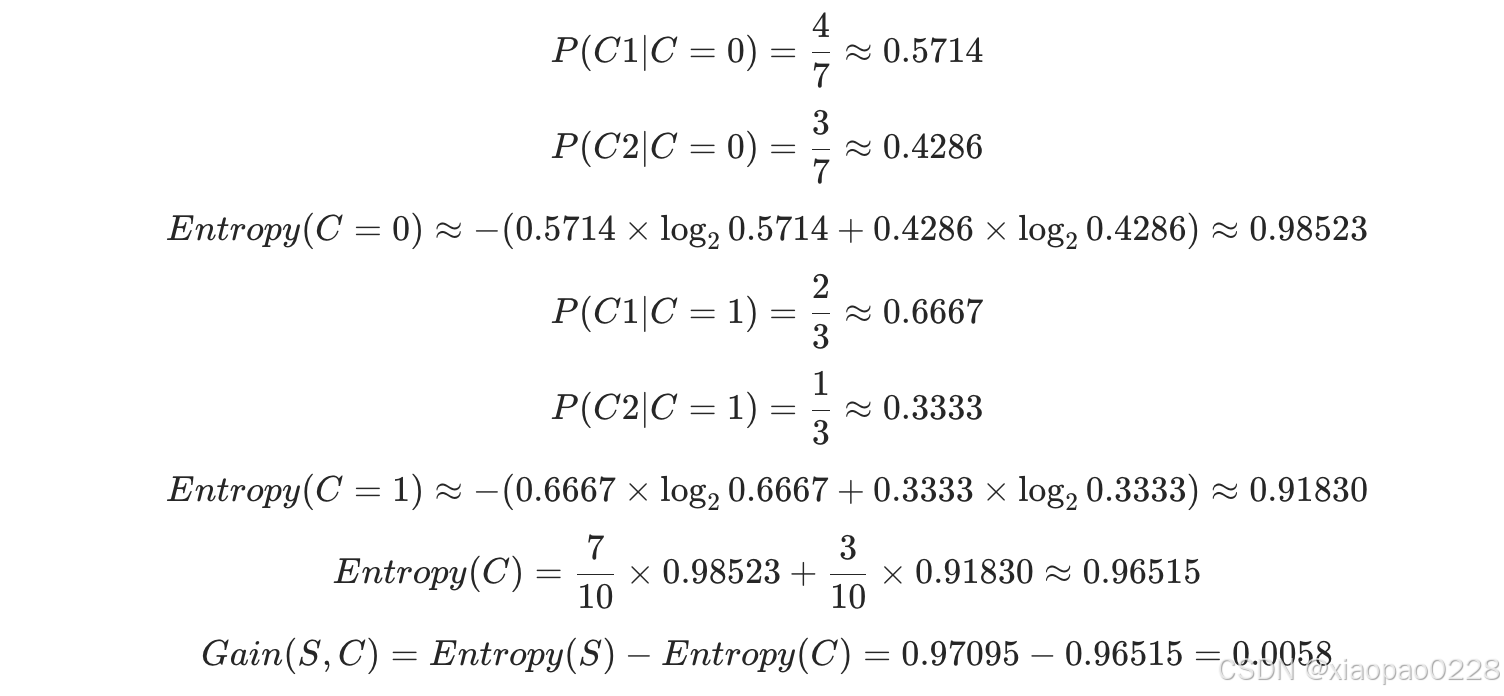
计算 C 的信息增益:
选择信息增益最大的属性进行划分,由于 B 的信息增益最大,因此,选择属性 B 进行划分。
处理分支 B=0,所有实例的类别均为 C1,该节点为纯节点,直接标记为 C1。
处理分支 B=1,该节点不是纯节点,需要继续划分,因此需要在分支 B=1 上选择最优划分属性。已知在 B 分支下的
根据熵的公式可得:
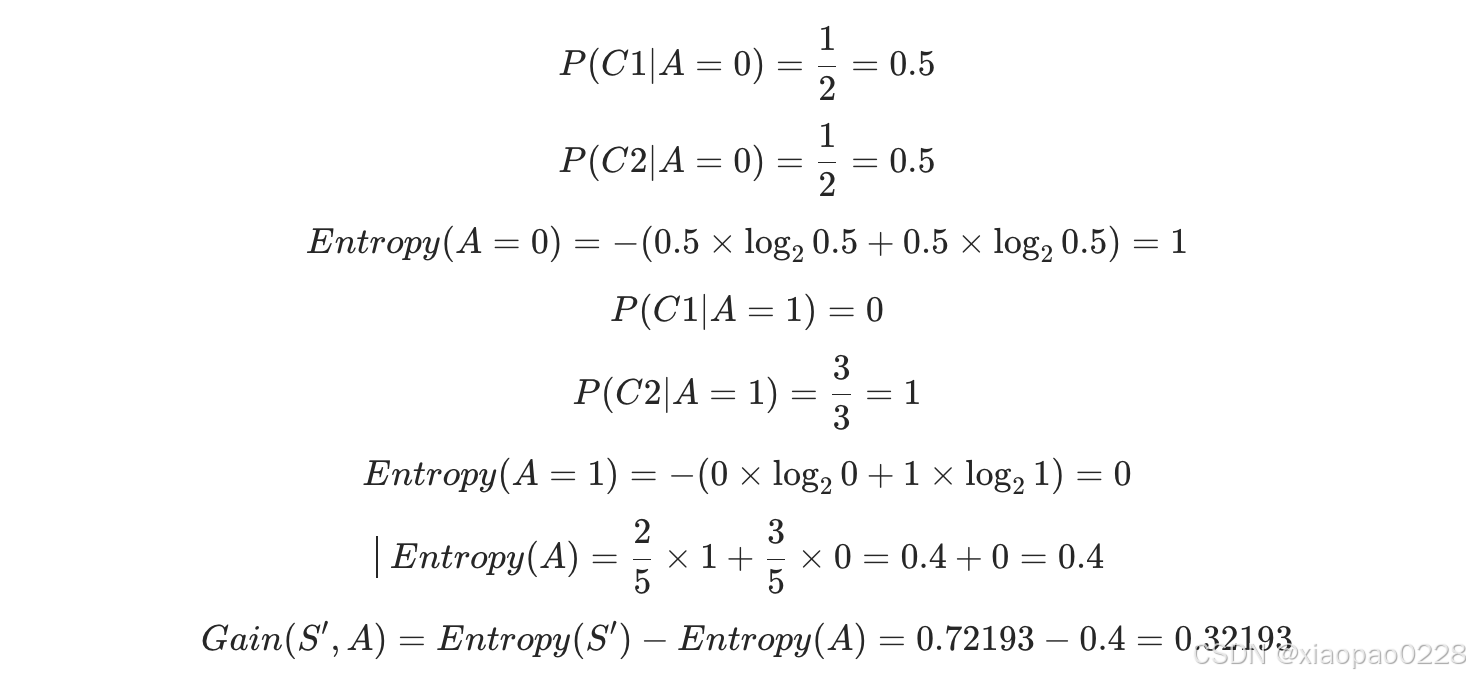
计算 A 在子集 S' 上的信息增益:
计算 C 在子集 S' 上的信息增益:
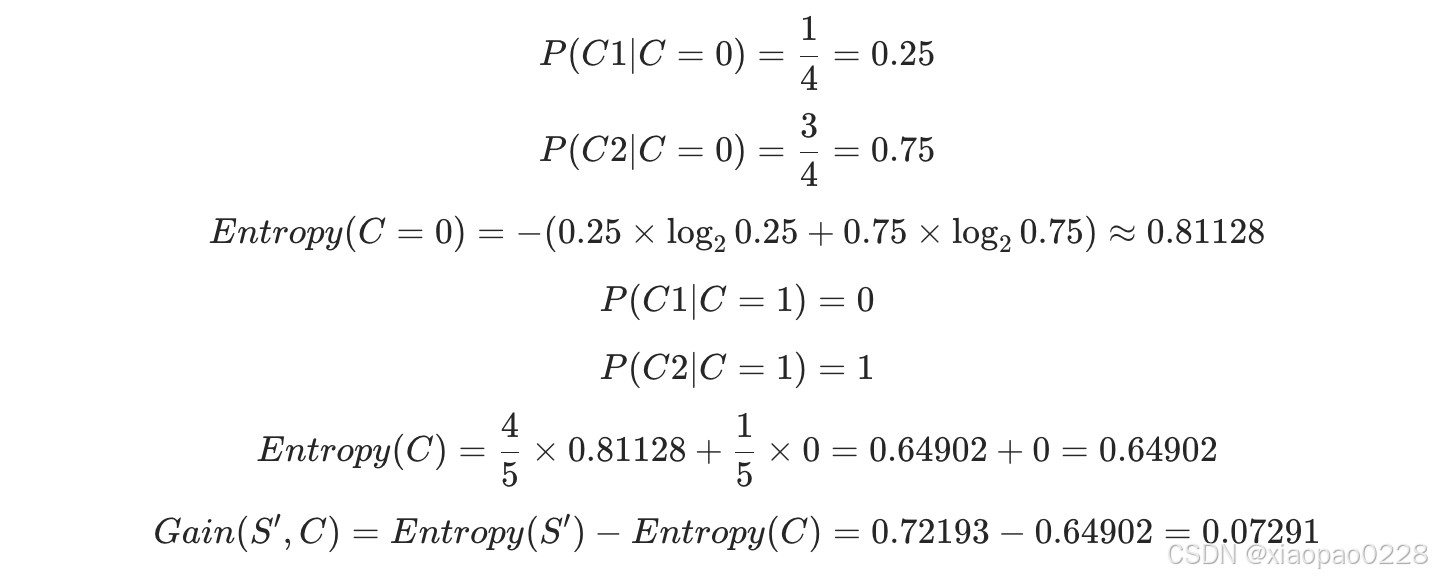
由于 A 的信息增益大,因此,选择属性 A 进行划分。
接下来就剩 C,在分支 A 下划分 C 即可,因此最后的决策树为:
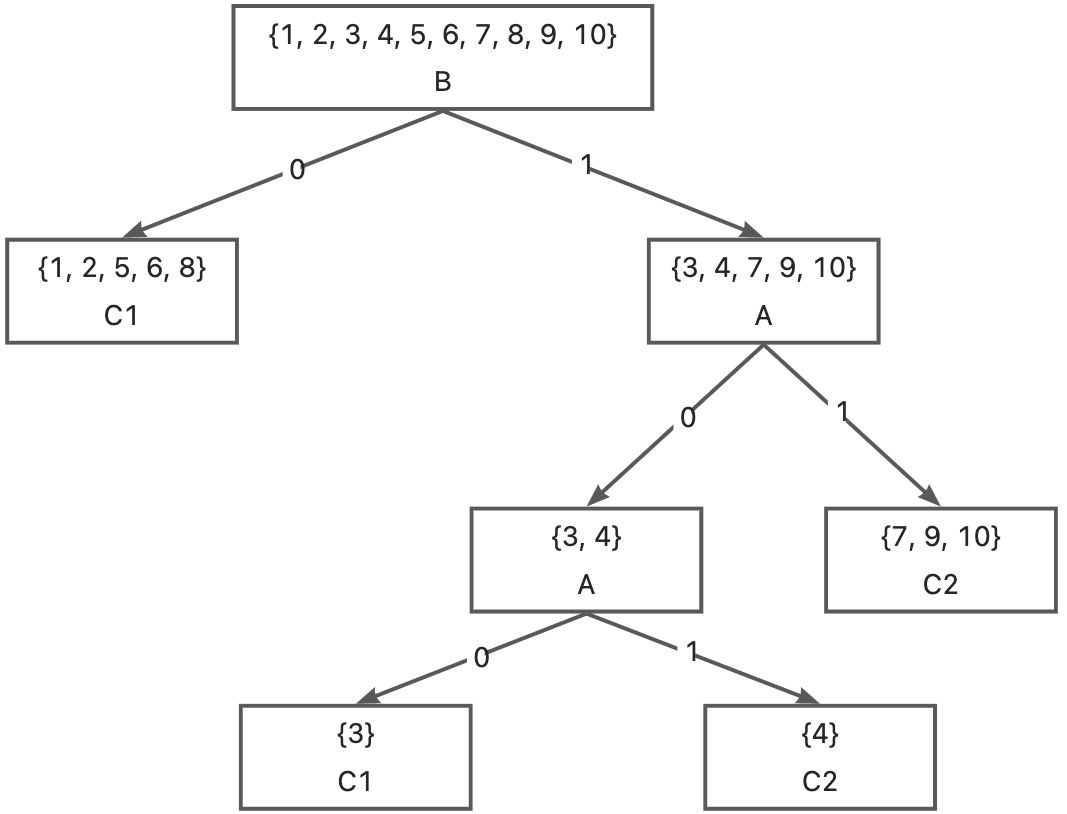
第 4 题
4、Consider the following data set. Use Naïve Bayesian Classifier to predict the class label for a test sample (A=0, B=1, C=0). (10 points)
| Record | A | B | C | Class |
| 1 | 0 | 0 | 0 | C1 |
| 2 | 0 | 0 | 1 | C2 |
| 3 | 0 | 1 | 1 | C2 |
| 4 | 0 | 1 | 1 | C2 |
| 5 | 0 | 0 | 1 | C1 |
| 6 | 1 | 0 | 0 | C1 |
| 7 | 1 | 0 | 0 | C1 |
| 8 | 1 | 0 | 1 | C2 |
| 9 | 1 | 1 | 1 | C1 |
| 10 | 1 | 1 | 0 | C1 |
解:
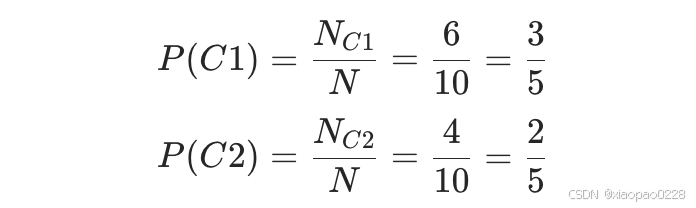
总样本数 N = 10 ,C1 的样本数
C2 的样本数
计算先验概率:
接下来计算条件概率:
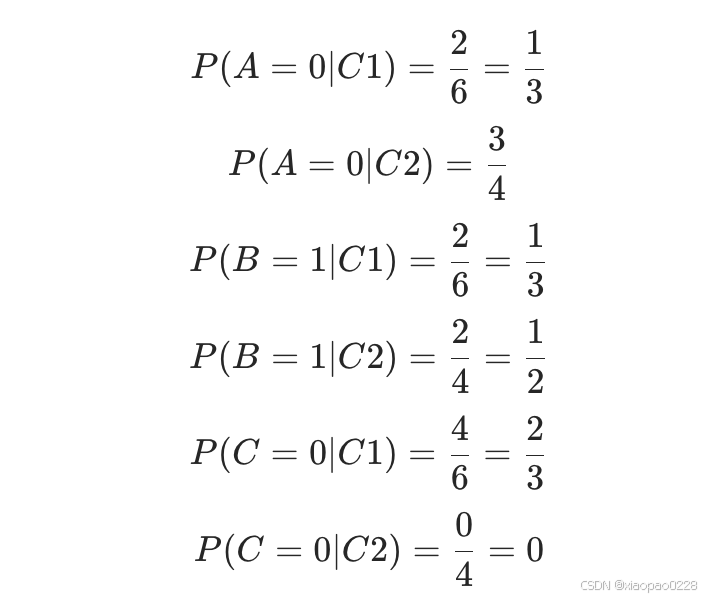
对于给定的 A=0,B=1,C=0,计算:
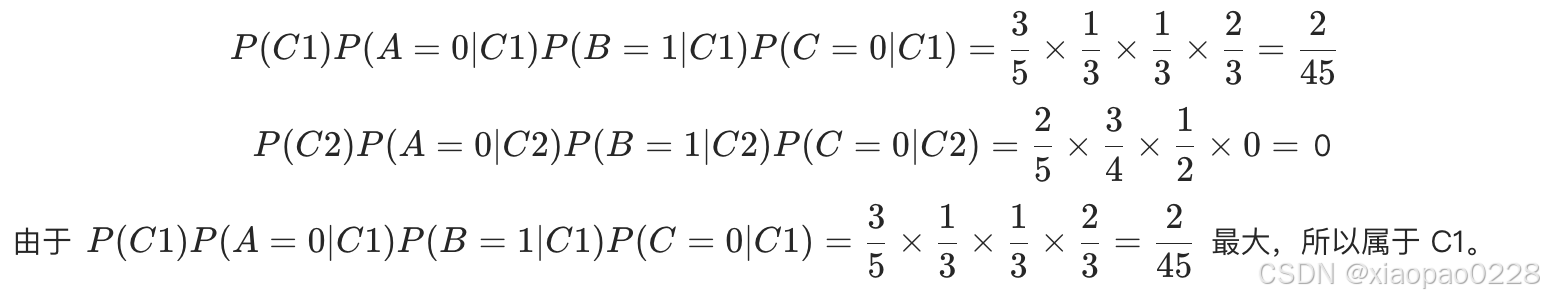
第 5 题
5、Given a data set of 8 sample points. Perform K-means to generate 3 clusters. Suppose initially we assign point 1, 2, 3 as the center of each cluster. Note: list the clusters at each iteration. (15 points)
| ID | Attribute 1 | Attribute 2 |
| 1 | 1 | 1 |
| 2 | 1 | 2 |
| 3 | 2 | 1 |
| 4 | 3 | 4 |
| 5 | 3 | 5 |
| 6 | 4 | 5 |
| 7 | 6 | 8 |
| 8 | 7 | 9 |
解:
初始簇中心:
-
簇 1 中心: 点 1 (1, 1)
-
簇 2 中心: 点 2 (1, 2)
-
簇 3 中心: 点 3 (2, 1)
计算每个点到每个中心的欧几里得距离,并分配到最近的簇,欧几里得公式如下:
| ID | Point | 到簇1中心 (1,1) 距离 | 到簇2中心 (1,2) 距离 | 到簇3中心 (2,1) 距离 | 分配到的簇 |
| 1 | (1, 1) | 0 | 1 | 1 | 簇 1 |
| 2 | (1, 2) | 1 | 0 | 1.414 | 簇 2 |
| 3 | (2, 1) | 1 | 1.414 | 0 | 簇 3 |
| 4 | (3, 4) | 3.606 | 2.828 | 3.162 | 簇 2 |
| 5 | (3, 5) | 4.472 | 3.606 | 4.123 | 簇 2 |
| 6 | (4, 5) | 5 | 4.243 | 4.472 | 簇 2 |
| 7 | (6, 8) | 8.602 | 7.810 | 8.062 | 簇 2 |
| 8 | (7, 9) | 10 | 9.220 | 9.433 | 簇 2 |
第一轮迭代后的簇分配:
-
簇 1:{1}
-
簇 2:{2, 4, 5, 6, 7, 8}
-
簇 3:{3}
更新簇中心:
-
簇 1 新中心: (1, 1)
-
簇 2 新中心:
因此簇 2 新中心为 (4, 5.5)
-
簇 3 新中心: (2, 1)
使用新的中心点重新计算每个点到中心的距离,并重新分配簇。
| 1 | Point | 到簇 1 中心 (1,1) 距离 | 到簇 2 中心 (4,5.5) 距离 | 到簇 3 中心 (2,1) 距离 | 分配到的簇 |
| 2 | (1, 1) | 0 | 5.408 | 1 | 簇 1 |
| 3 | (1, 2) | 1 | 4.610 | 1.414 | 簇 1 |
| 4 | (2, 1) | 1 | 4.924 | 0 | 簇 3 |
| 5 | (3, 4) | 3.606 | 1.802 | 3.162 | 簇 2 |
| 6 | (3, 5) | 4.472 | 1.118 | 4.123 | 簇 2 |
| 7 | (4, 5) | 5 | 0.5 | 4.472 | 簇 2 |
| 8 | (6, 8) | 8.602 | 3.202 | 8.062 | 簇 2 |
| 9 | (7, 9) | 10 | 4.610 | 9.433 | 簇 2 |
第二轮迭代后的簇分配:
-
簇 1:{1, 2}
-
簇 2:{4, 5, 6, 7, 8}
-
簇 3:{3}
更新簇中心:
-
簇 1 新中心:
因此簇 1 新中心为 (1, 1.5)
-
簇 2 新中心:
因此簇 2 新中心为 (4.6, 6.2)
-
簇 3 新中心:(2, 1)
使用新的中心点重新计算每个点到中心的距离,并重新分配簇。
| ID | Point | 到簇 1 中心 (1,1.5) 距离 | 到簇 2 中心 (4.6,6.2) 距离 | 到簇 3 中心 (2,1) 距离 | 分配到的簇 |
| 1 | (1, 1) | 0.5 | 6.325 | 1 | 簇 1 |
| 2 | (1, 2) | 0.5 | 5.530 | 1.414 | 簇 1 |
| 3 | (2, 1) | 1.118 | 5.814 | 0 | 簇 3 |
| 4 | (3, 4) | 3.202 | 2.721 | 3.162 | 簇 2 |
| 5 | (3, 5) | 4.031 | 1.789 | 4.123 | 簇 2 |
| 6 | (4, 5) | 4.610 | 1 | 4.472 | 簇 2 |
| 7 | (6, 8) | 8.198 | 2.280 | 8.062 | 簇 2 |
| 8 | (7, 9) | 9.600 | 3.688 | 9.433 | 簇 2 |
第三轮迭代后的簇分配:
-
簇 1:{1, 2}
-
簇 2:{4, 5, 6, 7, 8}
-
簇 3:{3}
簇中心未发生变化,算法收敛,上述即为最终结果。
6、Suppose that a large store has a transaction database that is distributed among four locations. Transactions in each component database have the same format, namely, where
is a transaction identifier, and
is the identifier of an item purchased in the transaction.
Propose an efficient algorithm to mine global association rules (without considering multilevel associations). You may present your algorithm in the form of an outline. Your algorithm should not require shipping all of the data to one site and should not cause excessive network communication overhead. (15 points)
解:以下回答来自 GPT o1-preview,仅供参考
对于在分布式数据库中挖掘全局关联规则,我们可以设计一种分布式频繁项集挖掘算法,通过在每个位置独立计算局部频繁项集并合并结果,以生成全局的关联规则。该算法的设计避免了将所有数据传输至一个位置,并减少了网络通信开销。
算法大纲:
- 定义全局最小支持度和最小置信度:
- 在算法开始时,设定全局的最小支持度阈值和最小置信度阈值,这些阈值用于筛选频繁项集和有效的关联规则。
- 各个位置独立挖掘局部频繁项集:
- 在每个位置的数据库中,独立地使用关联规则挖掘算法(如 Apriori 或 FP-Growth)来计算局部频繁项集。
-
每个位置根据本地数据计算支持度,得到局部的频繁项集。
-
局部的最小支持度阈值可以设置为全局最小支持度阈值的一个较低值,以捕获潜在的频繁项集候选。
-
收集局部频繁项集候选项:
- 将每个位置的局部频繁项集(包括其局部支持度计数)发送到中央协调节点,或者在各个位置之间传递并合并。
-
去除重复项,形成一个包含所有候选频繁项集的集合 C。
-
这样生成的候选项集能够覆盖所有可能的全局频繁项集,避免遗漏。
-
各个位置计算候选项集的局部支持度:
- 每个位置接收到候选项集 C 后,在本地数据库中扫描这些项集,计算它们在本地的支持度计数。
-
由于每个位置只需扫描候选项集 C,而不是所有可能的项集,减少了计算量。
-
合并支持度计数,计算全局支持度:
- 将每个位置计算的候选项集的支持度计数发送到中央协调节点,或在各个位置之间交换。
-
中央节点将来自所有位置的支持度计数相加,计算每个候选项集的全局支持度。
-
筛选出满足全局最小支持度阈值的项集,形成全局频繁项集。
-
生成全局关联规则:
- 对于全局频繁项集,生成所有可能的关联规则。
-
计算每条规则的全局置信度,置信度的计算基于全局支持度计数。
-
筛选出满足全局最小置信度阈值的规则,作为最终的全局关联规则。
总结:
通过这种分布式频繁项集挖掘算法,我们能够在不需要将所有数据集中到一个位置的情况下,有效地挖掘全局关联规则。同时,由于只在各个位置之间传递必要的信息(候选项集和支持度计数),网络通信开销得到了显著降低。
第二套试卷
第 1 题
1、Please briefly describe the major types of data mining techniques and their corresponding applications. (10 points)
解:
-
分类(Classification)
分类用于将数据分配到预定义的类别中。例如,判断一封邮件是否为垃圾邮件。
-
回归(Regression)
回归技术预测数值型结果,通常用于分析变量间的关系。例如,回归分析可以帮助公司进行销售预测,制定数据驱动的决策。
-
聚类(Clustering)
聚类将相似的数据点分组,而无需预定义类别。例如,将客户划分为不同的群体,以便更精准地进行营销。
-
关联分析(Association Analysis)
关联分析用于发现数据项之间的关系。例如,分析出哪些商品常被一起购买,从而进行商品组合推荐。
-
异常检测(Anomaly Detection)
异常检测识别不符合正常模式的数据点。例如,在信用卡交易中检测异常行为以防止欺诈。
-
降维(Dimensionality Reduction)
降维技术通过减少数据特征数来简化数据分析过程,常用于数据可视化、噪声消除和模型优化。例如,主成分分析(PCA)用于降低数据维度,使分析更加高效。
第 2 题
2、What is Normalization? Please describe the major Normalization methods and their corresponding pros and cons. (6 points)
解:
-
最小-最大归一化
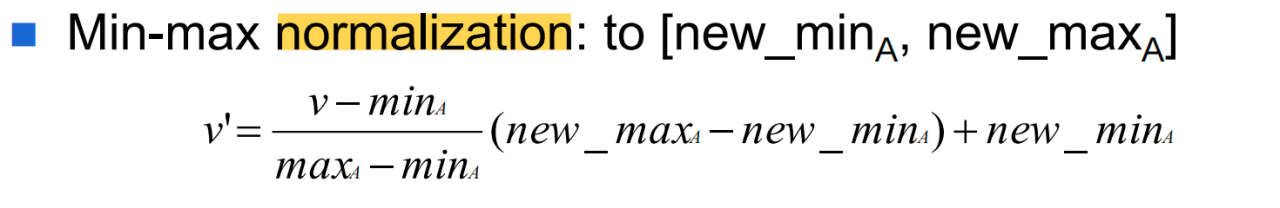
优点:易于理解,适合特征范围已知的情况,保持数据的分布特性。
缺点:对异常值非常敏感,如果存在异常值,归一化效果会受到影响。
-
Z-Score标准化
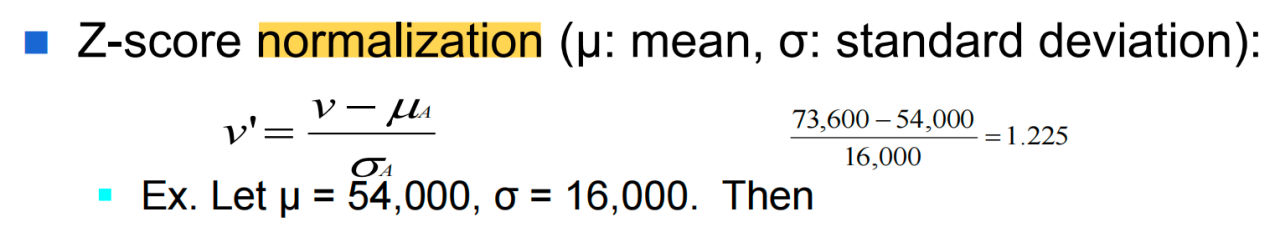
优点:受异常值影响小,适合数据呈正态分布的情况,适合大多数机器学习算法。
缺点:在非正态分布数据中效果不佳
-
小数定标归一化
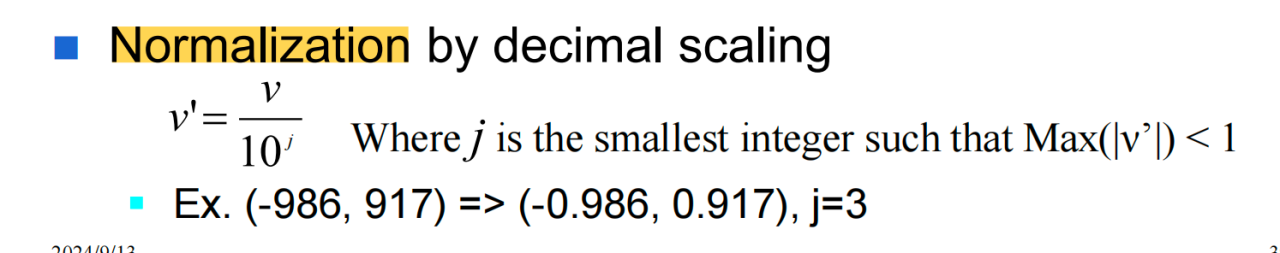
优点:简单易用,适合数值范围较小的数据。
缺点:对数据分布无任何假设,仅适合数据在较小范围内应用。
第 3 题
3、How to overcome overfitting in decision tree? (5 points)
解:
-
剪枝(Pruning):
-
-
前剪枝:在树生成过程中通过设定条件(如最大深度、节点最小样本数)提前停止树的生长。可以限制决策树的复杂度,避免拟合训练数据中的噪声。
-
后剪枝:先生成完整的决策树,然后从底部开始修剪不显著的分支,合并那些对预测效果影响较小的节点。后剪枝可以在保留重要分支的同时去除多余的细节。
-
-
设置最大深度:限制树的最大深度可以有效控制模型复杂度,防止模型过度拟合数据,因为较浅的树结构更具泛化能力。
-
设置最小样本分割数:限制每个节点的最小样本数,以避免树过度划分数据。
-
集成方法:如随机森林,通过多个决策树投票减少单棵树的过拟合风险。
-
数据增强和交叉验证:增加训练数据量、利用数据增强技术或通过交叉验证来评估模型在不同数据子集上的表现,可以帮助决策树识别更具代表性的特征,从而减少对训练数据的过拟合。
第 4 题
4、An e-mail database is a database that stores a large number of electronic mail messages. It can be viewed as a semi-structured database consisting mainly of text data.
(a) How can such an e-mail database be structured so as to facilitate multidimensional search, such as by sender, by receiver, by subject, and by time? (8 points)
(b) Suppose you have roughly classified a set of your previous e-mail messages as junk, unimportant, normal, or important. Describe how a data mining system may take this as the training set to automatically classify new e-mail messages or unclassified ones. (10 points)
解:
(a) How can such an e-mail database be structured so as to facilitate multidimensional search, such as by sender, by receiver, by subject, and by time? (8 points)
事实表:[发件人ID, 收件人ID, 主题ID, 时间ID, 邮件长度, 是否包含附件]
维度表:
-
[发件人ID, 发件人姓名, 发件人邮箱, 发件人组织]
-
[收件人ID, 收件人姓名, 收件人邮箱, 收件人组织]
-
[主题ID, 主题名称, 主题关键词]
-
[时间ID, 时间戳,日, 星期, 月,年]
(b) Suppose you have roughly classified a set of your previous e-mail messages as junk, unimportant, normal, or important. Describe how a data mining system may take this as the training set to automatically classify new e-mail messages or unclassified ones. (10 points)
第 5 题
5、Given a transaction database below, let min_support = 30% and min_confidence = 70%.
| Transaction ID | Items Bought |
| 1 | {a, b, d} |
| 2 | {b, c, d} |
| 3 | {a, b, d} |
| 4 | {a, b, c, d} |
| 5 | {b, c, d} |
| 6 | {b, d} |
| 7 | {c, d} |
| 8 | {a, b, c} |
| 9 | {a, d} |
| 10 | {b, d} |
Find all frequent itemsets using FP-growth method. Write up the conditional pattern base for each item, and the conditional FP-tree for each item. (15 points)
解:这题与第一套试卷 b 小题相似,这里给出快速的过程。
FP-tree:
-
项 c 的条件模式基:{d, b, a},{d}, {b, a},{b, d}
计算 c 的条件模式基中各项的支持度, a:2,b:4,d:4, a 小于最小支持度所以删去,保留 b,d,所以频繁项集为:
频繁 2 项集:{b, c} {c, d}
频繁 3 项集:{b, d, c}
-
项 a 的条件模式基:{d, b},{d},{b}
计算 a 的条件模式基中各项的支持度,b:4,d:4,都大于最小支持度次数 3,都保留,所以频繁项集为:
频繁 2 项集:{a, b},{a, d}
频繁 3 项集:{a, b, d}
-
项 b 的条件模式基:{d}
计算 b 的条件模式基中各项的支持度, d:7,都大于最小支持度次数 3,都保留,所以频繁项集为:
频繁 2 项集:{b, d}
-
项 d 的条件模式基:项 d 是支持度最高的项,无需进一步挖掘。
综上,汇总所有频繁项集为:
-
频繁 1 项集:
-
{a},{b},{c},{d}
-
-
频繁 2 项集:
-
{a, b},{a, d},{b, d},{b, c},{c, d}
-
-
频繁 3 项集:
-
{a, b, d},{b, d, c}
-
第 6 题
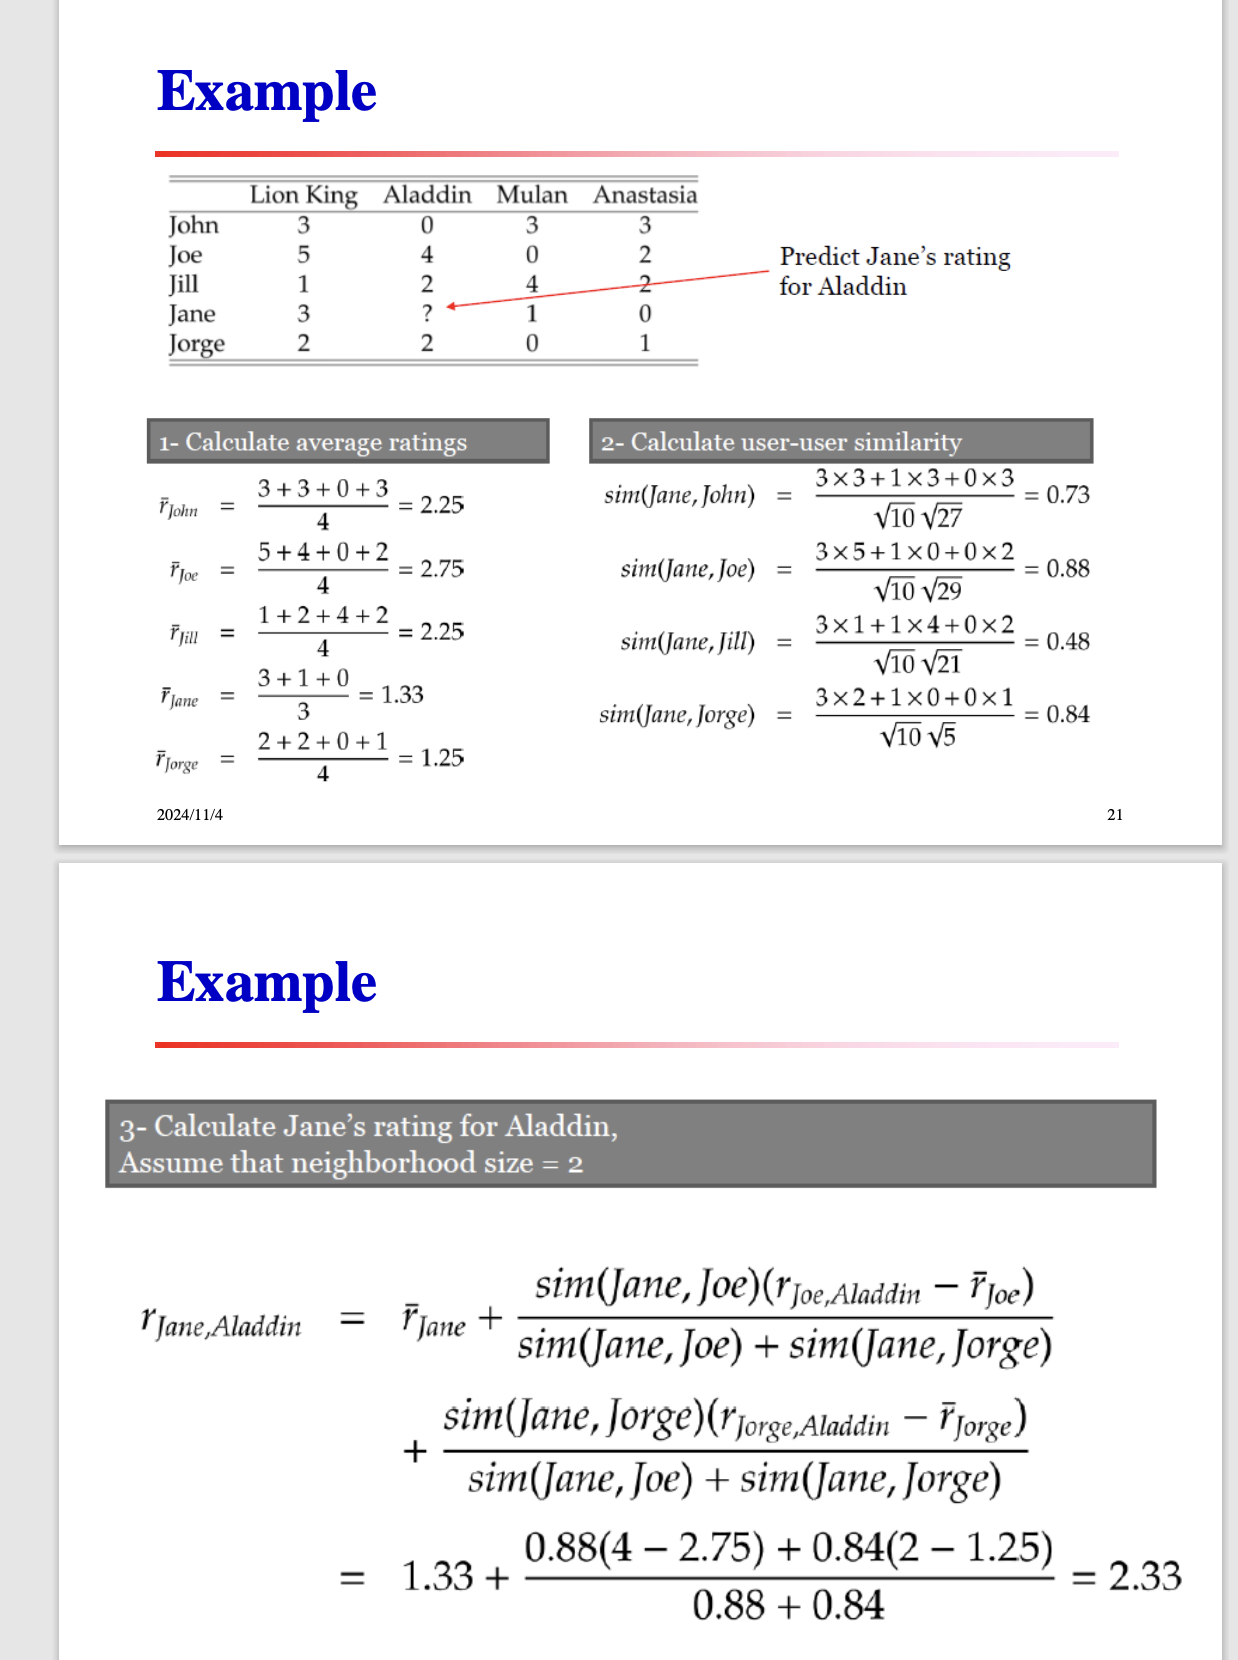
6、Table 1 gives a User-Product rating matrix.
Table 1: User-Product Rating Matrix
| User | Product 1 | Product 2 | Product 3 | Product 4 |
| User 1 | 1 | 1 | 5 | 3 |
| User 2 | 3 | ? | 5 | 4 |
| User 3 | 1 | 3 | 1 | 1 |
| User 4 | 4 | 3 | 2 | 1 |
| User 5 | 2 | 2 | 2 | 4 |
(a) List the top 2 most similar users of user 2 based on Euclidean Distance. (5 points)
(b) Predict User 2’s rating for Product 2. (5 points)
解:本题与第三套试卷的第 5 题相似
(a) List the top 2 most similar users of user 2 based on Euclidean Distance.
根据欧几里得公式:
计算 User 1 和 User 2 的距离:
计算 User 3 和 User 2 的距离:
计算 User 4 和 User 2 的距离:
计算 User 5 和 User 2 的距离:
因此与 User 2 最相似的两个用户是 User 1 和 User 5。
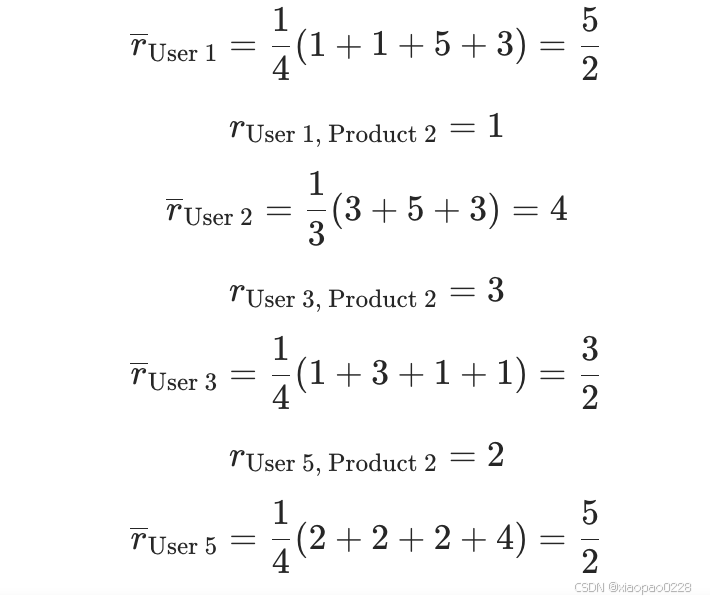
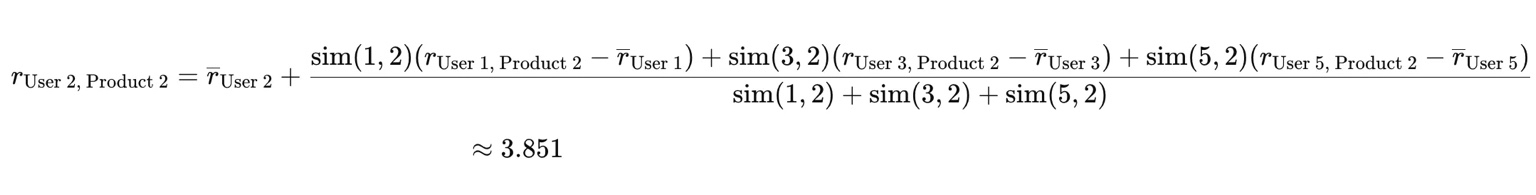
(b) Predict User 2’s rating for Product 2.
基于 User 2 最相似的两个用户(User1 和 User 5)的评分,使用加权平均法预测 User 2 对 Product 2 的评分。权重可以设置为距离的倒数,距离越近,权重越大。
-
User 1 的权重:
-
User 5 的权重:
预测评分:
新增题
上面是基于欧拉公式计算的,还有是基于余弦计算的。
例题:Table 2 gives a User-Product rating matrix.
Table 2. User-Product Rating Matrix
| Product 1 | Product 2 | Product 3 | Product 4 | |
| User 1 | 1 | 1 | 5 | 3 |
| User 2 | 3 | ? | 5 | 4 |
| User 3 | 1 | 3 | 1 | 1 |
| User 4 | 4 | 3 | 2 | 1 |
| User 5 | 2 | 2 | 2 | 4 |
(a) List the top 3 most similar users of user 2 based on Cosine Similarity.
(b) Predict User 2’s rating for Product 2.
解:
(a) List the top 3 most similar users of user 2 based on Cosine Similarity.
计算用户2与其他用户的余弦相似度,由于 user 2 的数据缺失,所以计算时只考虑用户2和其他用户共同评分的项目。余弦相似度的公式如下:
计算 user 2 与 user 1 的相似度:
-
共同评分的产品: product 1、product 3、product 4
-
user 2 的评分向量: [3, 5, 4]
-
user 1 的评分向量: [1, 5, 3]
根据公式计算相似度:
计算 user 2 与 user 3 的相似度:
-
共同评分的产品: product 1、product 3、product 4
-
user 2 的评分向量: [3, 5, 4]
-
user 3 的评分向量: [1, 1, 1]
根据公式计算相似度:
计算 user 2 与 user 4 的相似度:
-
共同评分的产品: product 1、product 3、product 4
-
user 2 的评分向量: [3, 5, 4]
-
user 4 的评分向量: [4, 2, 1]
根据公式计算相似度:
计算 user 2 与 user 5 的相似度:
-
共同评分的产品: product 1、product 3、product 4
-
user 2 的评分向量: [3, 5, 4]
-
user 5 的评分向量: [2, 2, 4]
根据公式计算相似度:
综上,与 user 2 最相似的前 3 位用户是:
-
用户3(相似度约为 0.98)
-
用户1(相似度约为 0.955)
-
用户5(相似度约为 0.923)
(b) Predict User 2’s rating for Product 2.
使用与 User 2 最相似的三个 User 预测 User 2 的 Product 2。
第 7 题
7、Suppose that a large store has a database that is distributed among n locations. Records in each component database have the same format, namely , where
is a record identifier, and
indicates an attribute.
Propose an efficient algorithm to discover K clusters by using K-Means algorithm in the distributed environment. Present your algorithm in pseudo code. Your algorithm should not require shipping all of the data to one site and should not cause excessive network communication overhead. (16 points)
解:本题与第一套试卷第 6 题相似,都是自己设计算法。
-
初始化
在中央节点随机初始化 K个聚类中心。将这些初始聚类中心广播到所有分布式节点。
-
循环迭代
-
局部分配: 每个位置根据当前聚类中心,将本地数据分配到最近的聚类中心(即为每条记录找到所属的簇)。
-
局部更新: 每个位置基于数据分配结果,计算每个簇的数据和和数据量。
-
全局聚合: 将所有位置的局部统计结果(sum 和 count)汇总到中央节点,计算新的聚类中心。
-
广播新聚类中心: 将更新后的聚类中心广播回所有位置,进入下一次迭代
-
-
收敛判断:若聚类中心在连续两次迭代中变化较小(即达到预设阈值),或达到最大迭代次数,则算法停止。
第三套试卷
第 1 题
1、航空公司希望能够分析在其服务中的常客的旅行趋势,这样可以为公司正确定位航空市场中的常客市场。公司希望能够跟踪不同航线上旅客的季节变化情况和增长,并跟踪在不同航班上所消费的食品和饮料情况,这样可以帮助航空公司安排不同航线上航班和食品供应。请面向航空公司的任务,设计一个数据仓库的模型。(12 points)
解:
旅行事实表:
[ 旅客 ID、航线 ID、食品饮料 ID、时间 ID、食品饮料消费数量、食品饮料消费额度 ]
维度表:
旅客 [lD、身份证号、姓名、年龄、性别 、会员等级 ]
航线 [ID、航班号、出发机场、到达机场、飞行时间]
食品饮料 [ID、名称、数量、 类别 ]
时间 [ID、日期、周、月、季节、年 ]

第 2 题
2、Suppose that the data for analysis includes the attribute age:
20, 13, 15, 16, 25, 35, 36, 40, 45, 46, 52, 25, 25, 30, 21, 22, 22, 33, 33, 35, 35, 70, 19, 20.
(a) Use smoothing by bin means to smooth the above data, using a bin depth of 6. (6 points)
(b) Determine outliers in the data by five-number summary? (4 points)
(c) Use min-max normalization to normalize 33. (4 points)
解:
(a) Use smoothing by bin means to smooth the above data, using a bin depth of 6.
排序后的结果:
13 15 16 19 20 20 21 22 22 25 25 25 30 33 33 35 35 35 36 40 45 46 52 70
深度为 6,分为 4 个bin:
-
bin1:13 15 16 19 20 20 均值 17
-
bin2:21 22 22 25 25 25 均值 23
-
bin3:30 33 33 35 35 35 均值 34
-
bin4:36 40 45 46 52 70 均值 48
按均值平滑
-
bin1:17 17 17 17 17 17
-
bin2:23 23 23 23 23 23
-
bin3:34 34 34 34 34 34
-
bin4:48 48 48 48 48 48
(b) Determine outliers in the data by five-number summary?
- 中位数:
-
第一四分位数 (Q1):
-
第三四分位数 (Q3):
-
四分位距 (IQR):
离群点上下界计算:
- 下界:
-
上界:
- 所以离群点值: 70
去除离群点的最小值为 13,最大值为 52。
(c) Use min-max normalization to normalize 33.
第 3 题
3、Question
(a) What is overfitting ?(4 points)
(b) How to overcome overfitting in decision tree ?(4 points)
(c) Please present an attribute selection method in decision tree. (4 points)
(d) A neural network classifier may consist of multiple hidden layers. How to overcome overfitting in a neural network classifier? (6 points)
解:
(a) What is overfitting ?
过拟合是指机器学习模型在训练数据上表现良好,但在新数据上表现较差的现象。这是因为模型过于复杂,过度拟合了训练数据,包括其中的噪声和异常模式,导致缺乏对未知数据的泛化能力。
(b) How to overcome overfitting in decision tree ?
- 剪枝(Pruning):
-
- 前剪枝:在树生成过程中通过设定条件(如最大深度、节点最小样本数)提前停止树的生长。可以限制决策树的复杂度,避免拟合训练数据中的噪声。
- 后剪枝:先生成完整的决策树,然后从底部开始修剪不显著的分支,合并那些对预测效果影响较小的节点。后剪枝可以在保留重要分支的同时去除多余的细节。
- 设置最大深度:限制树的最大深度可以有效控制模型复杂度,防止模型过度拟合数据,因为较浅的树结构更具泛化能力。
- 设置最小样本分割数:限制每个节点的最小样本数,以避免树过度划分数据。
- 集成方法:如随机森林,通过多个决策树投票减少单棵树的过拟合风险。
- 数据增强和交叉验证:增加训练数据量、利用数据增强技术或通过交叉验证来评估模型在不同数据子集上的表现,可以帮助决策树识别更具代表性的特征,从而减少对训练数据的过拟合。
(c) Please present an attribute selection method in decision tree.
一种常用的属性选择方法是信息增益(Information Gain):
- 熵(Entropy):衡量数据集的不确定性或纯度。熵越低,数据越纯。
其中, 是类别
的样本所占的比例。
- 信息增益:表示在某属性 A 上对数据集 S 进行划分后,信息不确定性的减少量。
其中, 是属性
取值为
的子集。
- 属性选择:选择信息增益最大的属性进行划分,因为它能最大程度地提高数据集的纯度。
其他属性选择方法还包括:
- 基尼指数(Gini Index):用于衡量数据集的不纯度,常用于CART算法。
- 增益率(Gain Ratio):对信息增益进行规范化,避免偏向取值较多的属性。
(d) A neural network classifier may consist of multiple hidden layers. How to overcome overfitting in a neural network classifier?
为防止神经网络的过拟合,可以采用以下策略:
- 正则化:
L1和L2正则化:在损失函数中添加权重的L1或L2范数,限制模型的复杂度,防止权重过大。
- Dropout:
随机失活:在训练过程中,以一定概率随机忽略部分神经元,减少神经元间的共适应性,提高模型的泛化能力。
- 早停法(Early Stopping):
在训练过程中监控验证集的误差,当误差不再下降或开始上升时,停止训练,避免过拟合。
- 数据增强(Data Augmentation):
通过对训练数据进行旋转、缩放、平移等变换,增加数据的多样性,提高模型的泛化能力。
- 批归一化(Batch Normalization):
对每一层的输入进行标准化,稳定训练过程,加速收敛,同时有助于防止过拟合。
- 减少模型复杂度:
适当减少隐藏层的数量或每层的神经元数量,降低模型的复杂度。
- 使用交叉验证:
利用交叉验证来评估模型的性能,根据验证结果调整超参数。
第 4 题
4、Given a transaction database below, let min support = 50% and min_ confidence = 70%:
| TID | Items-bought |
| T1 | {a, b, e} |
| T2 | {a, b, c, e} |
| T3 | {a, b, d, e} |
| T4 | {a, c, d, e} |
| T5 | {b, c, e} |
| T6 | {b, d, e} |
| T7 | {c, d} |
| T8 | {a, b, c} |
| T9 | {a, b, e} |
| T10 | {a, b, e} |
(a) Find all the frequent itemsets using FP-growth method. Write up the conditional pattern base for each item, and the conditional FP-tree for each item. (10 points)
(b) Using the resulting frequent itemsets, find all the strong associations in the following rule form: For any transaction x, buys(x, item]) ^ buys(x, item2) → buys(x, item3) [s=?%, c=?%]. (5 points)
解:这题与第一套试卷第 2 题一样,就不再给出过程。
第 5 题
5、Suppose you are given the following ratings by students on four different items, where ? indicates that no rating was given:
| Student ID | item 1 | item 2 | item 3 | item 4 | item 5 |
| 1 | 3 | ? | 1 | 2 | ? |
| 2 | 1 | 2 | 4 | 3 | 2 |
| 3 | 3 | 3 | 1 | 5 | 4 |
| 4 | 2 | 1 | 3 | 4 | 1 |
(a) List the top 2 most similar students of student 1 based on Euclidean Distance. (6 points)
(b) Assuming we only recommend the top 1 item to student 1, which item would you recommend, item 2 or item 5? (Assume similarity = 1/distance). (8 points)
解:本题与第二套试卷的第 6 题相似
(a) List the top 2 most similar students of student 1 based on Euclidean Distance.
根据欧几里得公式:
计算 Student 1 和 Student 2 的距离:
计算 Student 1 和 Student 3 的距离:
计算 Student 1 和 Student 4 的距离:
因此与 Student 1 最相似的两个用户是 Student 3 和 Student 4。
(b) Assuming we only recommend the top 1 item to student 1, which item would you recommend, item 2 or item 5? (Assume similarity = 1/distance).
与 Student 1 最相似的两个用户(Student 3 和 Student 4)的评分,使用加权平均法预测 Student 1 对 Item 2 和 Item 5 的评分。权重可以设置为距离的倒数,距离越近,权重越大。
Student 3 的权重:
Student 4 的权重:
预测评分:
由于 Item 5 的评分较高,因此会选择 Item 5。
第 6 题
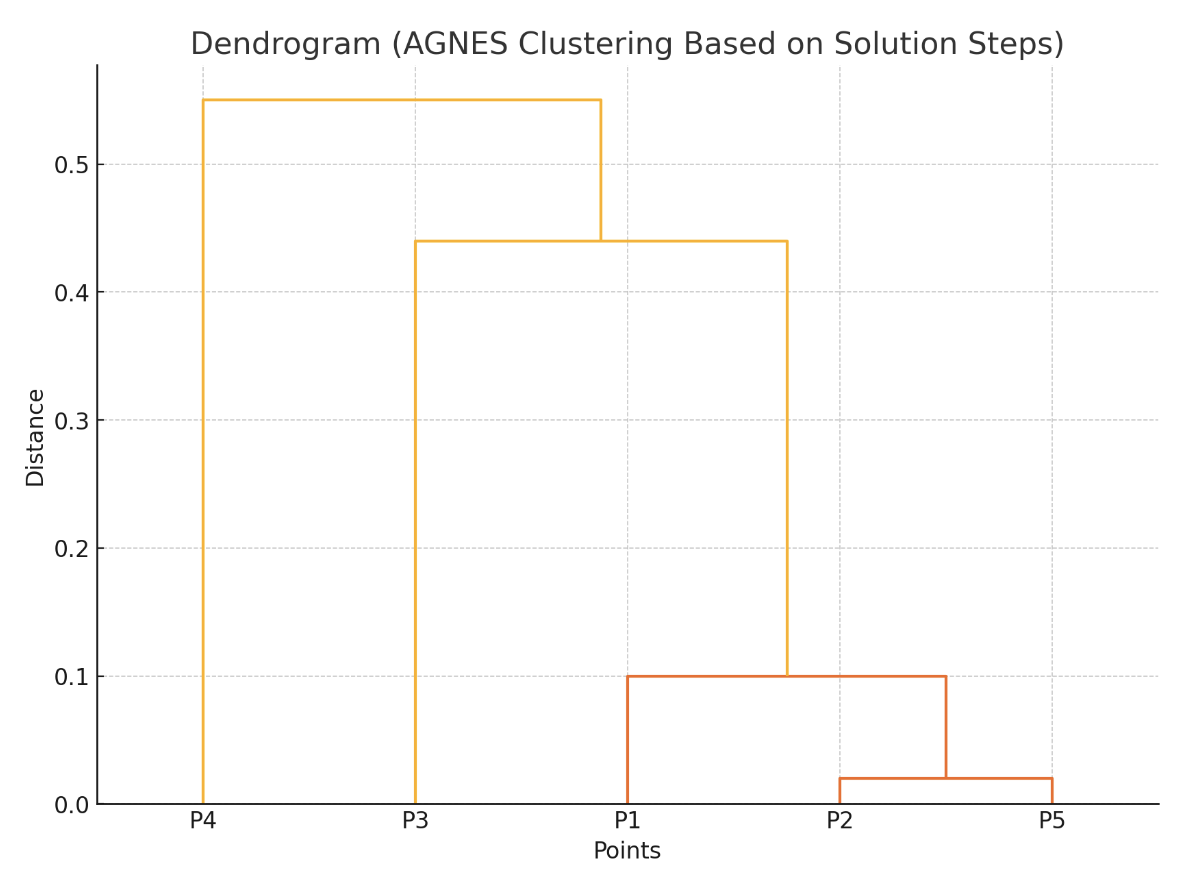
6、Use the following similarity matrix to perform AGNES clustering. Show your results by drawing a dendrogram (树状图). The dendrogram should clearly show the order in which the points are merged. (12 points) (The number indicates the similarity between the two points)
| P1 | P2 | P3 | P4 | P5 | |
| P1 | 1.00 | 0.10 | 0.41 | 0.55 | 0.35 |
| P2 | 1.00 | 0.64 | 0.47 | 0.98 | |
| P3 | 1.00 | 0.44 | 0.85 | ||
| P4 | 1.00 | 0.76 | |||
| P5 | 1.00 |
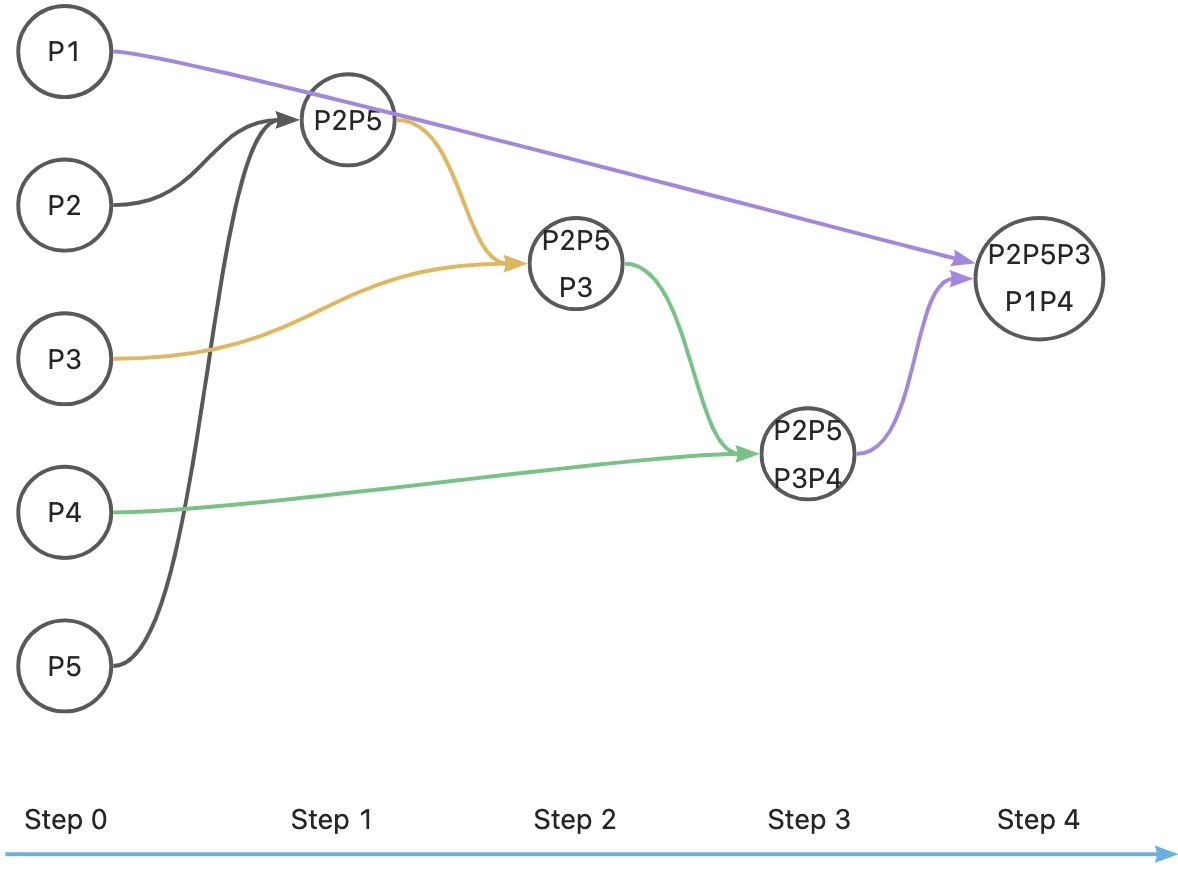
解:
第一步:合并 P2 和 P5
相似度最高的两个点是 P2 和 P5,相似度为 0.98。我们首先将 P2 和 P5 合并为一个簇 P2P5。
计算新的簇 P2P5 与其他点的相似度(使用单链、全链或平均链)。假设我们使用单链法(最小距离,即最大相似度),则有以下新相似度:
- P2P5 与 P1: max(0.10, 0.35) = 0.35
- P2P5 与 P3: max(0.64, 0.85) = 0.85
- P2P5 与 P4: max(0.47, 0.76) = 0.76
| P1 | P2P5 | P3 | P4 | |
| P1 | 1.00 | 0.35 | 0.41 | 0.55 |
| P2P5 | 1.00 | 0.85 | 0.76 | |
| P3 | 1.00 | 0.44 | ||
| P4 | 1.00 |
相似度最高的两个点是 P2P5 和 P3,相似度为 0.85。所以将 P3 和 P2P5 合并为一个簇 P2P5P3。
第二步:合并 P2P5 和 P3
将 P2P5 与 P3 合并为一个新的簇 P2P5P3。
- P2P5P3 与 P1: max(0.35 , 0.41) = 0.41
- P2P5P3 与 P4: max(0.76, 0.44) = 0.76
| P1 | P2P5P3 | P4 | |
| P1 | 1.00 | 0.41 | 0.55 |
| P2P5P3 | 1.00 | 0.76 | |
| P4 | 1.00 |
相似度最高的两个点是 P2P5P3 和 P4,相似度为 0.76。所以将 P2P5P3 和 P4 合并为一个新的簇 P2P5P3P4 。
第三步:合并 P2P5P3 和 P4
P1 与 P2P5P3P4 : max(0.55, 0.41) = 0.55
| P1 | P2P5P3P4 | |
| P1 | 1.00 | 0.55 |
| P2P5P3P4 | 1.00 |
最后合并 P1 与 P2P5P3P4,树状图如下:
这个图纵坐标是 Distance,他是由 得出的。


 2591
2591

 被折叠的 条评论
为什么被折叠?
被折叠的 条评论
为什么被折叠?
 到【灌水乐园】发言


