


1.画图脚本结构
如果画好一个理想中图表,需要以下四个部分的参数进行整合:
图表函数+数据+全局配置(标题、图纸大小、横纵坐标、工具栏等)+系列配置(图表线条、填充颜色、标签等)
但是如果你要画一个简单的图表,仅用图表函数+数据两部分即可搞定:
例如简单的柱形图:
pyecharts模块配置选项
全局配置选项
系列配置选项
学习官网,画廊:Document
from pyecharts.charts import Line
from pyecharts.options import TitleOpts,LegendOpts,ToolboxOpts,VisualMapOpts
#得到折线图对象
line=Line()
#添加x轴数据
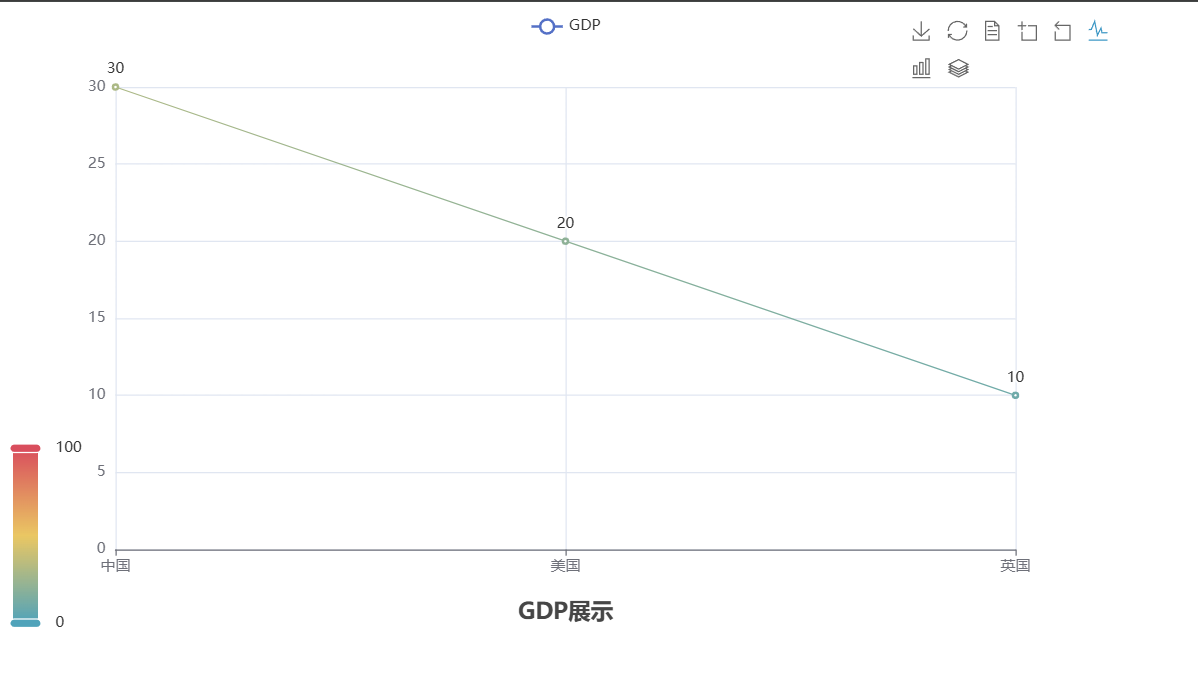
line.add_xaxis(["中国","美国","英国"])
#添加y轴数据
line.add_yaxis("GDP",[30,20,10])
#设置全局配置项
line.set_global_opts(
#配置标题
title_opts=TitleOpts(title="GDP展示",pos_left="center",pos_bottom="1%"),
#图例
legend_opts=LegendOpts(is_show=True),
#工具箱
toolbox_opts=ToolboxOpts(is_show=True),
#视觉映射
visualmap_opts=VisualMapOpts(is_show=True)
)
#生成图表
line.render()


 被折叠的 条评论
为什么被折叠?
被折叠的 条评论
为什么被折叠?
 到【灌水乐园】发言


