


学习目标:
利用subplot2grid()函数修改下列代码,使运行效果变为2行4列
import numpy as np
import matplotlib.pyplot as plt

plt.rcParams['font.sans-serif'] = ["SimHei"]

x = [x for x in range(1, 13)]
y1 = [20, 28, 23, 16, 29, 36, 39, 33, 31, 19, 21, 25]
y2 = [17, 22, 39, 26, 35, 23, 25, 27, 29, 38, 28, 20]
labels = ['1 月', '2 月', '3 月', '4 月', '5 月', '6 月', '7月', '8 月', '9 月', '10 月', '11 月', '12 月']

# 绘制第一个子图
ax1 = plt.subplot(211)
ax1.plot(x, y1, 'm--o', lw=2, ms=5, label='产品A')
ax1.plot(x, y2, 'g--o', lw=2, ms=5, label='产品B')
ax1.set_title("产品A 与产品B的销售额", fontsize=11)
ax1.set_ylim(10, 45)
ax1.set_ylabel('销售额(亿元)')
ax1.set_xlabel('月份')
for xy1 in zip(x, y1):
    ax1.annotate("%s" % xy1[1], xy=xy1, xytext=(-5, 5), textcoords='offset points')
for xy2 in zip(x, y2):
    ax1.annotate("%s" % xy2[1], xy=xy2, xytext=(-5, 5), textcoords='offset points')
ax1.legend()

# 绘制第二个子图
ax2 = plt.subplot(223)
ax2.pie(y1, radius=1, wedgeprops={'width':0.5}, labels=labels, autopct='%3.1f%%', pctdistance=0.75)
ax2.set_title('产品A的销售额 ')

# 绘制第三个子图
ax3 = plt.subplot(224)
ax3.pie(y2, radius=1, wedgeprops={'width':0.5}, labels=labels,autopct='%3.1f%%', pctdistance=0.75)
ax3.set_title('产品B的销售额 ')

# 调整子图之间的距离
plt.tight_layout()
plt.show()
使用pyplot中的subplot2grid()函数可以将真个画布规划成非等分布局的区域,语法格式如下:
subplot2grid(shape, loc, rowspan=1, colspan=1, fig=None, **kwargs详细参数可以参考官方文档
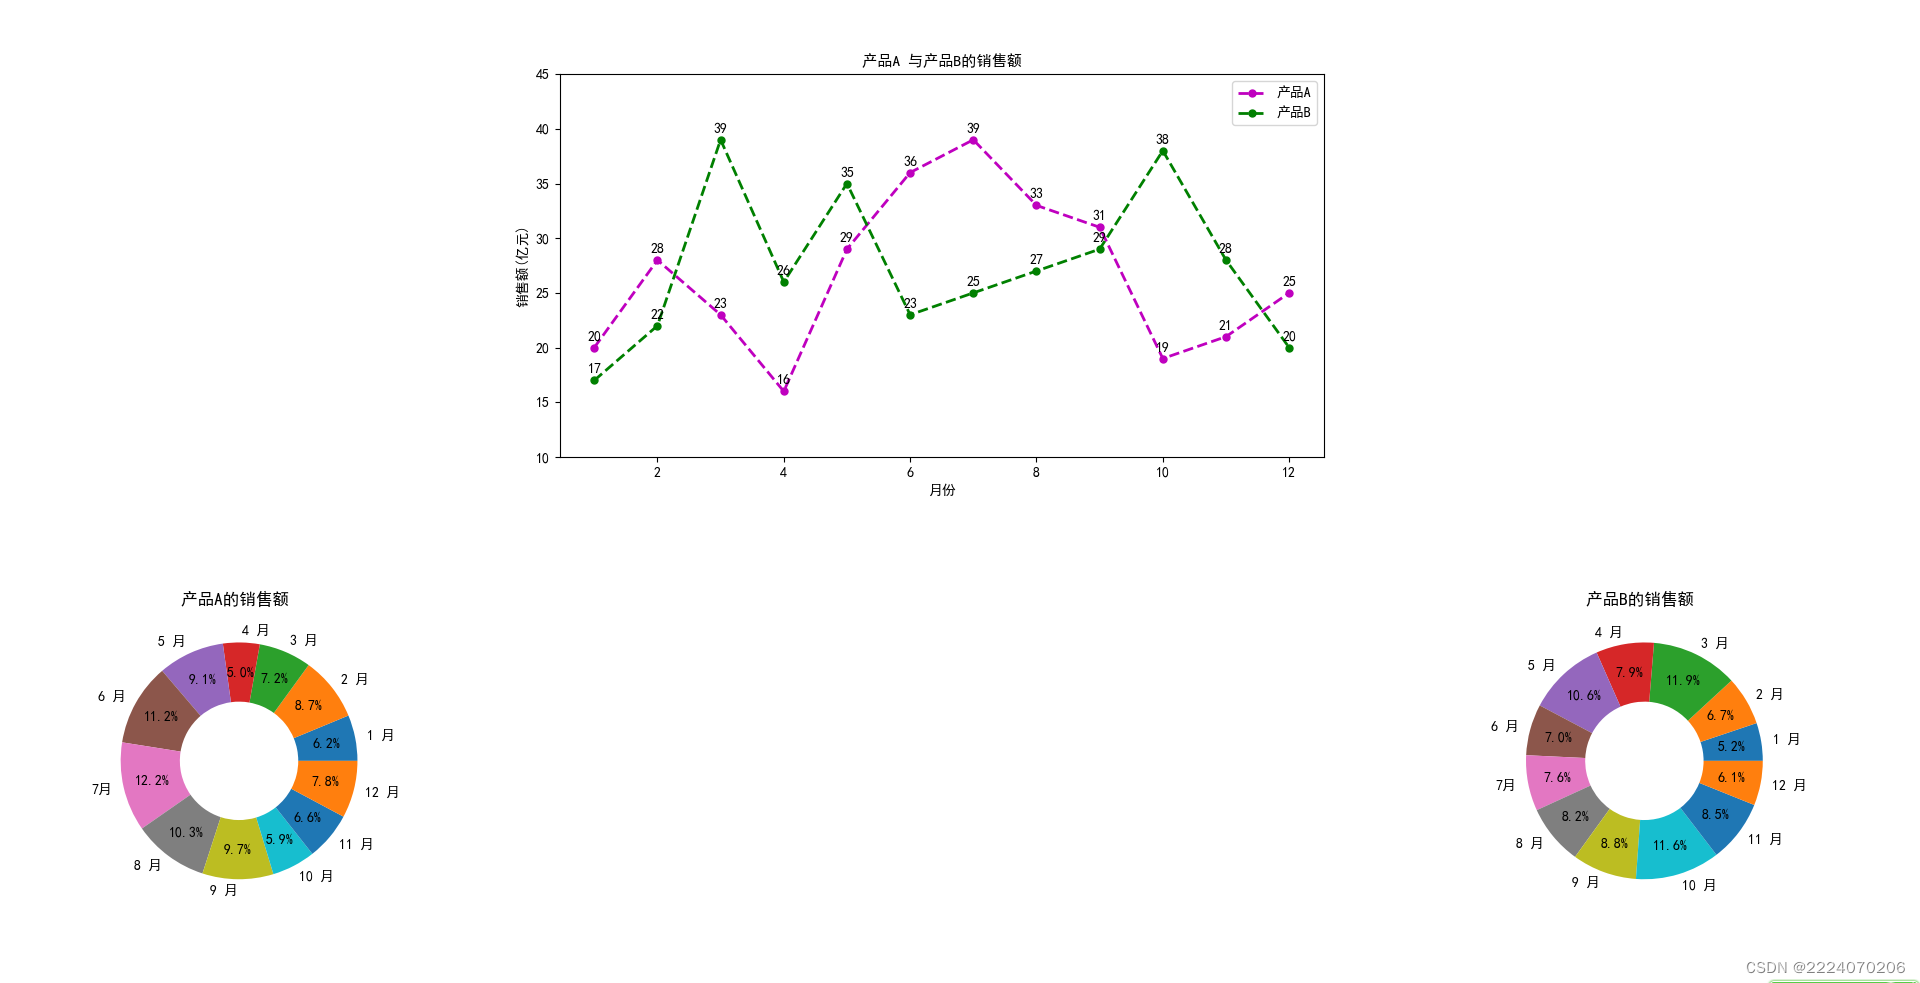
用subplot2grid修改代码后,如图所示
import numpy as np
import matplotlib.pyplot as plt

plt.rcParams['font.sans-serif'] = ["SimHei"]

x = [x for x in range(1, 13)]
y1 = [20, 28, 23, 16, 29, 36, 39, 33, 31, 19, 21, 25]
y2 = [17, 22, 39, 26, 35, 23, 25, 27, 29, 38, 28, 20]
labels = ['1 月', '2 月', '3 月', '4 月', '5 月', '6 月', '7月', '8 月', '9 月', '10 月', '11 月', '12 月']

# 绘制第一个子图
ax1 = plt.subplot2grid((2,4),(0,1),colspan=2)
ax1.plot(x, y1, 'm--o', lw=2, ms=5, label='产品A')
ax1.plot(x, y2, 'g--o', lw=2, ms=5, label='产品B')
ax1.set_title("产品A 与产品B的销售额", fontsize=11)
ax1.set_ylim(10, 45)
ax1.set_ylabel('销售额(亿元)')
ax1.set_xlabel('月份')
for xy1 in zip(x, y1):
    ax1.annotate("%s" % xy1[1], xy=xy1, xytext=(-5, 5), textcoords='offset points')
for xy2 in zip(x, y2):
    ax1.annotate("%s" % xy2[1], xy=xy2, xytext=(-5, 5), textcoords='offset points')
ax1.legend()

# 绘制第二个子图
ax2 = plt.subplot2grid((2,4),(1,0))
ax2.pie(y1, radius=1, wedgeprops={'width':0.5}, labels=labels, autopct='%3.1f%%', pctdistance=0.75)
ax2.set_title('产品A的销售额 ')

# 绘制第三个子图
ax3 = plt.subplot2grid((2,4),(1,3))
ax3.pie(y2, radius=1, wedgeprops={'width':0.5}, labels=labels,autopct='%3.1f%%', pctdistance=0.75)
ax3.set_title('产品B的销售额 ')

# 调整子图之间的距离
plt.tight_layout()
plt.show()
要注意loc行数和列数都是从0开始
运行结果如图所示:
交换机


 被折叠的 条评论
为什么被折叠?
被折叠的 条评论
为什么被折叠?
 到【灌水乐园】发言


