


重点客户的CDA,客户各业务的设定:
年度促销规划与渠道方案的执行与追踪;
import streamlit as st
import pandas as pd
import numpy as np
import plotly.express as px
from datetime import datetime
# 启用缓存避免重复计算
@st.cache_data
def generate_data():
"""生成模拟数据集,包含客户、销售和应收账款数据"""
np.random.seed(42) # 固定随机种子保证数据一致性
# 客户数据生成逻辑
clients = pd.DataFrame({
'客户名称': [f'客户A{i:02d}' for i in range(1, 31)],
'本月销售额': np.random.lognormal(mean=10, sigma=0.3, size=30).astype(int) * 1000,
'合作年限': np.random.randint(1, 6, 30),
'库存金额': np.random.randint(10, 200, 30) * 1000,
'货龄等级': np.random.choice(['新鲜库存<30天', '临期库存30-60天', '滞销库存>60天'], 30, p=[0.6, 0.3, 0.1]),
'满意度': np.round(np.random.uniform(3.5, 5.0, 30), 1),
'区域': np.random.choice(['华东', '华北', '华南', '西南'], 30)
})
# 销售时序数据(添加趋势项)
date_rng = pd.date_range(start='2023-01-01', end='2023-12-31', freq='M')
base_sales = np.linspace(1000000, 1500000, 12) # 基础销售趋势
sales = pd.DataFrame({
'月份': date_rng,
'销售额': (base_sales * np.random.normal(1, 0.1, 12)).astype(int),
'促销金额': np.random.randint(20, 100, 12) * 10000,
'产品线': np.random.choice(['健康食品', '家用器械', '个人护理'], 12)
})
# 应收账款数据生成
receivables = pd.DataFrame({
'客户名称': clients.sample(15, replace=False)['客户名称'].values,
'应收金额': np.random.randint(5, 50, 15) * 10000,
'账期状态': np.random.choice(['未到期', '逾期1-30天', '逾期31-60天', '逾期61天+'], 15),
'超期天数': np.where(np.random.rand(15) > 0.7, np.random.randint(10, 90, 15), 0),
'客户等级': np.random.choice(['VIP客户', '战略客户', '普通客户'], 15)
})
# 计算衍生指标
receivables['已回收金额'] = receivables['应收金额'] * np.random.uniform(0.5, 1.0, 15)
clients['库存周转天数'] = np.random.randint(15, 60, 30)
return clients, sales, receivables
def main_dashboard():
# 页面设置
st.set_page_config(layout="wide", page_icon="📊", page_title="销售运营智能看板")
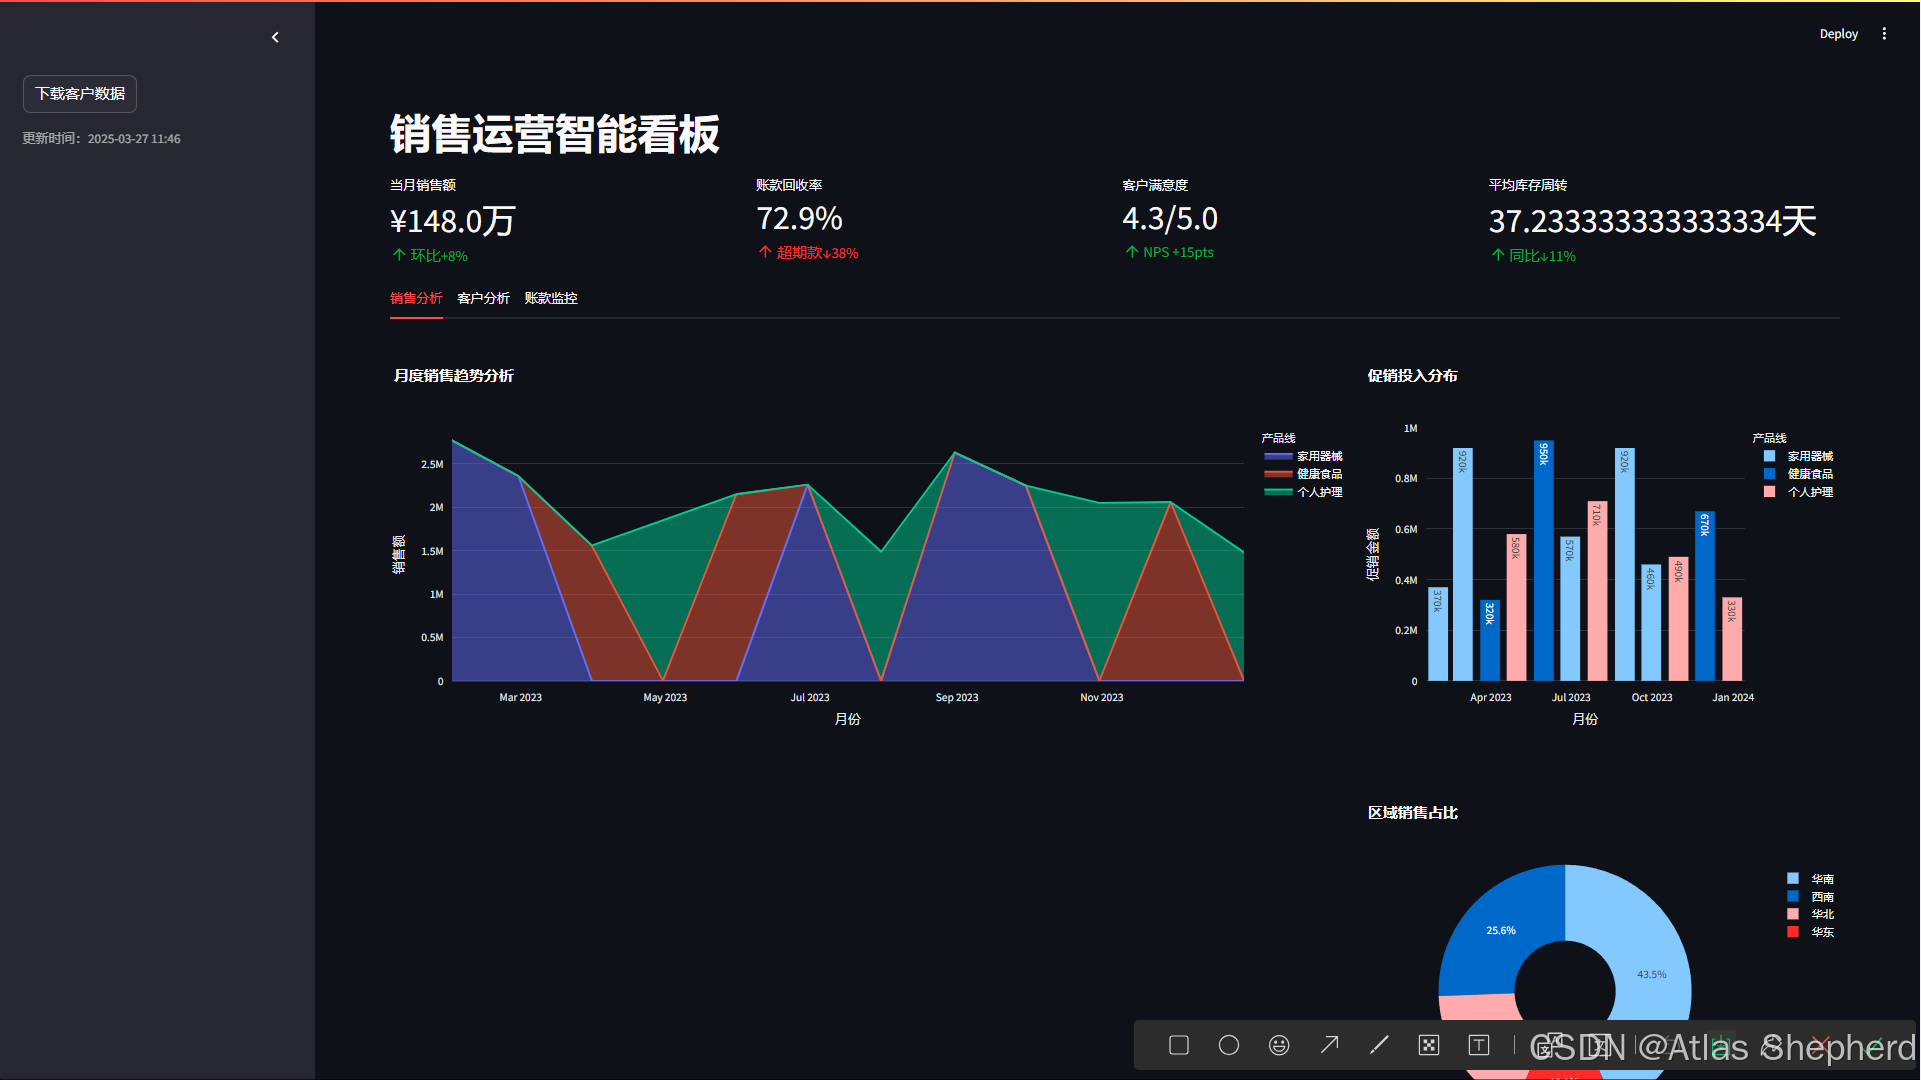
st.title("📈 销售运营智能看板")
# 加载数据
df_clients, df_sales, df_receivables = generate_data()
# ---- 侧边栏控件 ----
with st.sidebar:
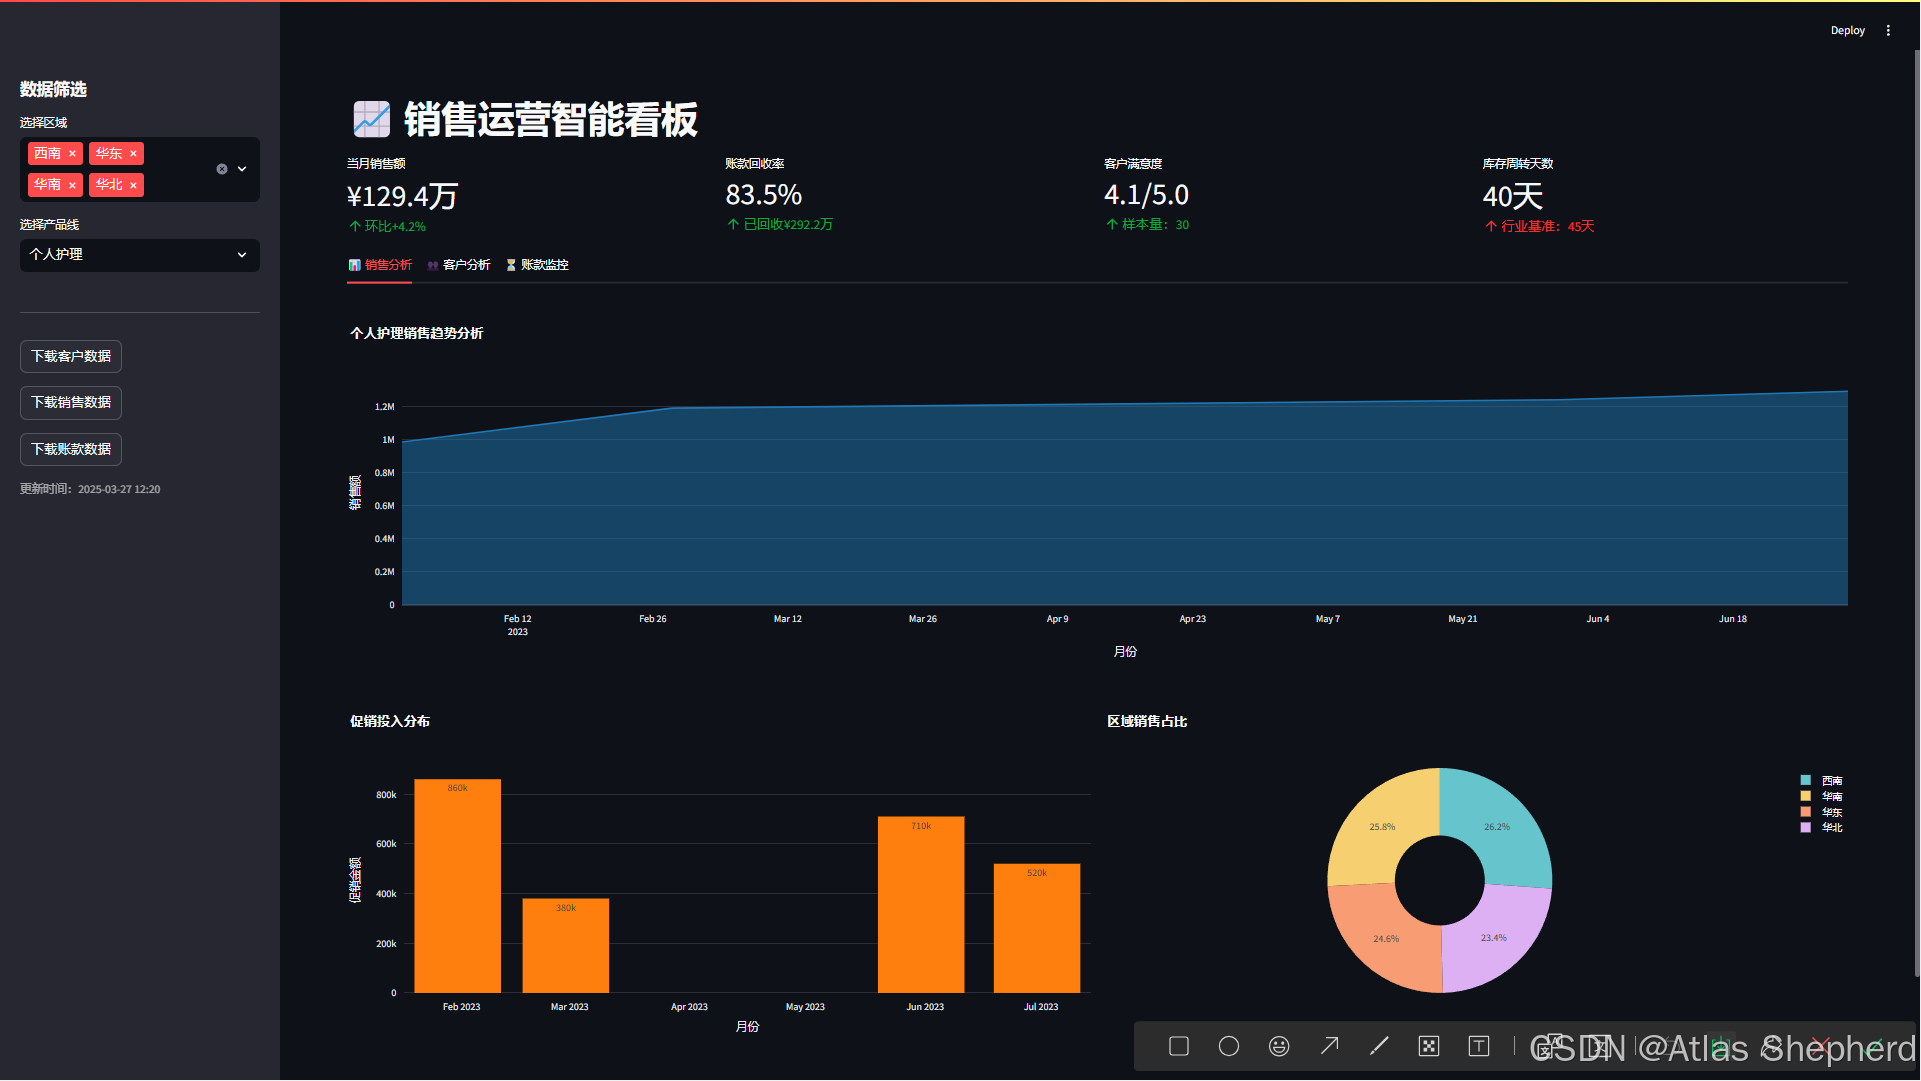
st.header("数据筛选")
selected_region = st.multiselect(
"选择区域",
options=df_clients['区域'].unique(),
default=df_clients['区域'].unique()
)
selected_product = st.selectbox(
"选择产品线",
options=df_sales['产品线'].unique(),
index=0
)
st.divider()
st.download_button("下载客户数据",
df_clients.to_csv(index=False).encode('utf-8'),
"client_data.csv")
st.download_button("下载销售数据",
df_sales.to_csv(index=False).encode('utf-8'),
"sales_data.csv")
st.download_button("下载账款数据",
df_receivables.to_csv(index=False).encode('utf-8'),
"receivables_data.csv")
st.caption(f"更新时间:{datetime.now().strftime('%Y-%m-%d %H:%M')}")
# 数据筛选处理
filtered_clients = df_clients[df_clients['区域'].isin(selected_region)]
filtered_sales = df_sales[df_sales['产品线'] == selected_product]
# ---- 顶部指标卡 ----
col1, col2, col3, col4 = st.columns(4)
with col1:
current_sales = filtered_sales.iloc[-1]['销售额'] if not filtered_sales.empty else 0
prev_sales = filtered_sales.iloc[-2]['销售额'] if len(filtered_sales) > 1 else current_sales
change_pct = ((current_sales - prev_sales) / prev_sales) * 100 if prev_sales != 0 else 0
st.metric("当月销售额", f"¥{current_sales / 10000:.1f}万",
f"环比{change_pct:+.1f}%")
with col2:
recovery_amount = df_receivables['已回收金额'].sum()
total_receivable = df_receivables['应收金额'].sum()
recovery_rate = (recovery_amount / total_receivable) * 100 if total_receivable != 0 else 0
st.metric("账款回收率", f"{recovery_rate:.1f}%",
f"已回收¥{recovery_amount / 10000:.1f}万")
with col3:
avg_satisfaction = filtered_clients['满意度'].mean() if not filtered_clients.empty else 0
st.metric("客户满意度", f"{avg_satisfaction:.1f}/5.0",
f"样本量:{len(filtered_clients)}")
with col4:
avg_turnover = filtered_clients['库存周转天数'].mean() if not filtered_clients.empty else 0
st.metric("库存周转天数", f"{avg_turnover:.0f}天",
"行业基准:45天", delta_color="inverse")
# ---- 主分析区 ----
tab1, tab2, tab3 = st.tabs(["📊 销售分析", "👥 客户分析", "⏳ 账款监控"])
with tab1:
# 销售趋势分析
fig = px.area(filtered_sales, x='月份', y='销售额',
title=f"{selected_product}销售趋势分析",
template="plotly_white",
color_discrete_sequence=['#1f77b4'],
line_group='产品线')
fig.update_layout(hovermode="x unified")
st.plotly_chart(fig, use_container_width=True)
# 促销效果分析
col1, col2 = st.columns(2)
with col1:
fig = px.bar(filtered_sales, x='月份', y='促销金额',
title="促销投入分布",
color_discrete_sequence=['#ff7f0e'],
text_auto='.2s')
st.plotly_chart(fig, use_container_width=True)
with col2:
fig = px.pie(filtered_clients, values='本月销售额',
names='区域', hole=0.4,
title="区域销售占比",
color_discrete_sequence=px.colors.qualitative.Pastel)
st.plotly_chart(fig, use_container_width=True)
with tab2:
# 客户价值分布
col1, col2 = st.columns(2)
with col1:
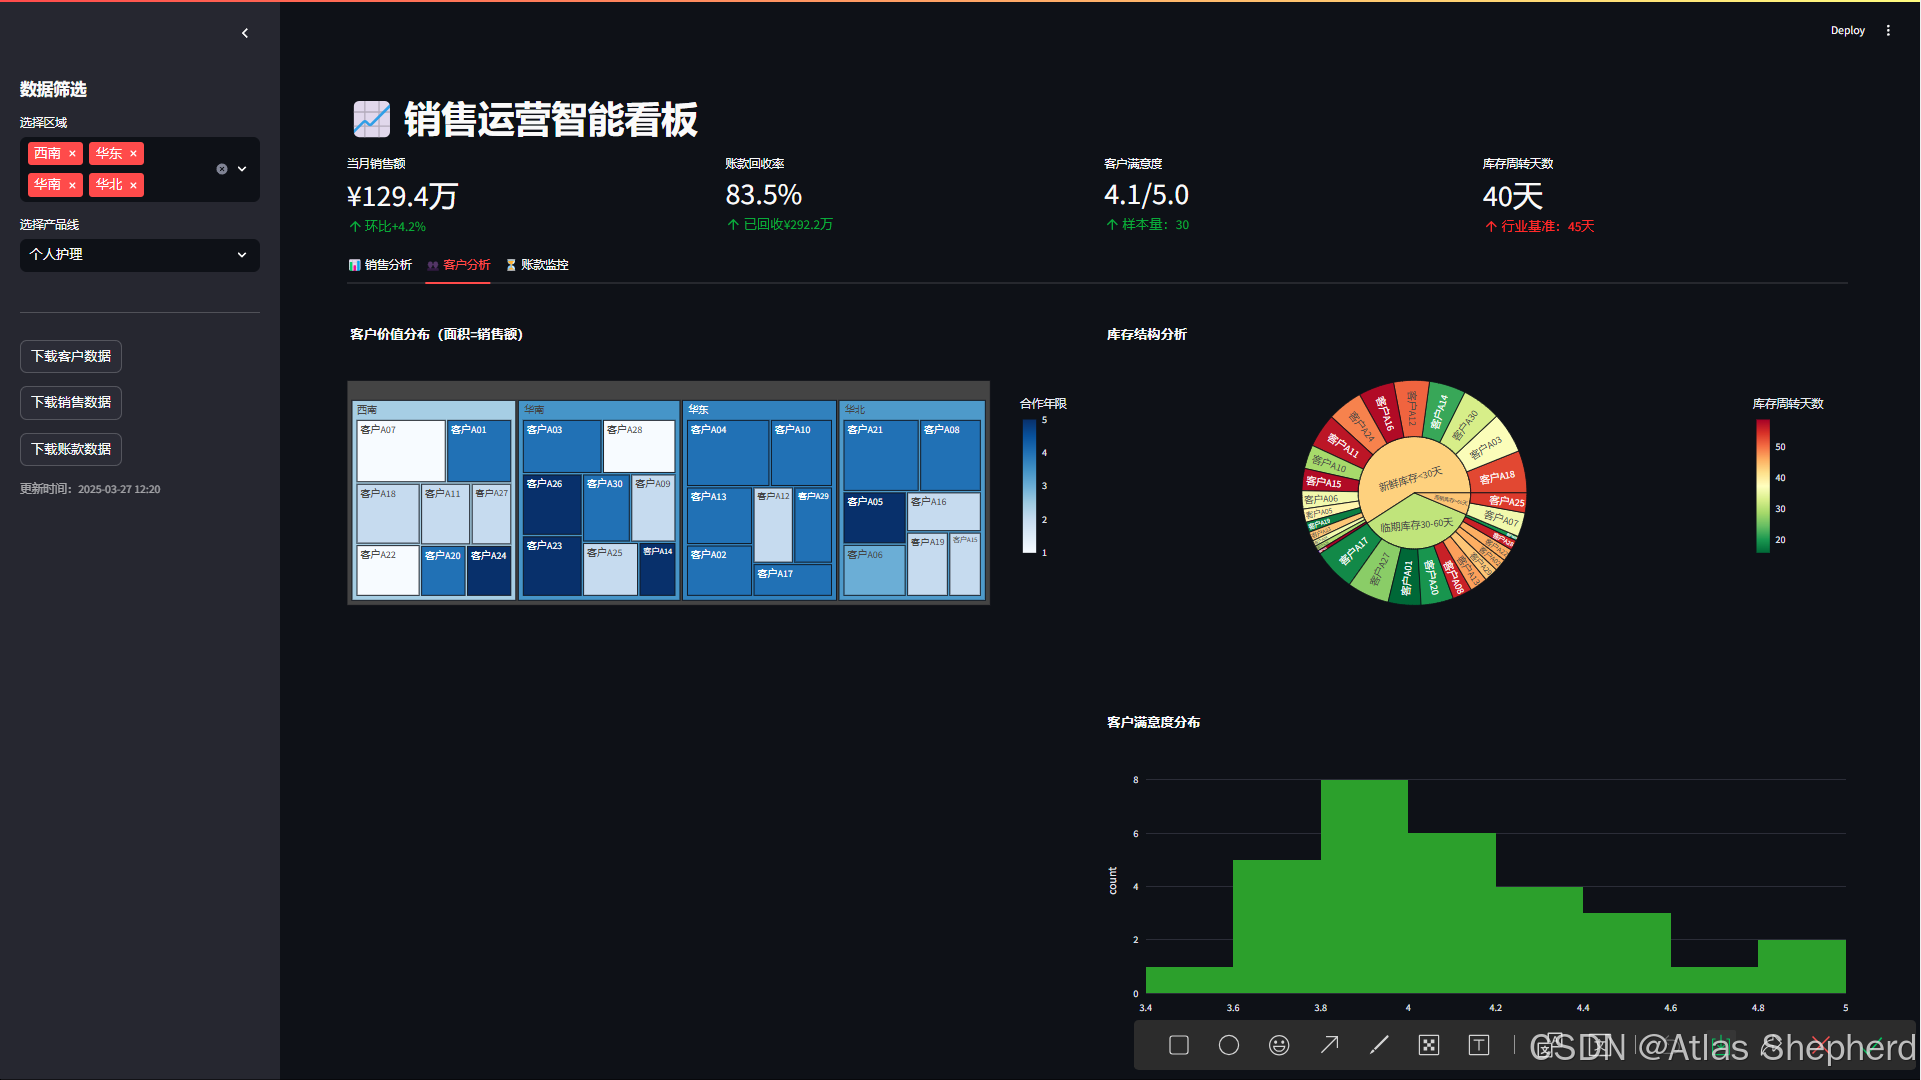
fig = px.treemap(filtered_clients, path=['区域', '客户名称'],
values='本月销售额',
color='合作年限',
title="客户价值分布(面积=销售额)",
color_continuous_scale='Blues')
st.plotly_chart(fig, use_container_width=True)
with col2:
# 库存健康度分析
fig = px.sunburst(filtered_clients, path=['货龄等级', '客户名称'],
values='库存金额',
color='库存周转天数',
title="库存结构分析",
color_continuous_scale='RdYlGn_r')
st.plotly_chart(fig, use_container_width=True)
# 满意度分布
fig = px.histogram(filtered_clients, x='满意度',
nbins=8,
title="客户满意度分布",
color_discrete_sequence=['#2ca02c'])
st.plotly_chart(fig, use_container_width=True)
with tab3:
# 账款状态分析
col1, col2 = st.columns([3, 1])
with col1:
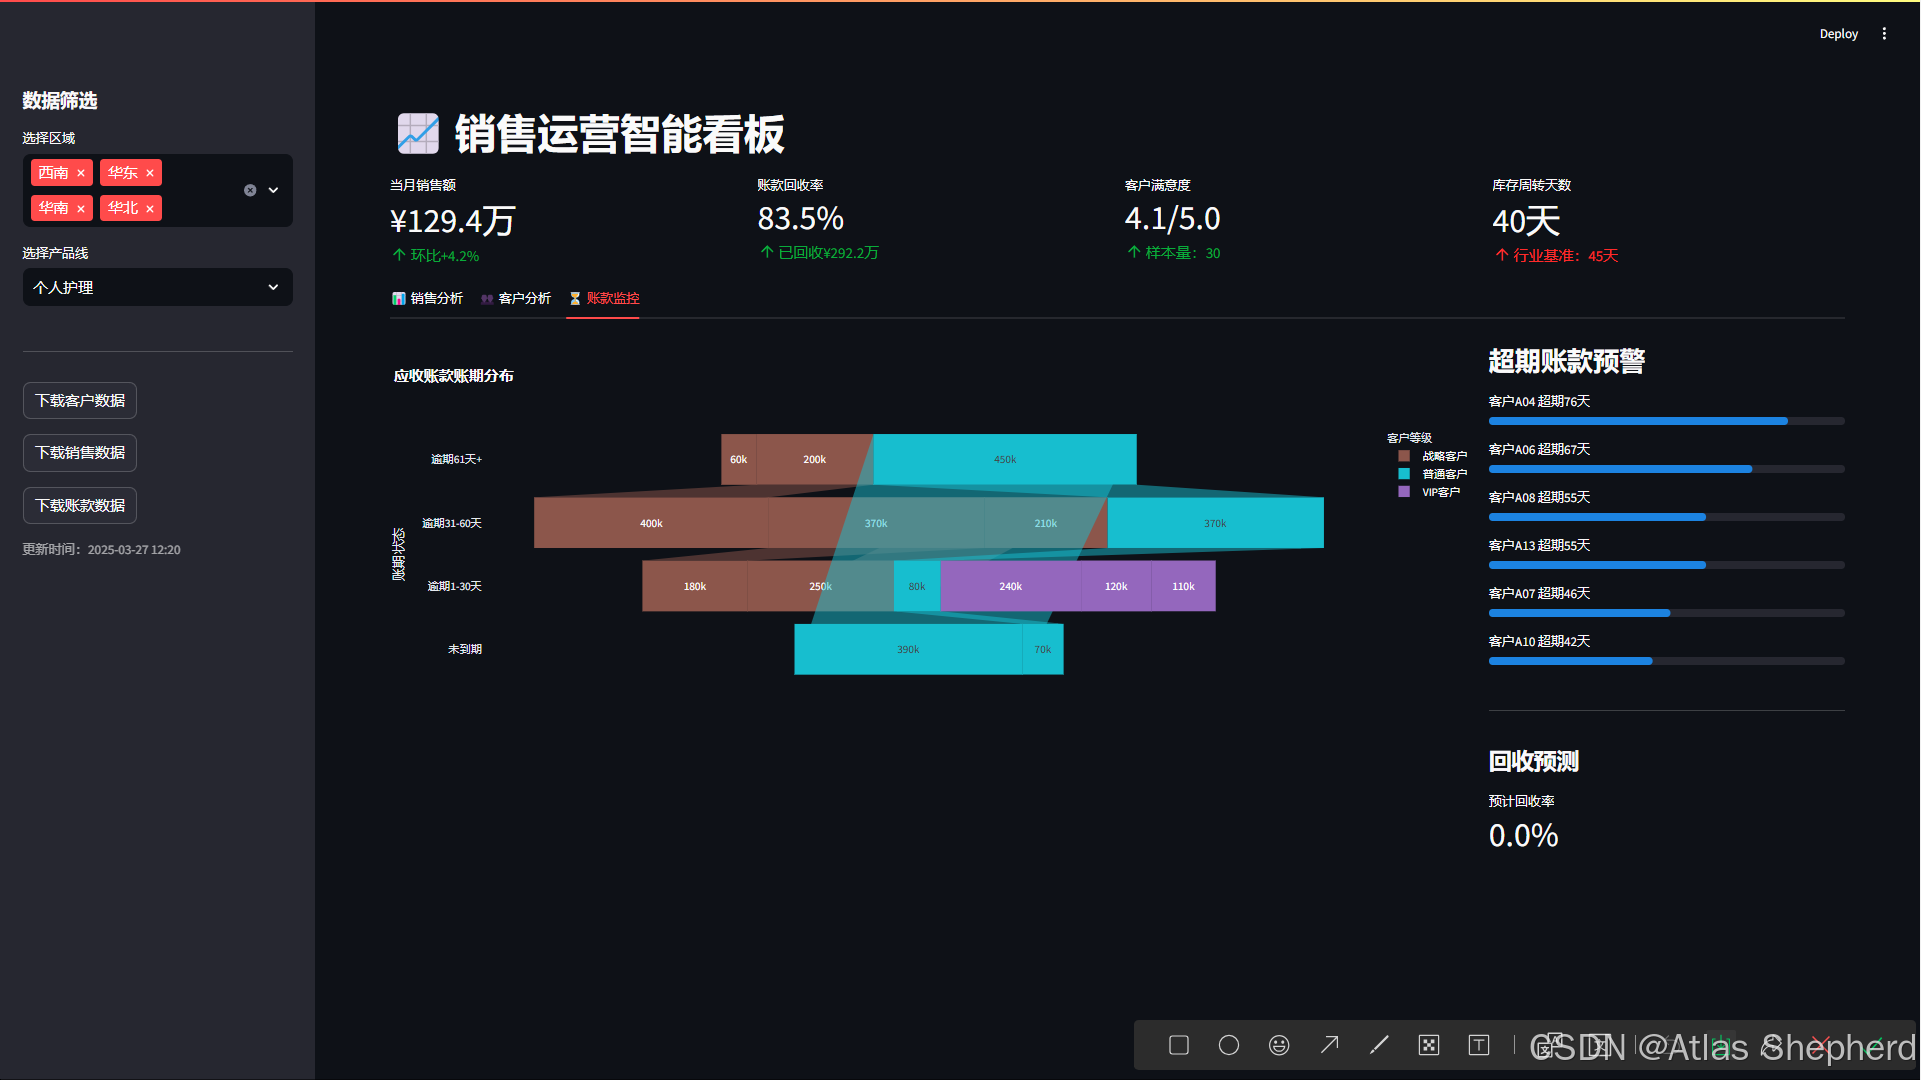
fig = px.funnel(df_receivables, x='应收金额', y='账期状态',
color='客户等级',
title="应收账款账期分布",
color_discrete_map={
'VIP客户': '#9467bd',
'战略客户': '#8c564b',
'普通客户': '#17becf'
})
st.plotly_chart(fig, use_container_width=True)
with col2:
st.subheader("超期账款预警")
overdue = df_receivables[df_receivables['超期天数'] > 0]
if not overdue.empty:
overdue = overdue.sort_values('超期天数', ascending=False)
for idx, row in overdue.iterrows():
progress_value = min(row['超期天数'] / 90, 1.0)
st.progress(progress_value,
f"{row['客户名称']} 超期{row['超期天数']}天")
else:
st.success("✅ 当前无超期账款")
# 添加账款回收预测
st.markdown("---")
st.markdown("#### 回收预测")
days_overdue = overdue['超期天数'].sum()
predicted_recovery = 0.85 ** days_overdue * 100
st.metric("预计回收率", f"{predicted_recovery:.1f}%")
if __name__ == "__main__":
main_dashboard()


 被折叠的 条评论
为什么被折叠?
被折叠的 条评论
为什么被折叠?
 到【灌水乐园】发言


