


2024.12.19
因为不想用visio画图,想偷懒,寻找了三种AIGC流程图方法,众所周知,AI生成文本和代码的能力目前看来比直接生成图片要靠谱的多,于是寻找能够通过代码生成流程图的方式
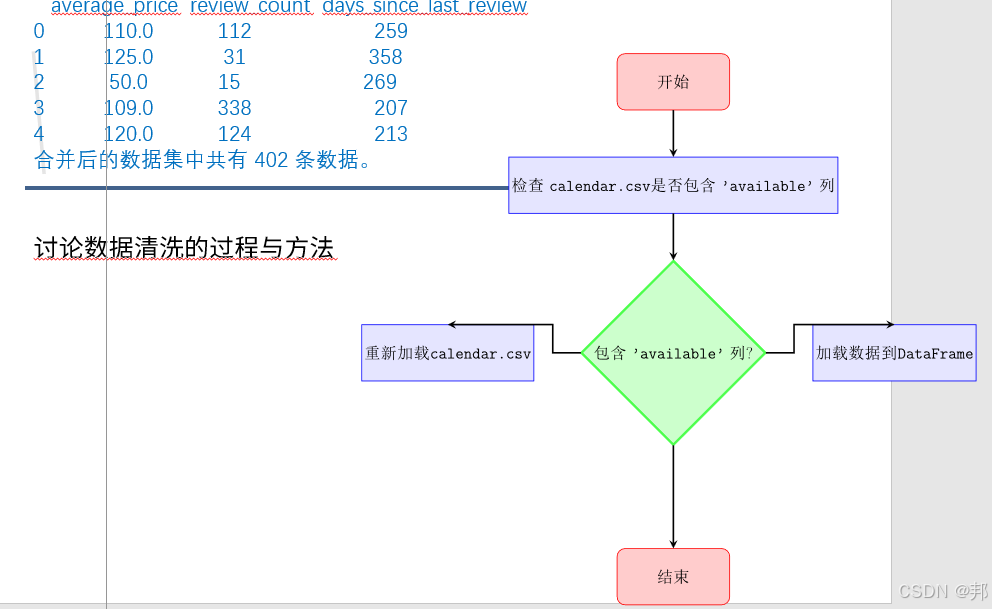
一、Latex TikZ
1、中文图只能用ctexart 文档类,需要手动缩小流程图,不然右边部分超出页面了
2、非中文standalone 文档类(最终放弃),可以自适应画布
3、上限高下限低,可以手动指定箭头方向、位置和颜色
4、导出svg使用pdf2svg 指令为
pdf2svg ch_lct2.pdf ch_lct2.svg 下载链接附下,记得将exe文件所在目录添加到系统路径举个例子
E:\DownLoad\pdf2svg-windows-master\pdf2svg-windows-master\dist-64bits
下面给个例子:
\documentclass[a4paper,12pt]{ctexart}

% 加载宏包
\usepackage{tikz}
\usetikzlibrary{positioning, arrows.meta, shapes.geometric} % 添加 shapes.geometric 库以支持 diamond

% TikZ 样式定义
\tikzstyle{startstop} = [rectangle, rounded corners, draw=red, fill=red!20, text centered, minimum width=6cm, minimum height=3cm, font=\Huge]
\tikzstyle{process} = [rectangle, draw=blue, fill=blue!10, text centered, minimum width=6cm, minimum height=3cm, font=\Huge]
\tikzstyle{decision} = [diamond, draw=green!70, fill=green!20, very thick, text centered, minimum width=7cm, minimum height=4cm, font=\Huge]
\tikzstyle{arrow} = [thick,->,>=stealth]

\begin{document}

\begin{tikzpicture}[node distance=2.5cm, scale=0.33, transform shape] % 使用 scale 缩小图形

% 节点定义
\node (start) [startstop] {开始};
\node (check) [process, below=of start] {检查 \texttt{calendar.csv} \\ 是否包含 \texttt{'available'} 列};
\node (decision) [decision, below=of check] {包含 \texttt{'available'} 列?};
\node (loadData) [process, right=of decision] {加载数据到 \\ \texttt{DataFrame}};
\node (reloadCSV) [process, left=of decision] {重新加载 \\ \texttt{calendar.csv}};
\node (stop) [startstop, below=of decision, yshift=-3cm] {结束};

% 连接节点
\draw [arrow] (start) -- (check);
\draw [arrow] (check) -- (decision);
\draw [arrow] (decision.east) -- ++(1.5,0) |- (loadData.north);
\draw [arrow] (decision.west) -- ++(-1.5,0) |- (reloadCSV.north);
\draw [arrow] (decision.south) -- ++(0,-1.5) -- (stop.north);

\end{tikzpicture}

\end{document}
我生成SVG后放进PPT里了,矢量图还是不错的
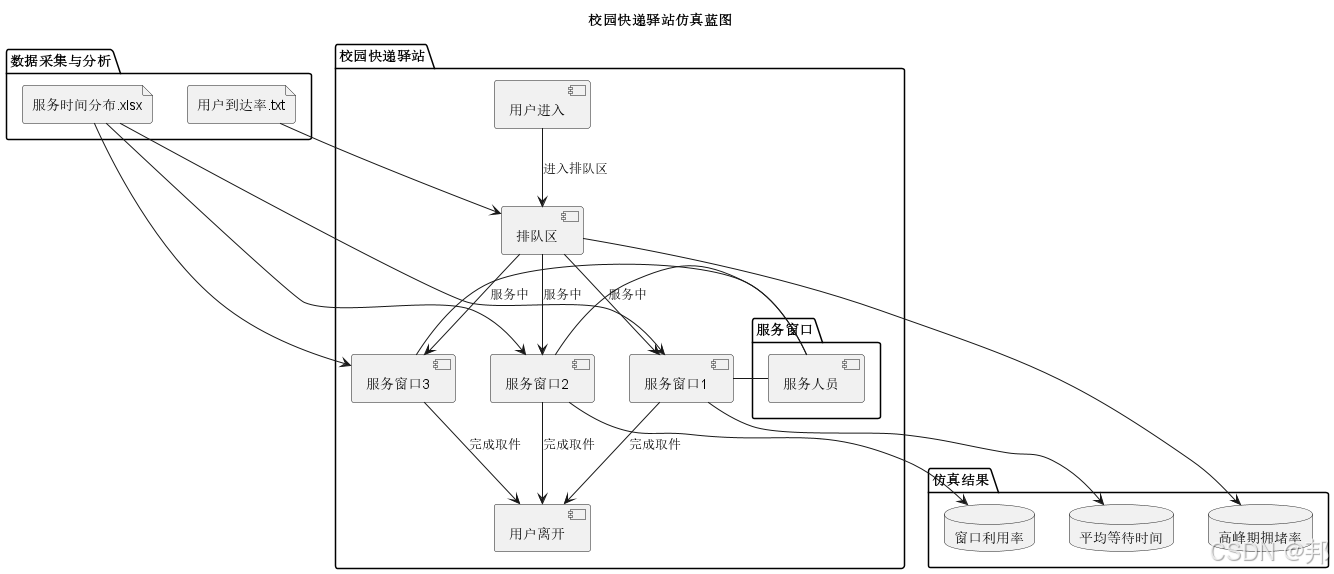
二、puml
完美实现你要求的内容部分,细节部分和具体落实他似乎有自己的想法,甚至没法执行“将直线图变U形”
@startuml
title 校园快递驿站仿真蓝图

' 定义快递驿站系统的基本结构
package "校园快递驿站" {

  ' 定义排队流程中的各个实体
  component "用户进入" as Enter
  component "排队区" as Queue
  component "服务窗口1" as Window1
  component "服务窗口2" as Window2
  component "服务窗口3" as Window3
  component "用户离开" as Exit

  ' 资源定义:窗口与排队
  package "服务窗口" {
    Window1 - [服务人员]
    Window2 - [服务人员]
    Window3 - [服务人员]
  }

  ' 逻辑流程连接
  Enter --> Queue : 进入排队区
  Queue --> Window1 : 服务中
  Queue --> Window2 : 服务中
  Queue --> Window3 : 服务中
  Window1 --> Exit : 完成取件
  Window2 --> Exit : 完成取件
  Window3 --> Exit : 完成取件
}

' 增加数据分析和仿真输出
package "数据采集与分析" {
  file "用户到达率.txt" as ArrivalRate
  file "服务时间分布.xlsx" as ServiceTime
  ArrivalRate --> Queue
  ServiceTime --> Window1
  ServiceTime --> Window2
  ServiceTime --> Window3
}

' 输出结果
package "仿真结果" {
  database "平均等待时间" as AvgWait
  database "窗口利用率" as WindowUsage
  database "高峰期拥堵率" as PeakRate

  Window1 --> AvgWait
  Window2 --> WindowUsage
  Queue --> PeakRate
}

@enduml
三、mmd
flowchart TD
    A[数据收集与准备] --> B[构建特征向量 X_i_j 和目标 ST_i_j]
    B --> C[训练SVR模型]
    C --> D[预测安全时间 ST_i_j]
    D --> E[将 ST_i_j 保存至采购管理]
    E --> F[MRP生成计划订单]
    F --> G[检查安全时间 ST_i_j]

    G -->|无警示订单| H[无警示订单处理: 按 POR 和 PORC 发单]
    G -->|警示订单| I[警示订单处理: 优先选择无延迟供应商]
    I --> J[调整交货日期: Adjusted_Delivery_Date = Required_Date - ST_i_j]
    J --> K[向供应商发单并记录信息]

    %% 辅助注释部分
    style A fill:#FFDDC1 stroke:#333 stroke-width:2px
    style B fill:#FFE5B4 stroke:#333 stroke-width:2px
    style C fill:#D4A5A5 stroke:#333 stroke-width:2px
    style D fill:#B4C7E7 stroke:#333 stroke-width:2px
    style E fill:#C1E1C1 stroke:#333 stroke-width:2px
    style F fill:#C1E1C1 stroke:#333 stroke-width:2px
    style G fill:#FFC1C1 stroke:#333 stroke-width:2px
    style H fill:#FFDDC1 stroke:#333 stroke-width:2px
    style I fill:#FFDDC1 stroke:#333 stroke-width:2px
    style J fill:#FFE5B4 stroke:#333 stroke-width:2px
    style K fill:#D4A5A5 stroke:#333 stroke-width:2px
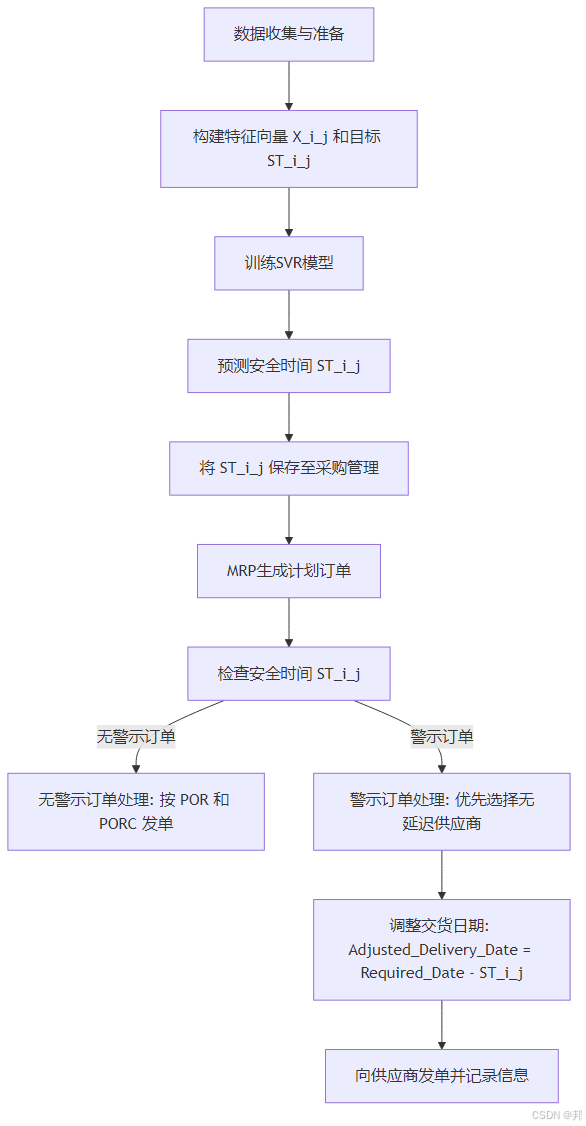
用法简单,可在线编辑,适用范围挺大的,不过在本地上使用体验很差甚至看不到报错,在线编辑器可以看到
在线编辑器
四、总结
有latex用一,偏理用二,偏文用三


 被折叠的 条评论
为什么被折叠?
被折叠的 条评论
为什么被折叠?
 到【灌水乐园】发言


