


 本文通过实例演示了如何使用Matplotlib进行数据可视化,包括基本的正弦曲线绘制、饼图展示及词云图生成等。文章还介绍了如何利用Pandas处理CSV文件中的数据,并将这些数据用于图表中。
import matplotlib.pyplot as plt
import math
import numpy as np
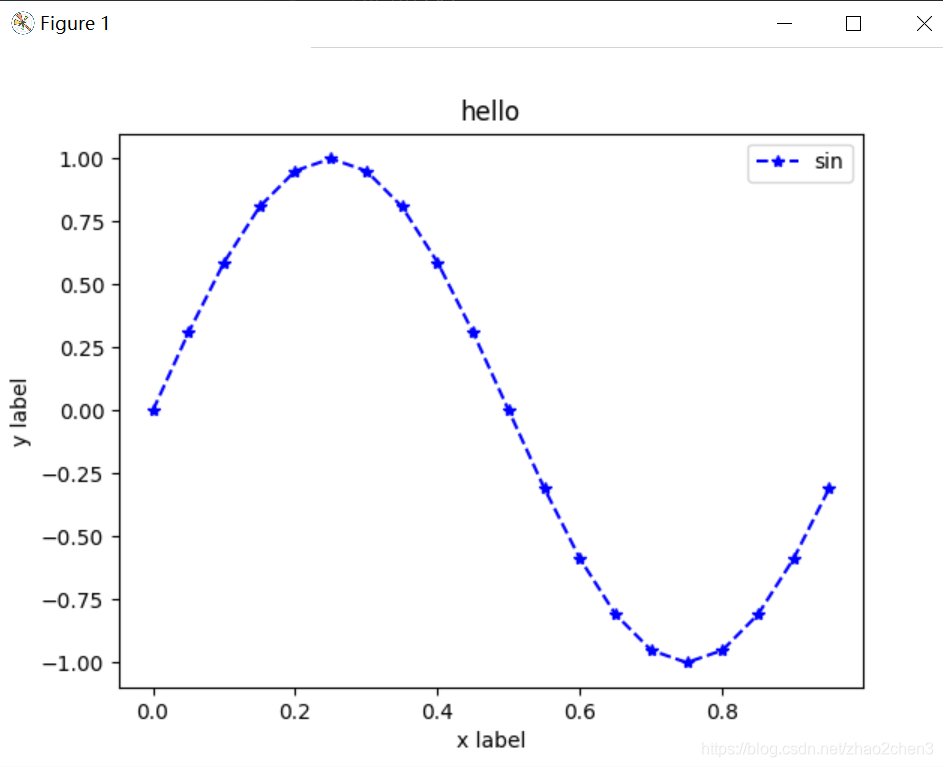
x=np.arange(0,1,0.05)
print(x)
y=np.sin(2*math.pi*x)
print(y)
plt.plot(x,y,'b--*',label='sin') #蓝色虚线*点 --o 图例项的名称 与legend相配套,一起出现
plt.title("hello")
plt.xlabel('x label')
plt.ylabel('y label')
plt.legend(loc='best') #设置图例项的位置 upper center
plt.show();
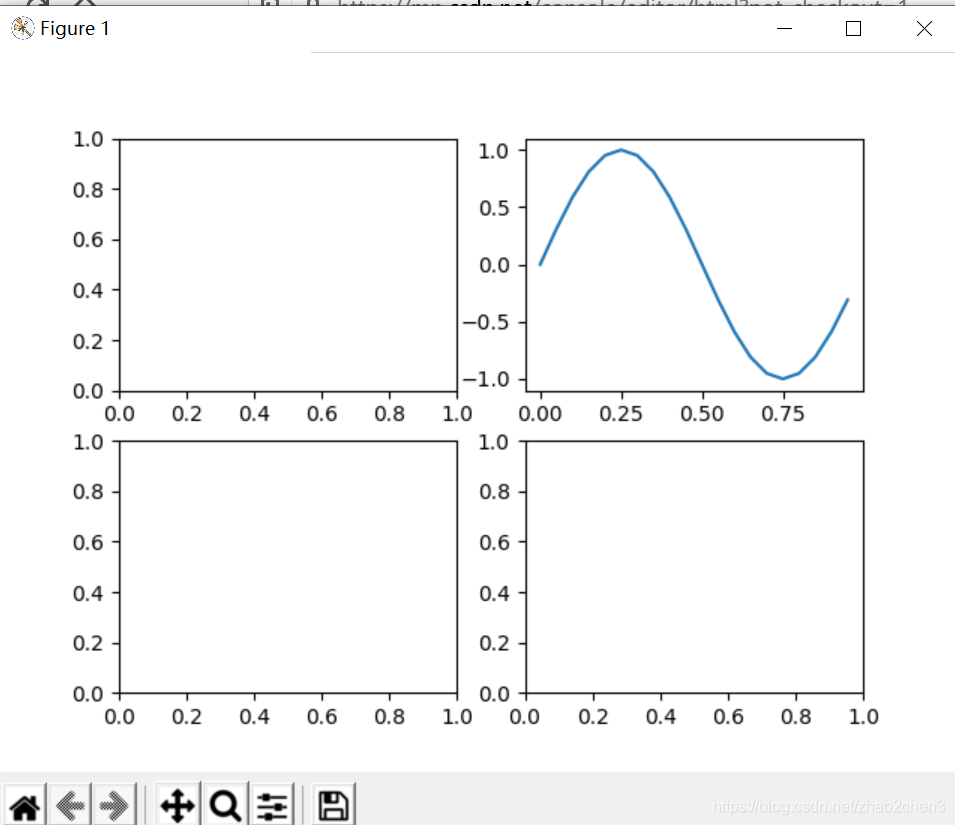
fig,ax=plt.subplots(2,2)
ax[0,1].plot(x,y)
plt.show();
fig.savefig('myfig.png')
# 读取数据
import pandas as pd
import matplotlib.pyplot as plt
df = pd.read_csv('data.csv')
df.head()
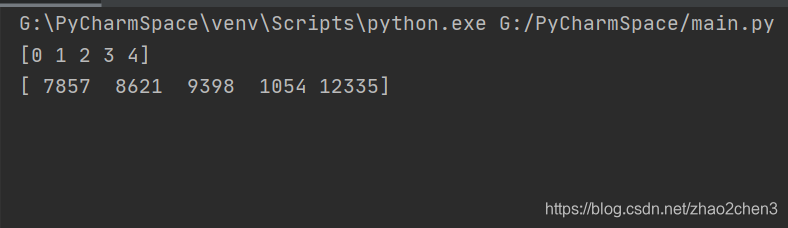
x = df.index.values
y = df['人均GDP'].values
print(x); #[0 1 2 3 4]
print(y);#[ 7857 8621 9398 1054 12335]
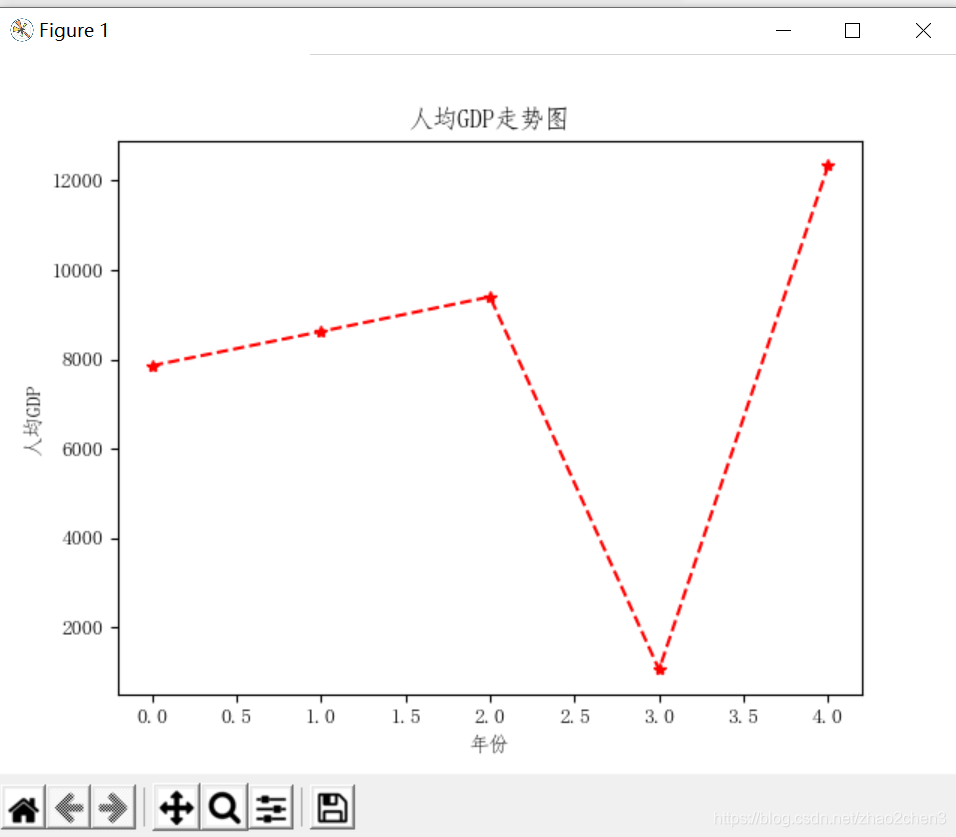
from pylab import mpl
mpl.rcParams['font.sans-serif'] = ['FangSong'] # 指定默认字体
fig, ax = plt.subplots()
ax.plot(x, y, 'r--*')
ax.set(title='人均GDP走势图', xlabel='年份',ylabel='人均GDP')
plt.show()
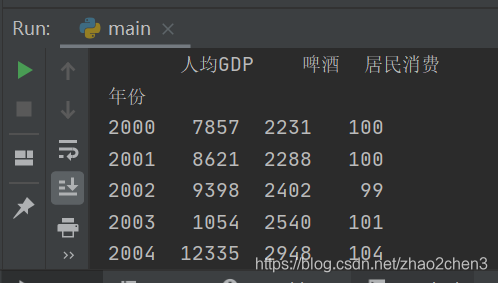
df = pd.read_csv('data.csv',index_col='年份')

# 读取数据
import pandas as pd
import matplotlib.pyplot as plt
df = pd.read_csv('data.csv',index_col='年份')
print(df.head())
# 读取数据
import pandas as pd
import matplotlib.pyplot as plt
df = pd.read_csv('data.csv',index_col='年份')
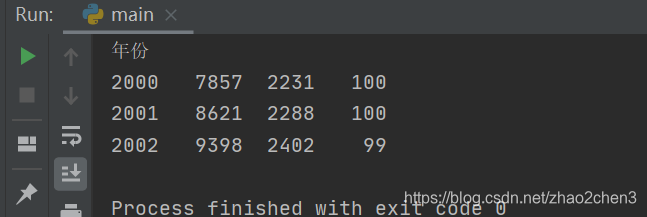
print(df[:3].head()) #显示前三行
# 读取数据
import pandas as pd
import matplotlib.pyplot as plt
df = pd.read_csv('data.csv',index_col='年份')
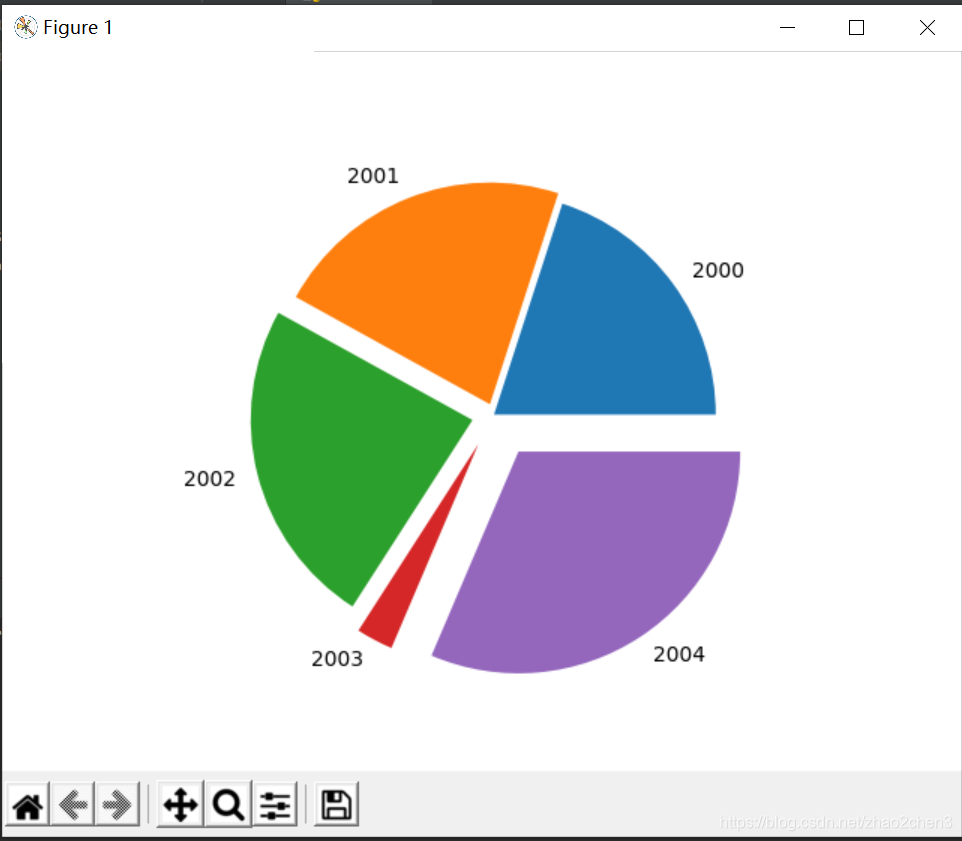
x=df.index.values
y=df['人均GDP'].values
fig,ax=plt.subplots()
ax.pie(y[:5],labels=x[:5],explode=[0,0.05,0.1,0.15,0.2])
plt.show()
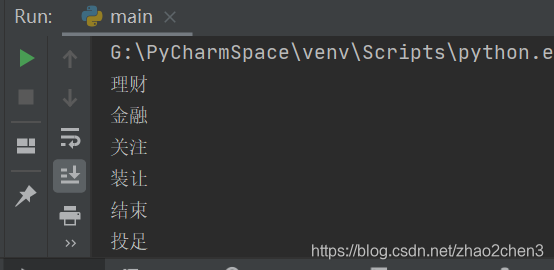
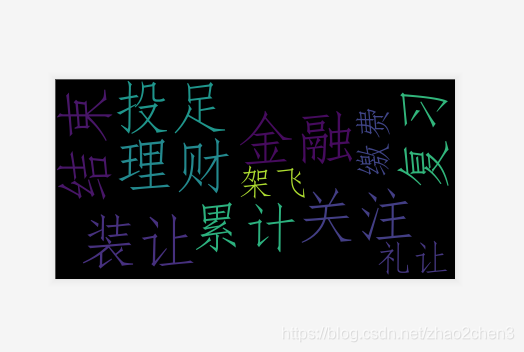
#绘制词云图
with open('cc.csv',encoding='utf-8') as file:
 words=file.read()

print(words)
#生成词云
with open('cc.csv',encoding='utf-8') as file:
 words=file.read()
from wordcloud import WordCloud

wordcloud=WordCloud(font_path='C:/Windows/Fonts/simfang.ttf').generate(words)
image=wordcloud.to_image()
image.show()
import numpy as np
with open('cc.csv',encoding='utf-8') as file:
words=file.read()
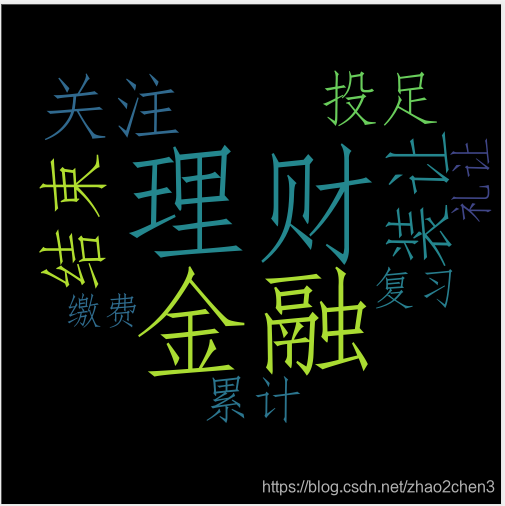
#绘制指定形状的词云图
from PIL import Image
images=Image.open('heart.png')
maskImages=np.array(images) #把图片转化成数字的方式
from wordcloud import WordCloud
wordcloud=WordCloud(font_path='C:/Windows/Fonts/simfang.ttf',
background_color='black',width=600,height=300,max_words=10,
mask=maskImages).generate(words) #把maskImages放在这里
image=wordcloud.to_image()
image.show()


 1万+
1万+

 被折叠的 条评论
为什么被折叠?
被折叠的 条评论
为什么被折叠?
 到【灌水乐园】发言


