


 文章详细介绍了如何在CentOS系统上安装和配置Prometheus,包括Prometheus自身、node_exporter(收集Linux主机信息)、mysqld_exporter(监控MySQL)和postgres_exporter(监控PostgreSQL),以及最后如何安装Grafana进行可视化监控。每个组件的下载、解压、启动和配置步骤都进行了说明。
环境
CentOS、MySQL、PostgreSql
一、Prometheus 安装
开源的系统监控和报警系统
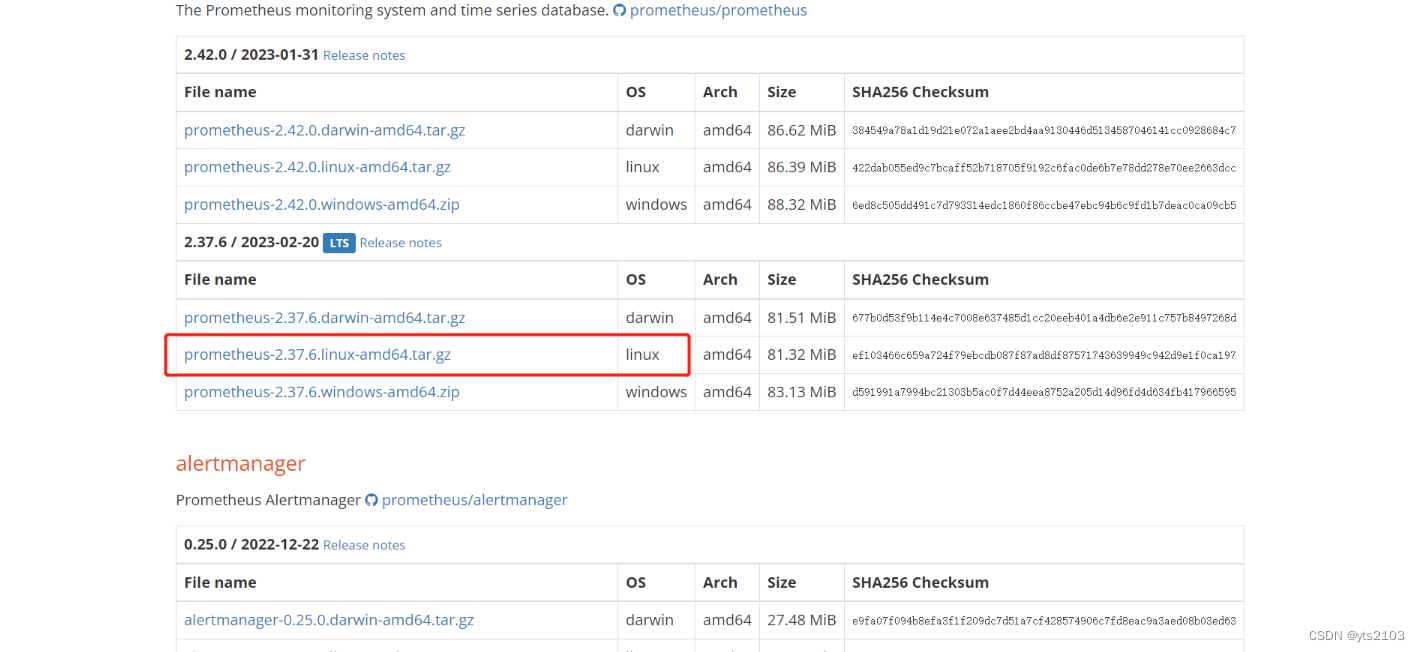
解压
tar -zxvf prometheus-2.37.6.linux-amd64.tar.gz启动
nohup /opt/prometheus-2.37.6.linux-amd64/prometheus --config.file="/opt/prometheus-2.37.6.linux-amd64/prometheus.yml" &访问:http://ip地址:9090
若无法访问,开放对应端口
firewall-cmd --zone=public --add-port=9090/tcp --permanent
firewall-cmd --reload
二、安装 node_exporter
node_exporter是专门收集linux系统主机资源利用数据的,如磁盘、cpu、内存等信息
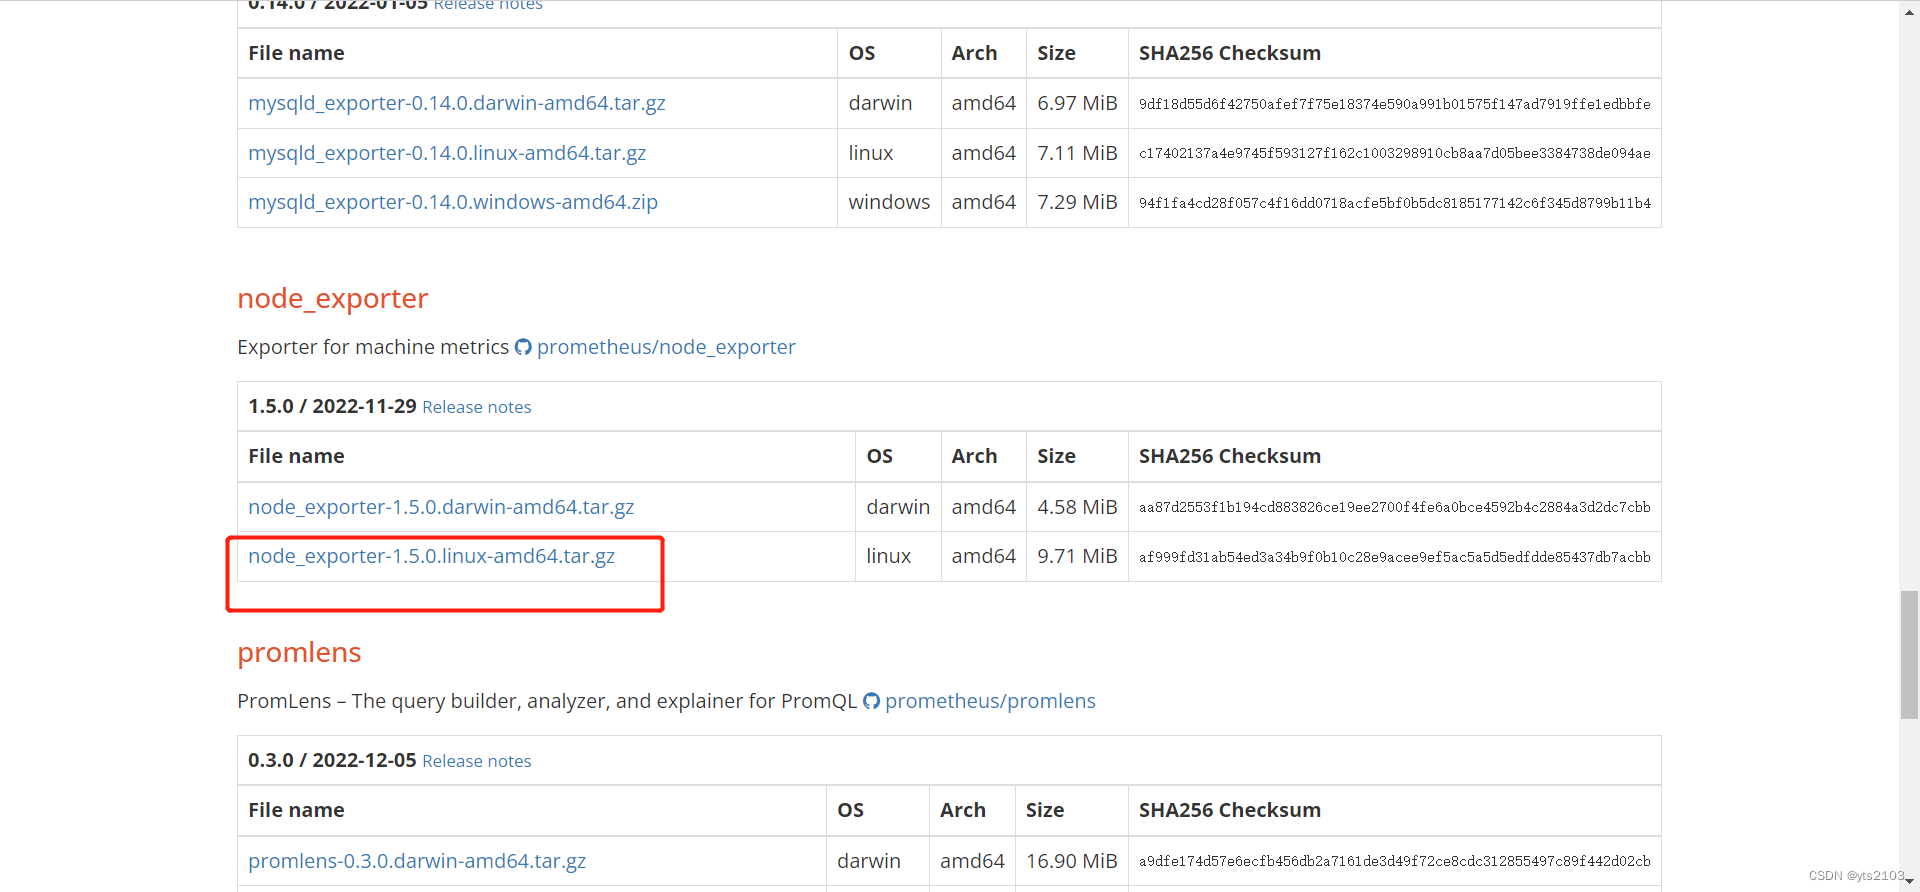
解压
tar -zxvf node_exporter-1.5.0.linux-amd64.tar.gz启动
nohup /opt/node_exporter-1.5.0.linux-amd64/node_exporter &访问:http://ip地址:9100/metrics

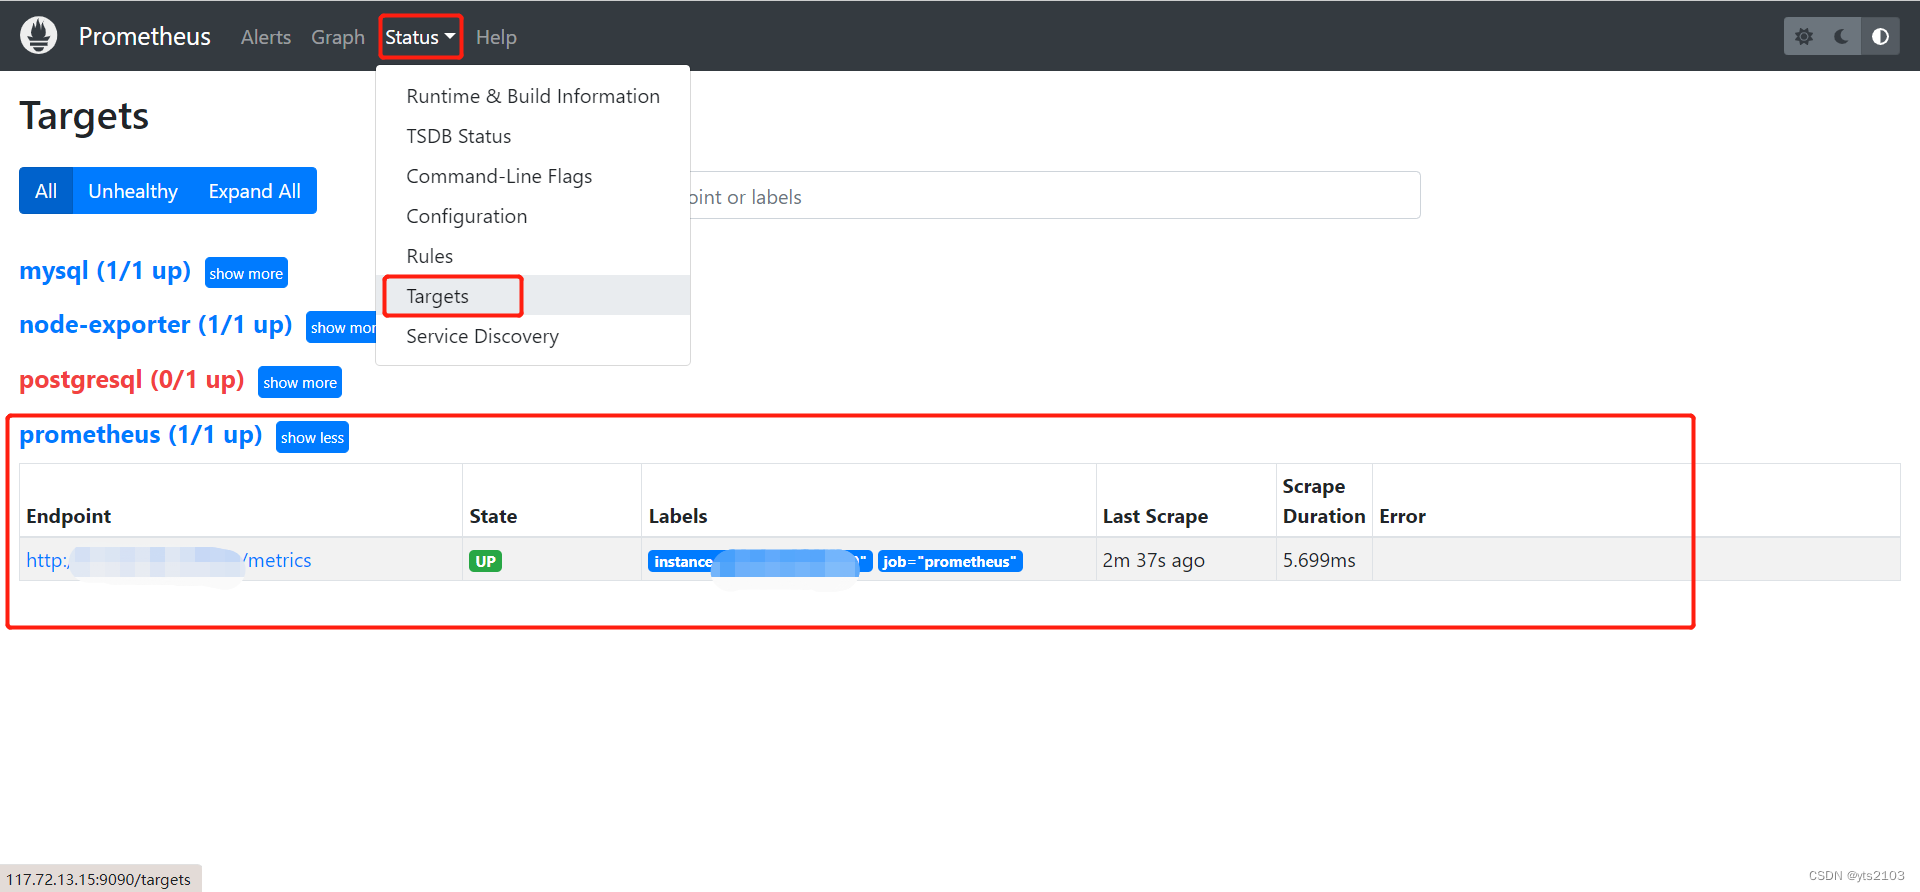
进入 prometheus 解压后的目录,在 prometheus.yml 添加如下配置信息
  - job_name: "node-exporter"
    static_configs:
      - targets: ["ip:9100"]
重启 prometheus
[root@yts/]# ps -ef | grep prometheus
root      9622  1077  0 10:58 pts/1    00:00:00 grep --color=auto prometheus
root     27323     1  0 May11 ?        00:01:16 /opt/prometheus-2.37.6.linux-amd64/prometheus --config.file=/opt/prometheus-2.37.6.linux-amd64/prometheus.yml
[root@yts /]# kill 27323
[root@yts/]# nohup /opt/prometheus-2.37.6.linux-amd64/prometheus --config.file="/opt/prometheus-2.37.6.linux-amd64/prometheus.yml" &
访问 http://ip地址:9090
三、安装 mysqld_exporter
mysqld_exporter是prometheus官方提供的用于监控mysql运行状态的exporter
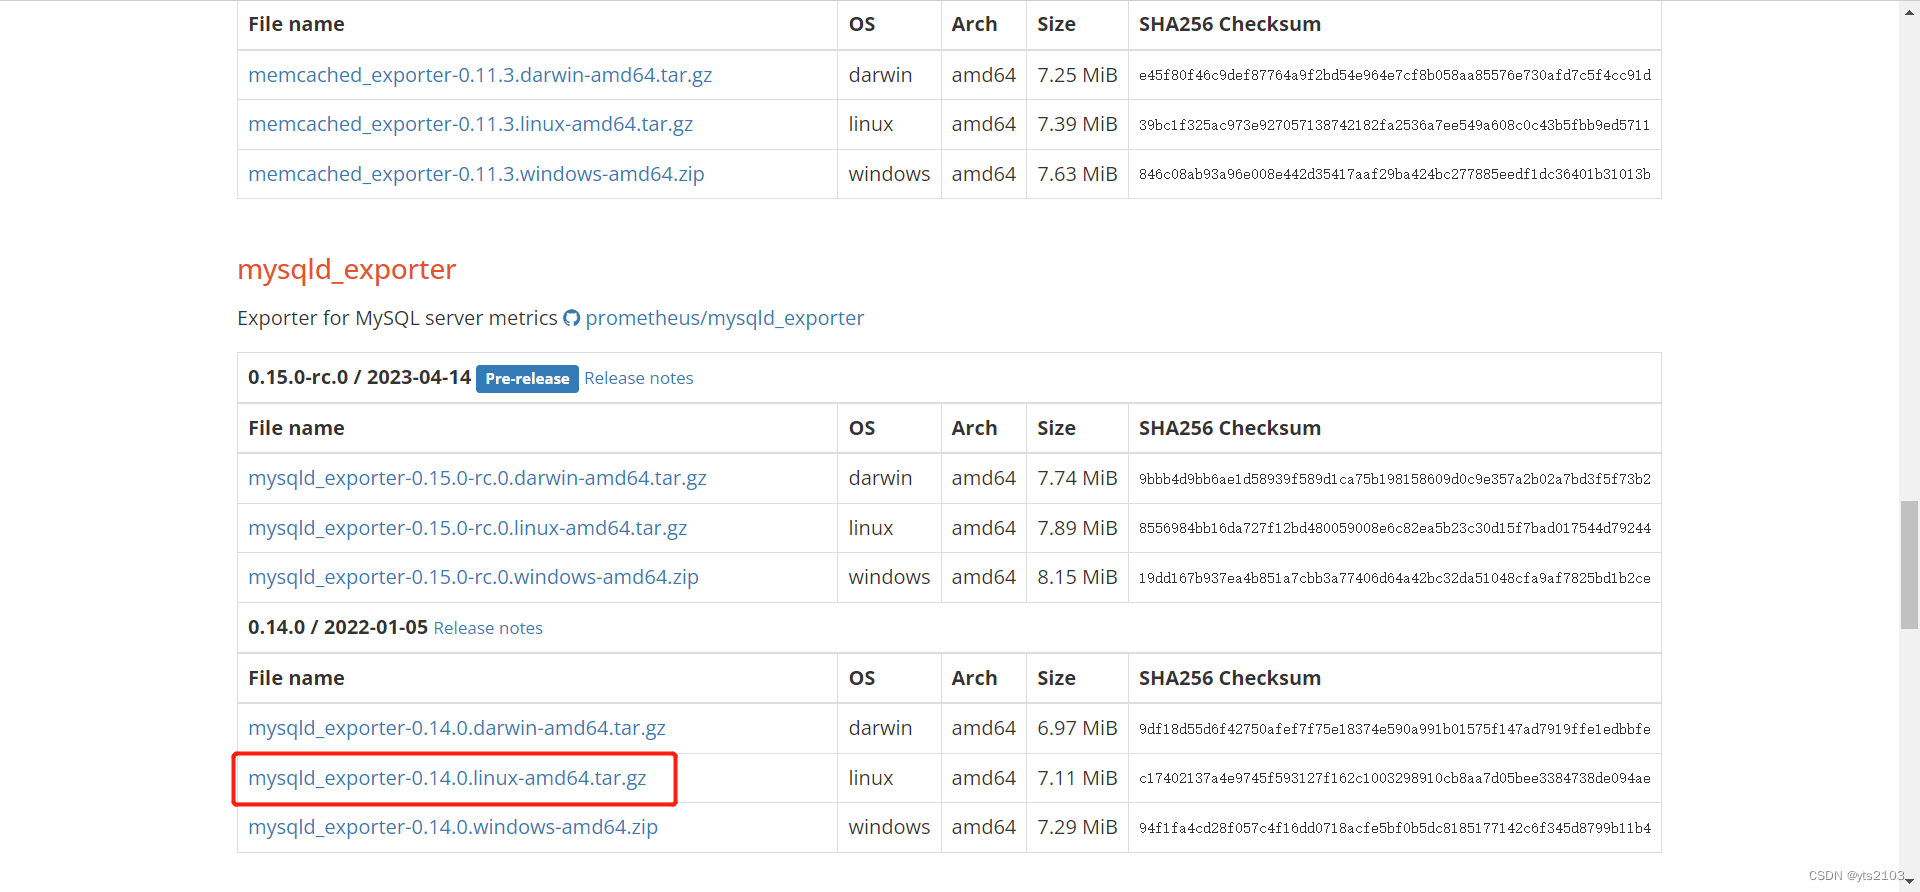
解压
tar -zxvf mysqld_exporter-0.14.0.linux-amd64.tar.gz打开解压后的目录,添加 MySQL 的配置文件 .my.cnf
vim .my.cnf[client]
user=root
password=123456保存并退出(:wq)
启动
nohup /opt/mysqld_exporter-0.14.0.linux-amd64/mysqld_exporter --config.my-cnf=/opt/mysqld_exporter-0.14.0.linux-amd64/.my.cnf &访问 http://ip地址:9104
进入 prometheus 解压后的目录,在 prometheus.yml 添加如下配置信息
  - job_name: "mysql"
    static_configs:
      - targets: ["ip:9104"]
重启 prometheus 即可查看
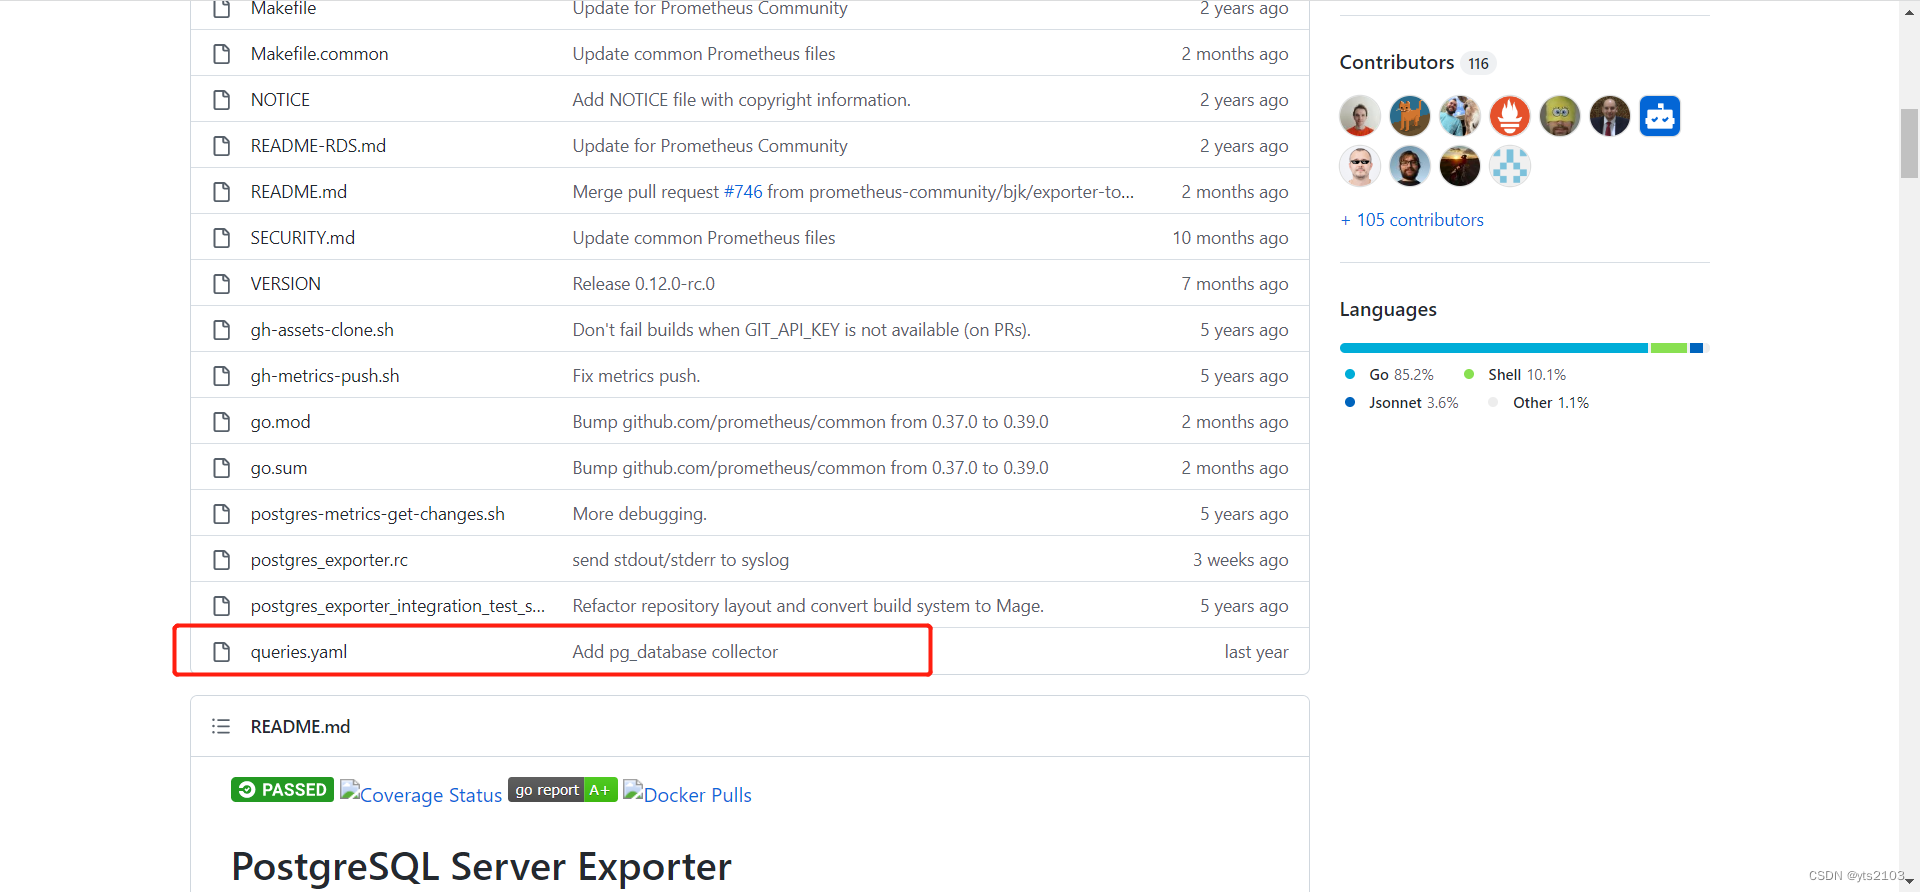
四、安装 postgres_exporter
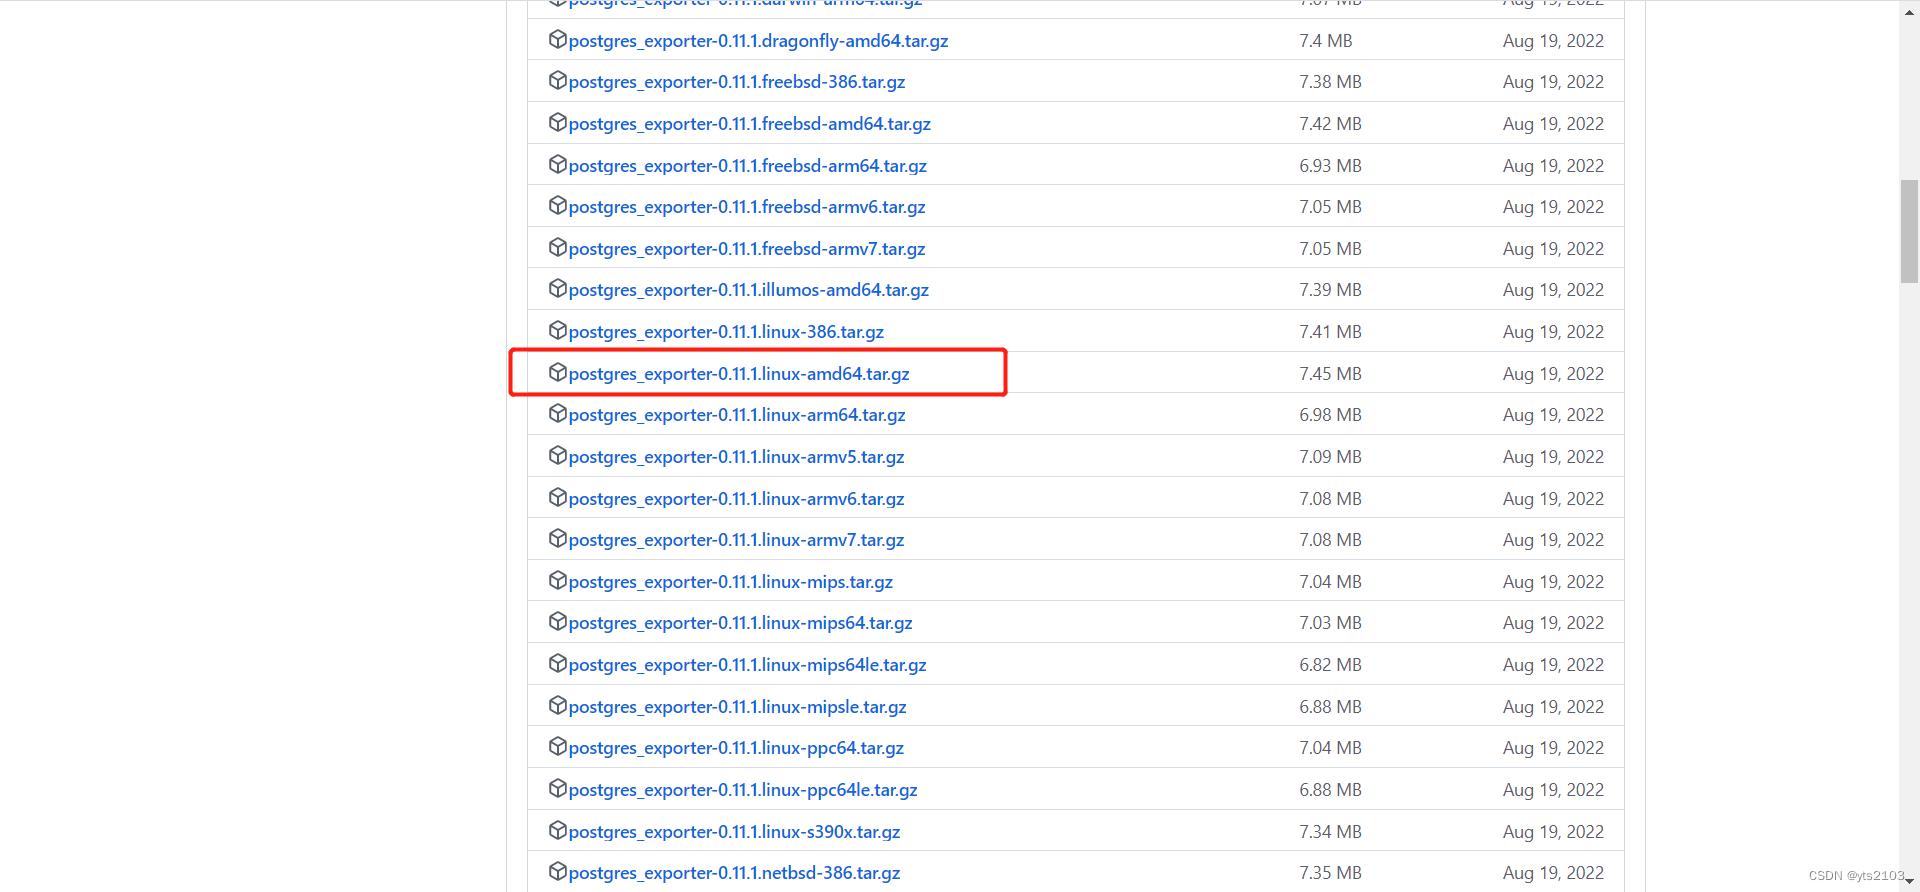
下载:queries.yaml
启动 postgres_exporter
# 注释 export DATA_SOURCE_NAME="postgresql://user:password@ip:5432/数据库名?sslmode=disable"

export DATA_SOURCE_NAME="postgresql://postgres:postgres@127.0.0.1:5432/postgres?sslmode=disable"
export PG_EXPORTER_EXTEND_QUERY_PATH="/home/flink/prometheus/postgres_exporter-0.11.1.linux-amd64/queries.yaml"
nohup ./postgres_exporter &
进入 prometheus 解压后的目录,在 prometheus.yml 添加如下配置信息
  - job_name: "postgresql"
    static_configs:
      - targets: ["ip:9187"]
重启 prometheus 即可查看
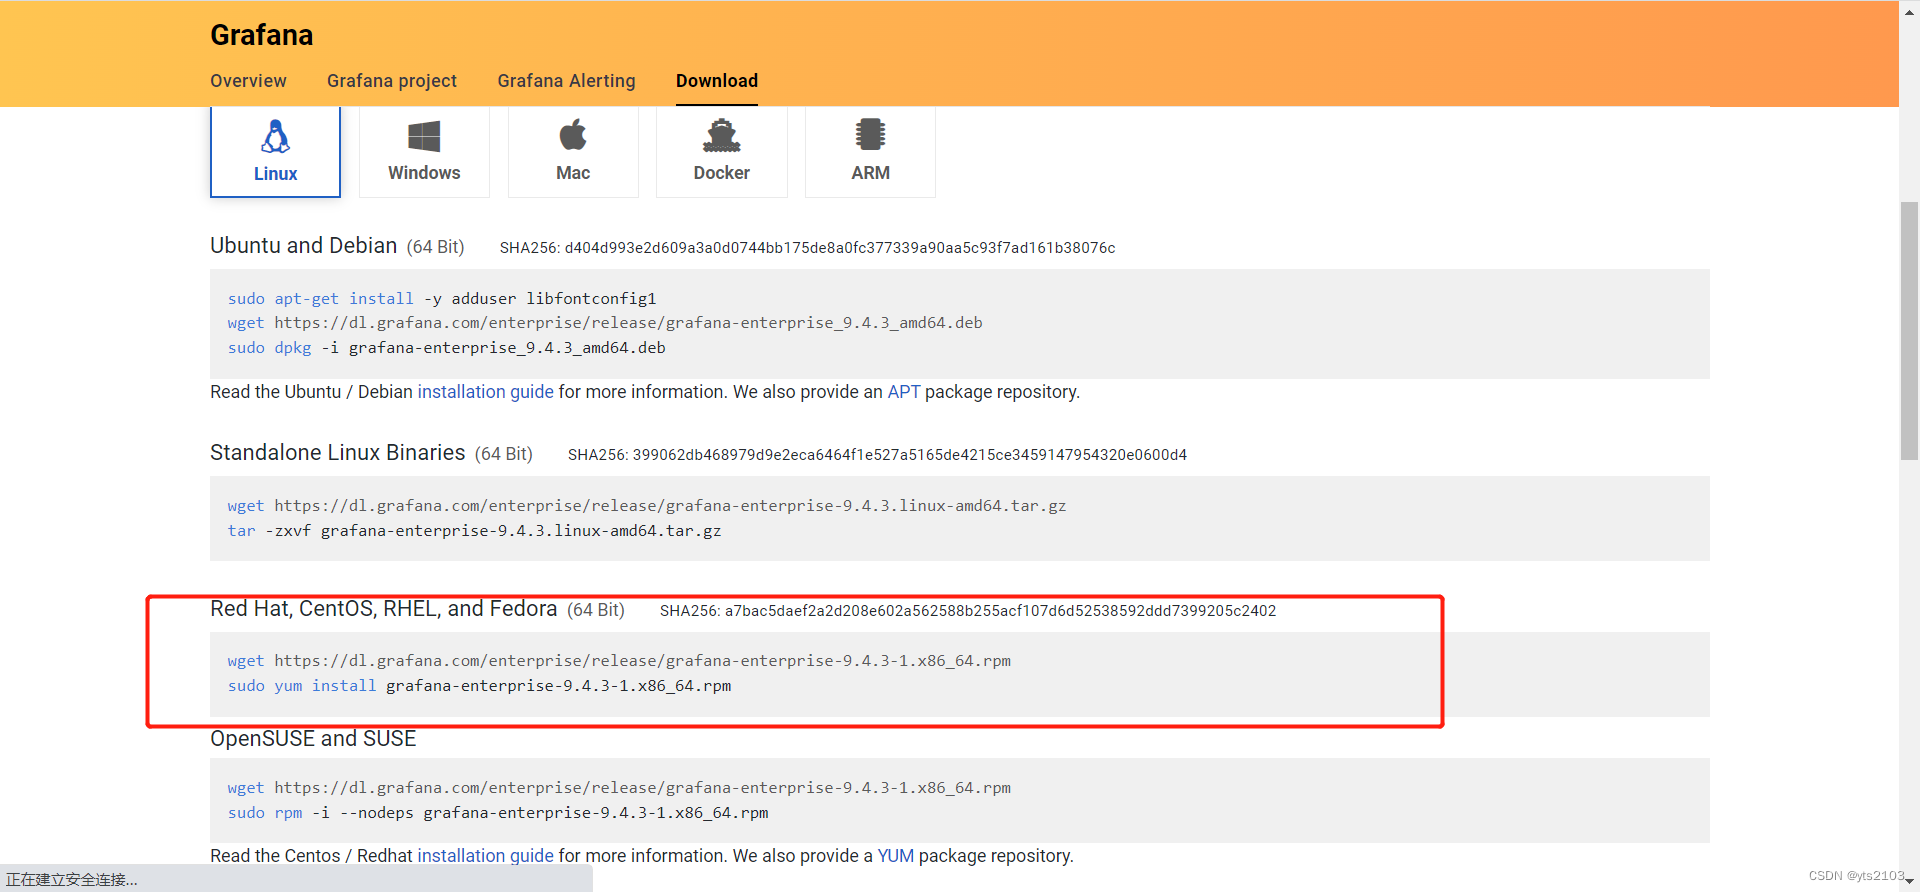
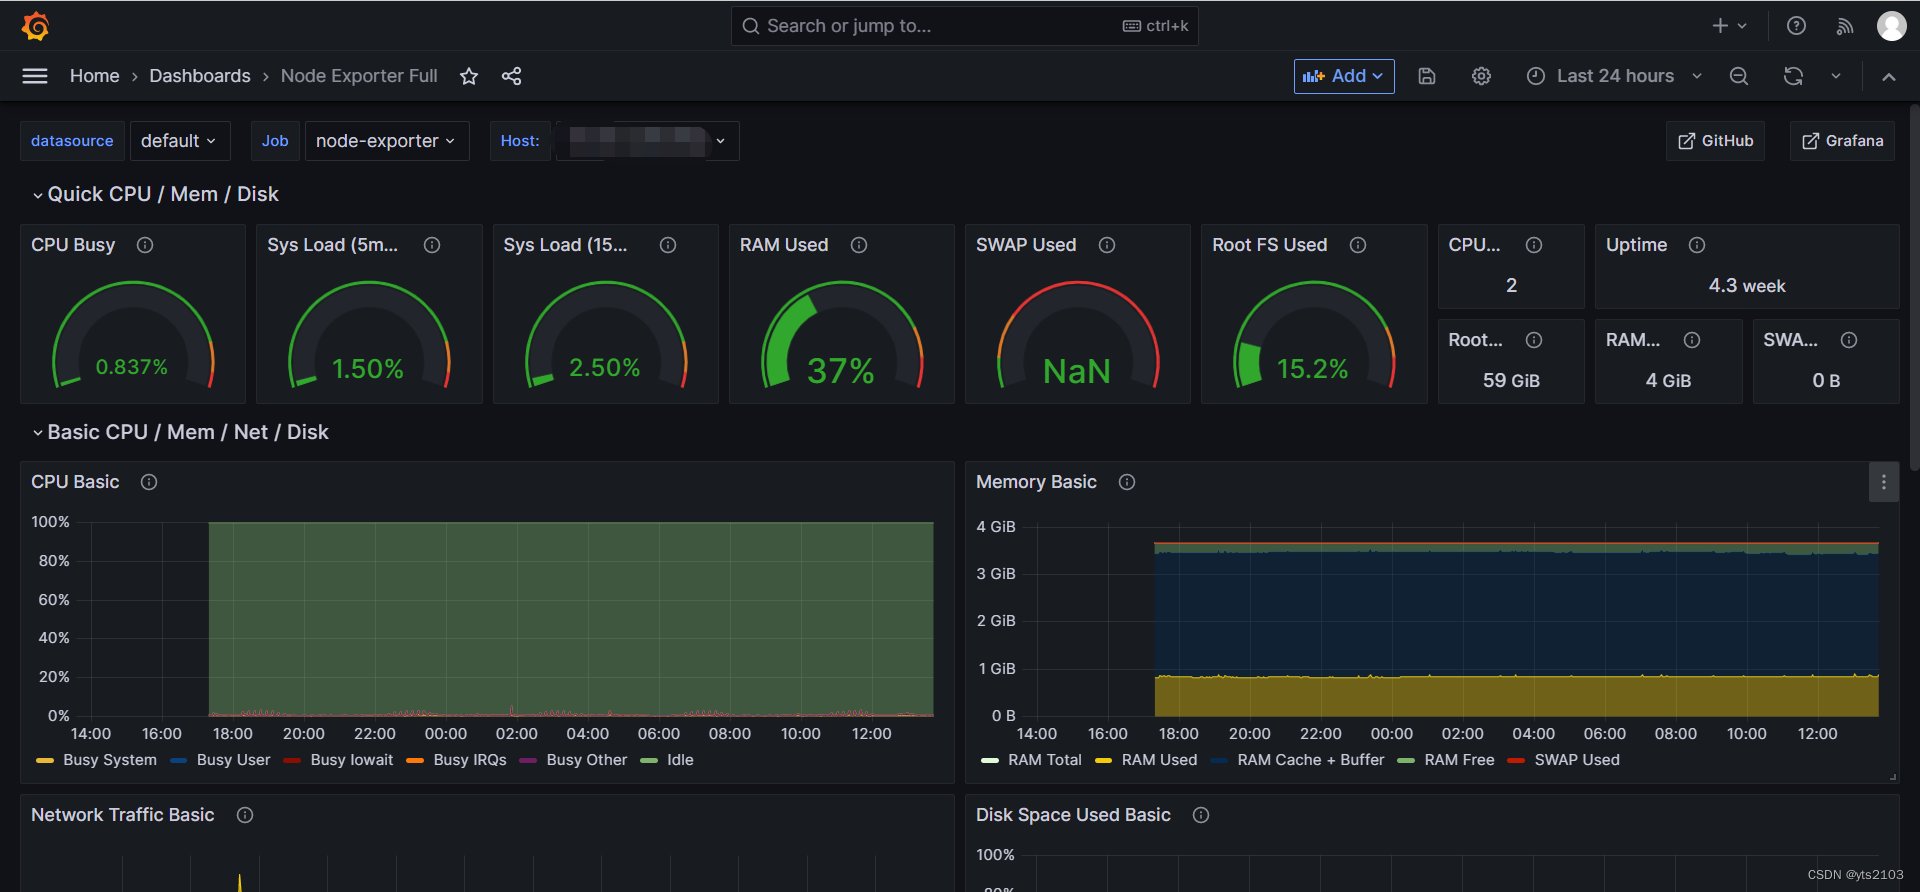
五、安装 Grafana
下载地址:Download Grafana | Grafana Labs
安装完后,设置开机自启动,并启动服务
# 设置开机自启
systemctl enable grafana-server
# 启动
systemctl start grafana-server
# 查看状态
systemctl status grafana-server
访问:http://ip:3000,默认用户名密码 admin/admin
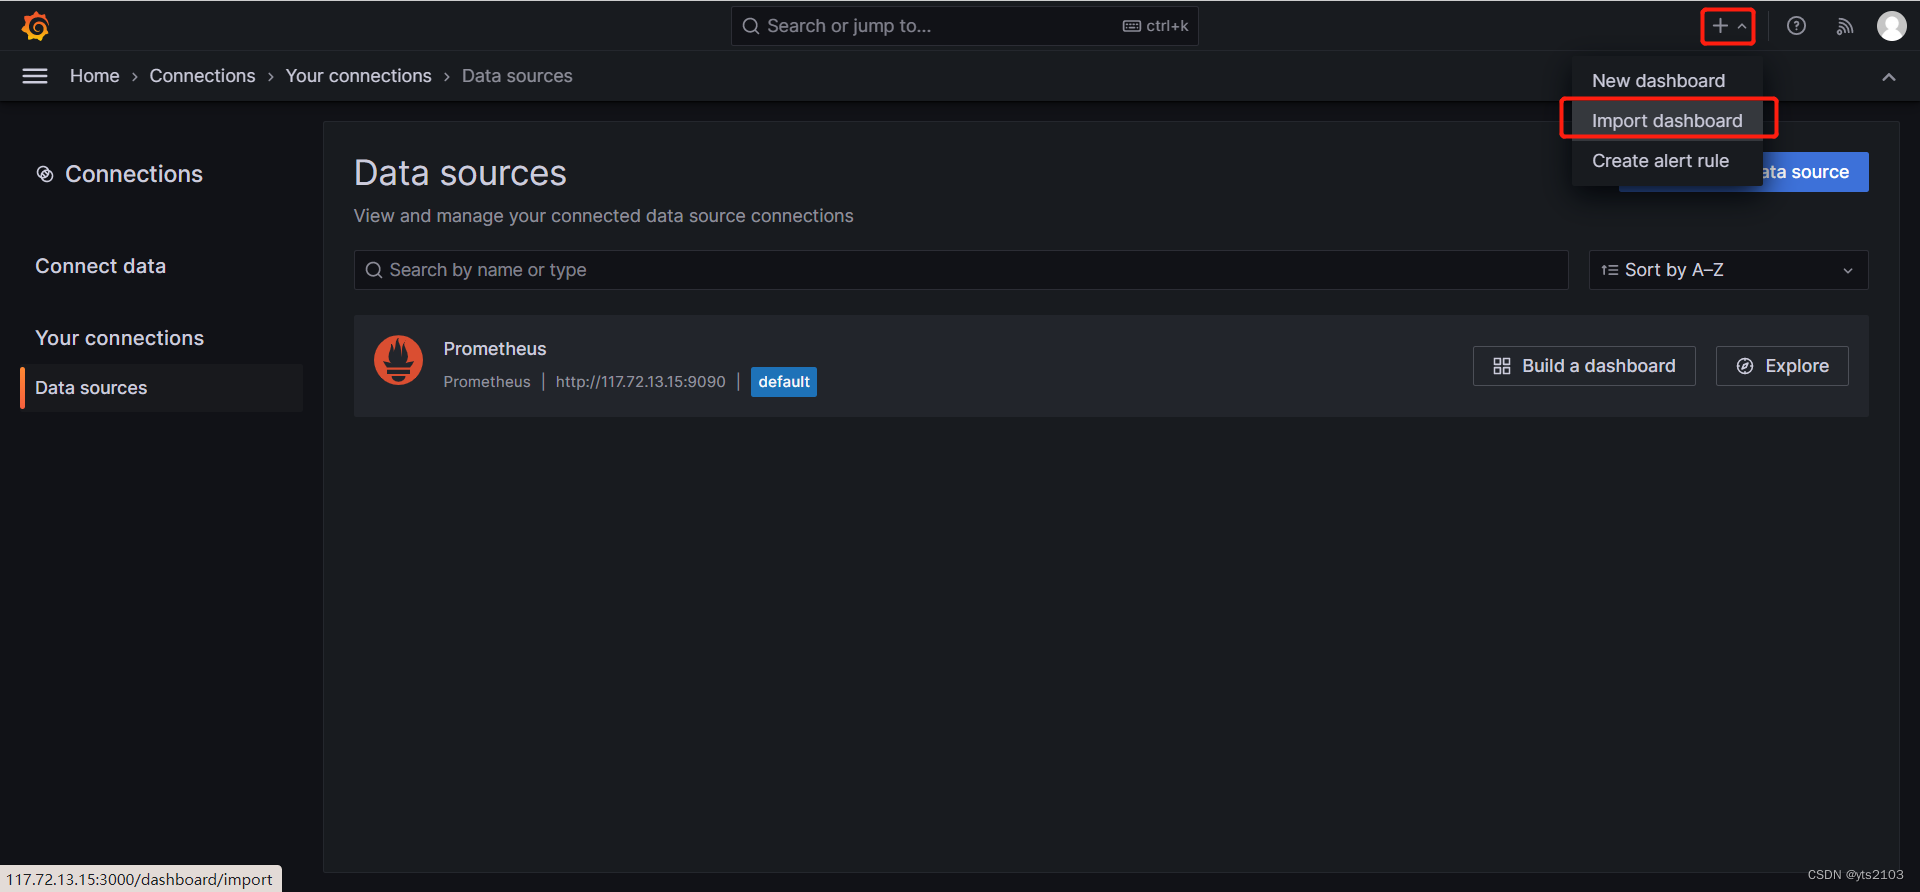
六、配置
1、prometheus
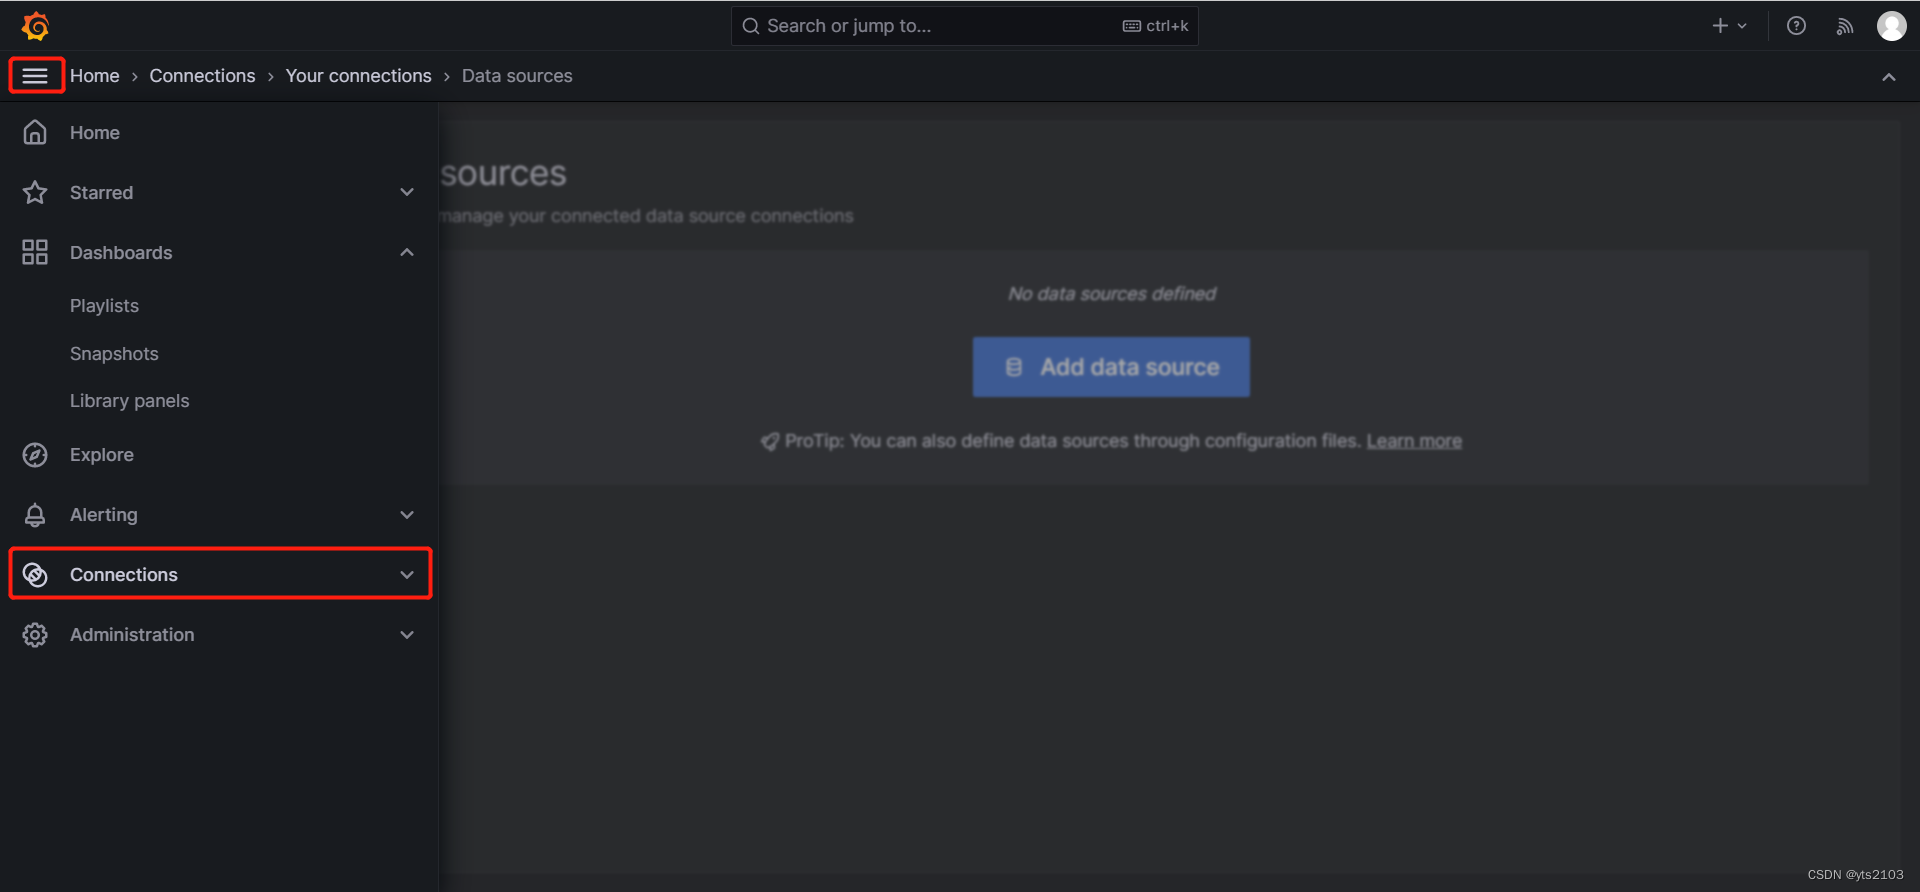
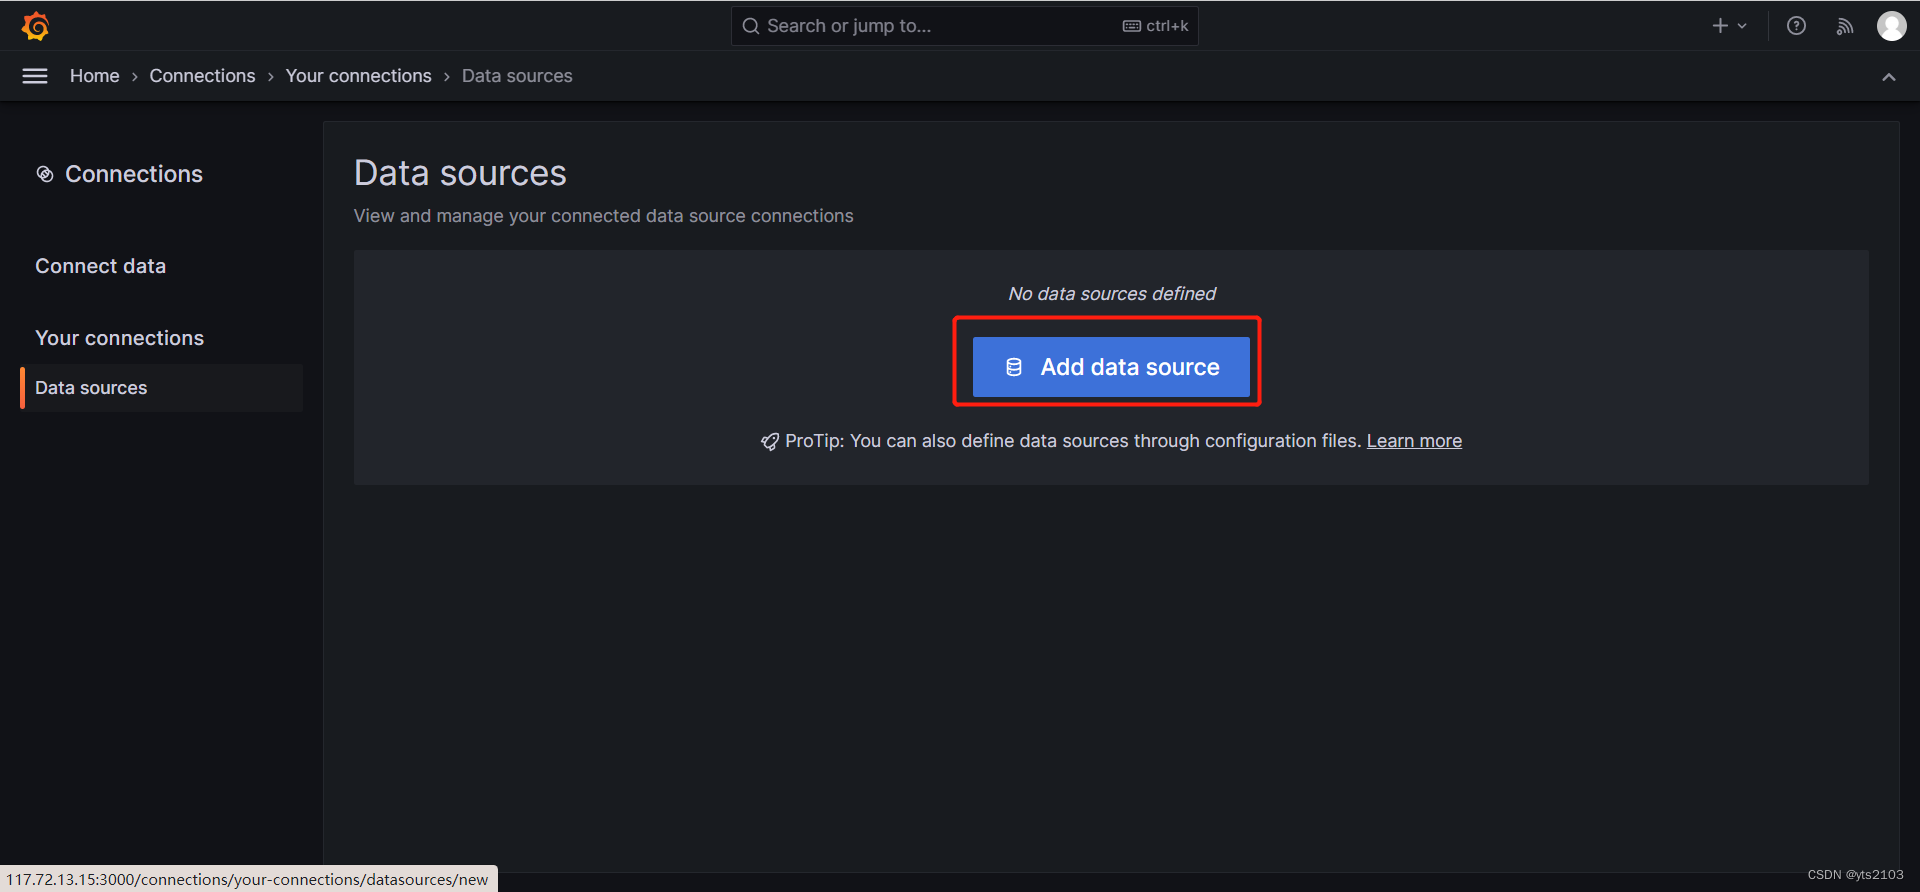
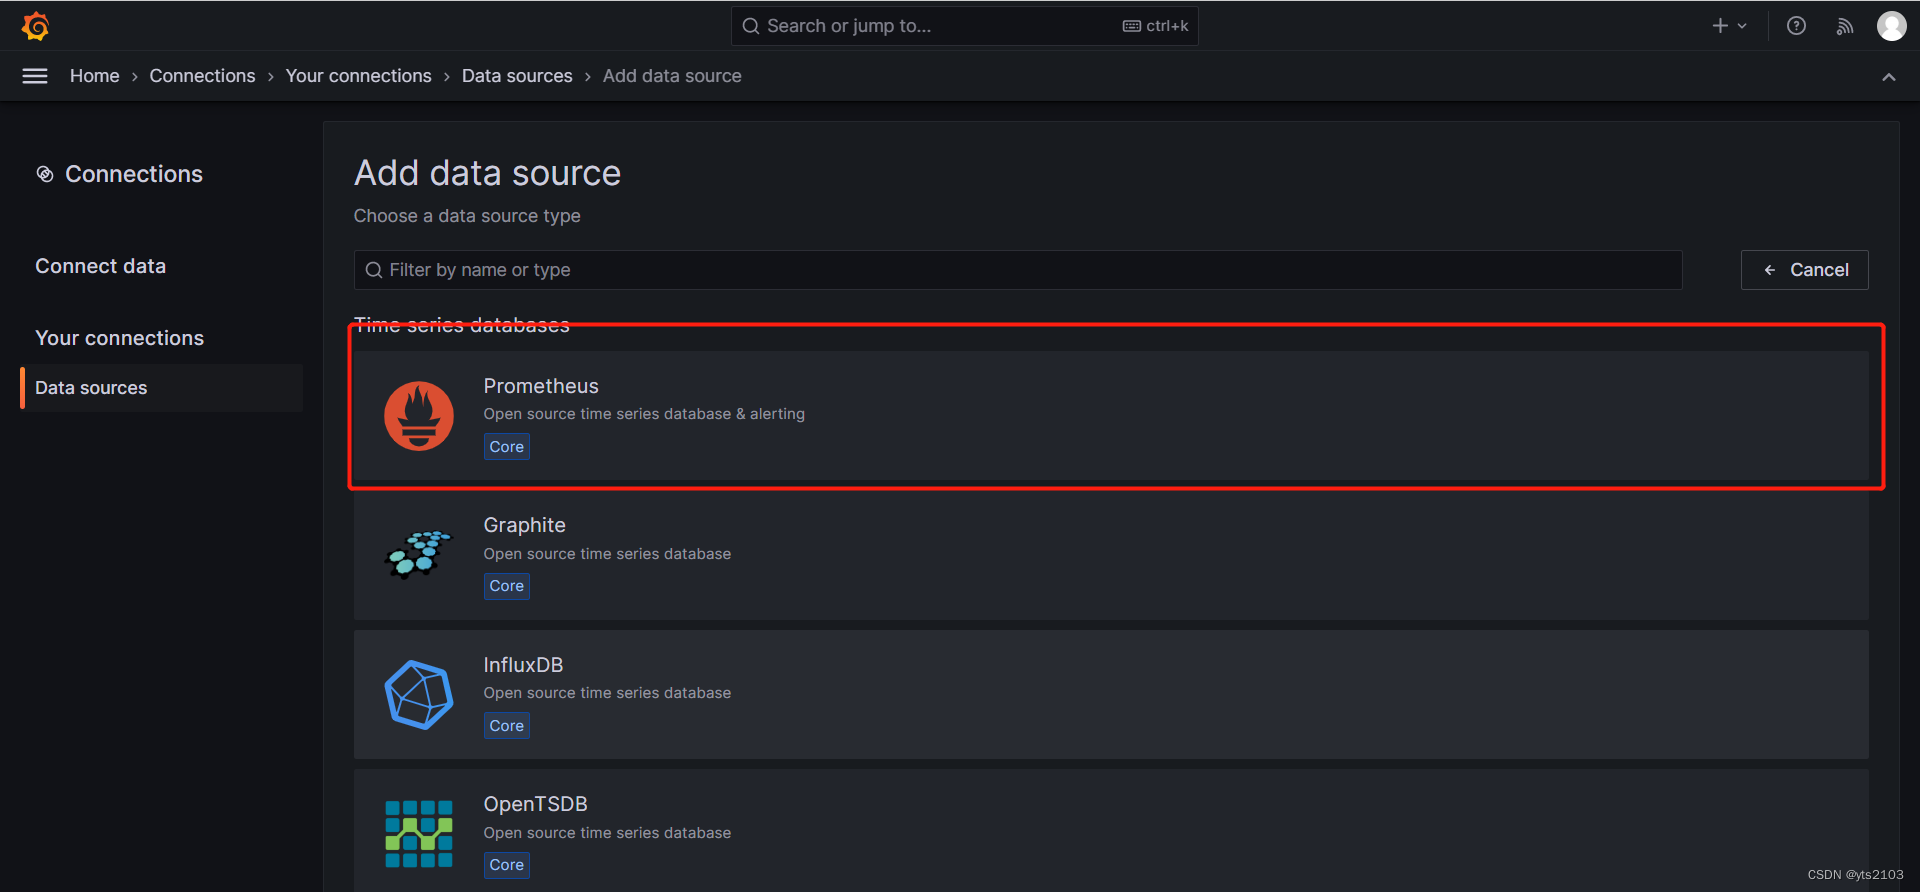
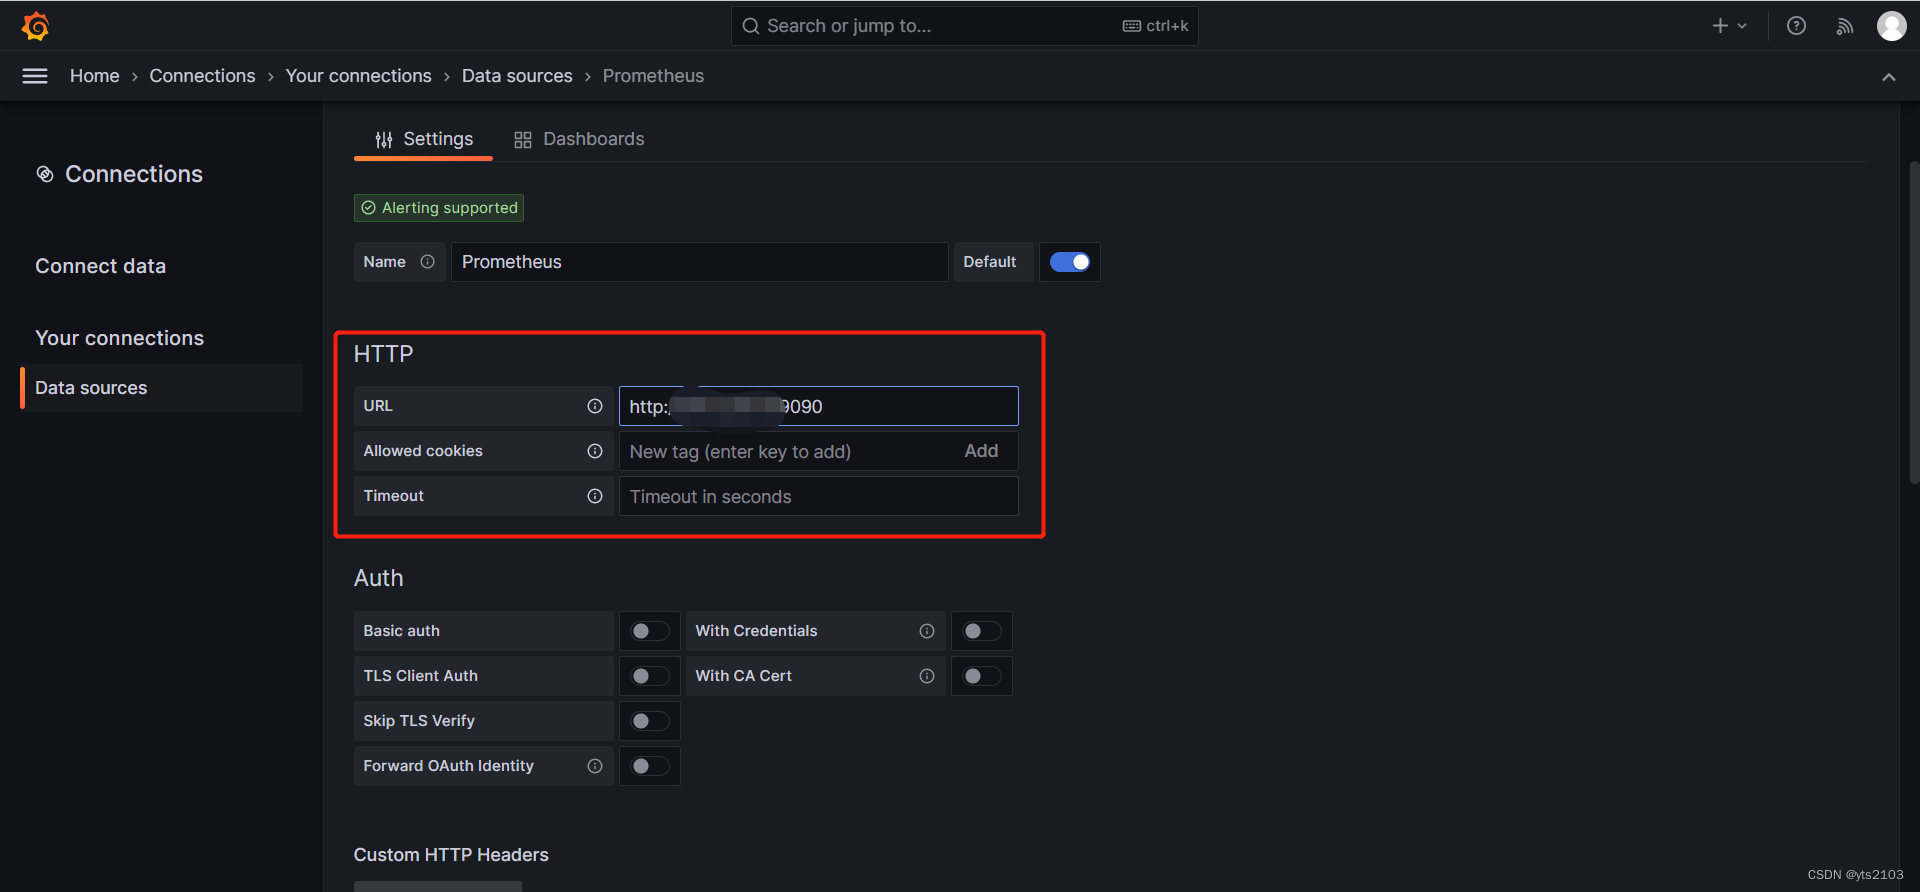
填写 prometheus 服务信息,保存即可
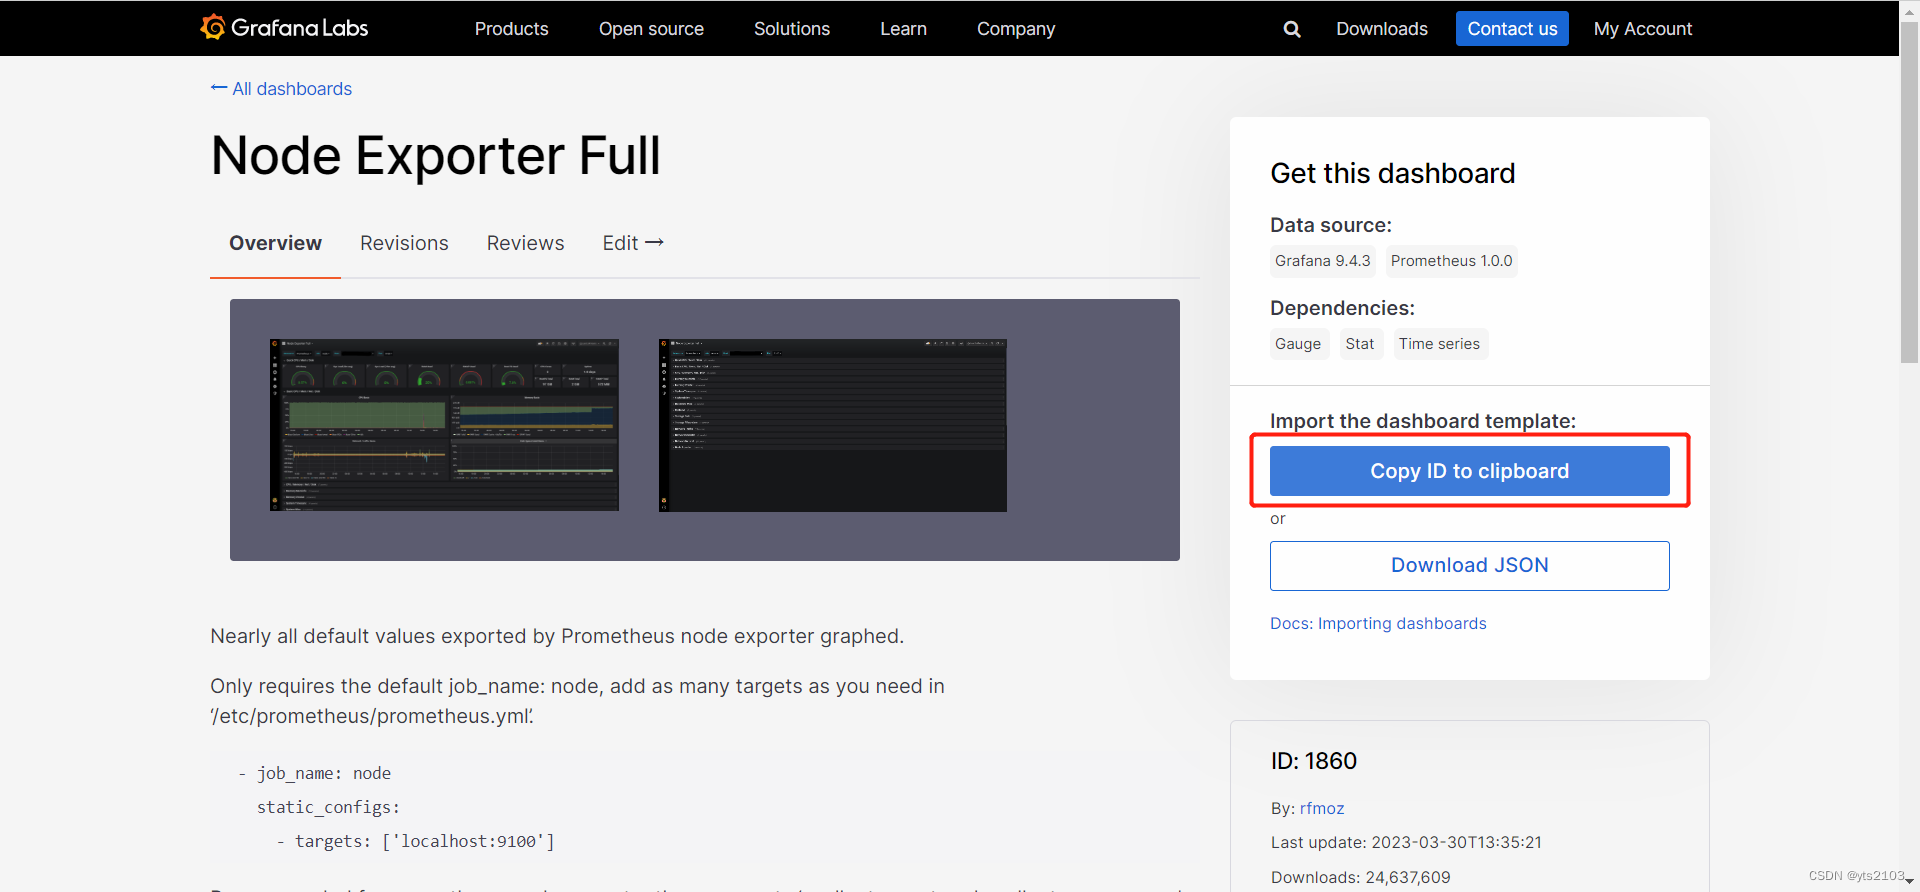
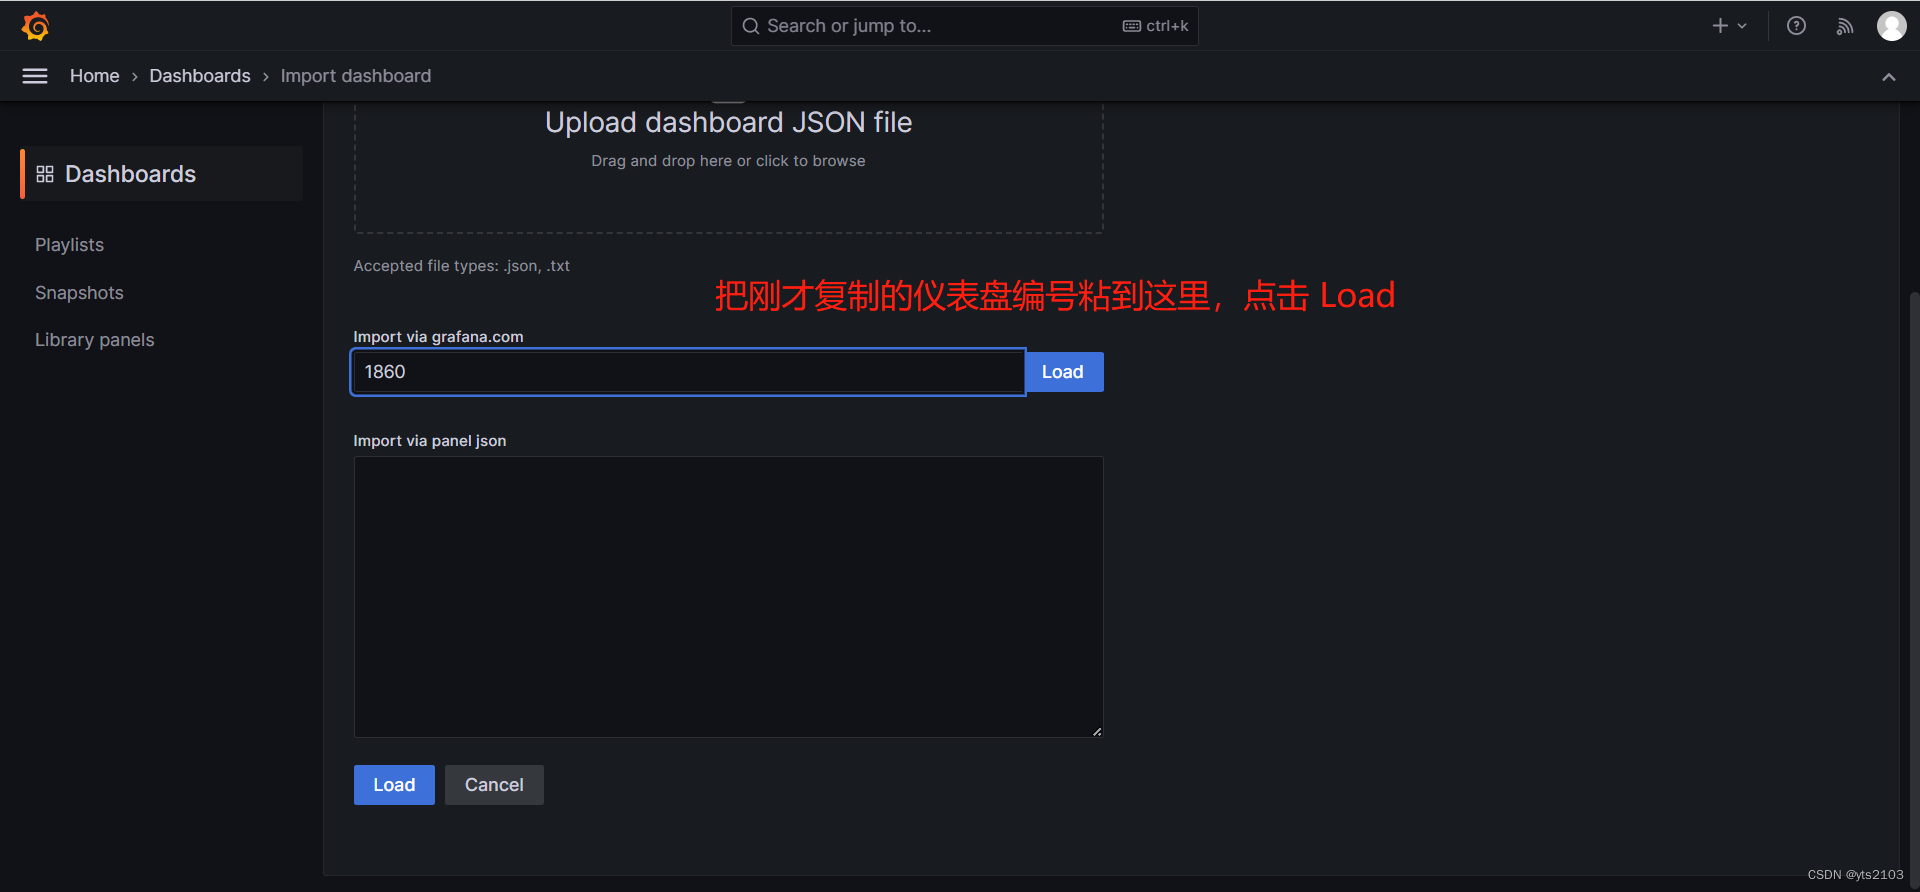
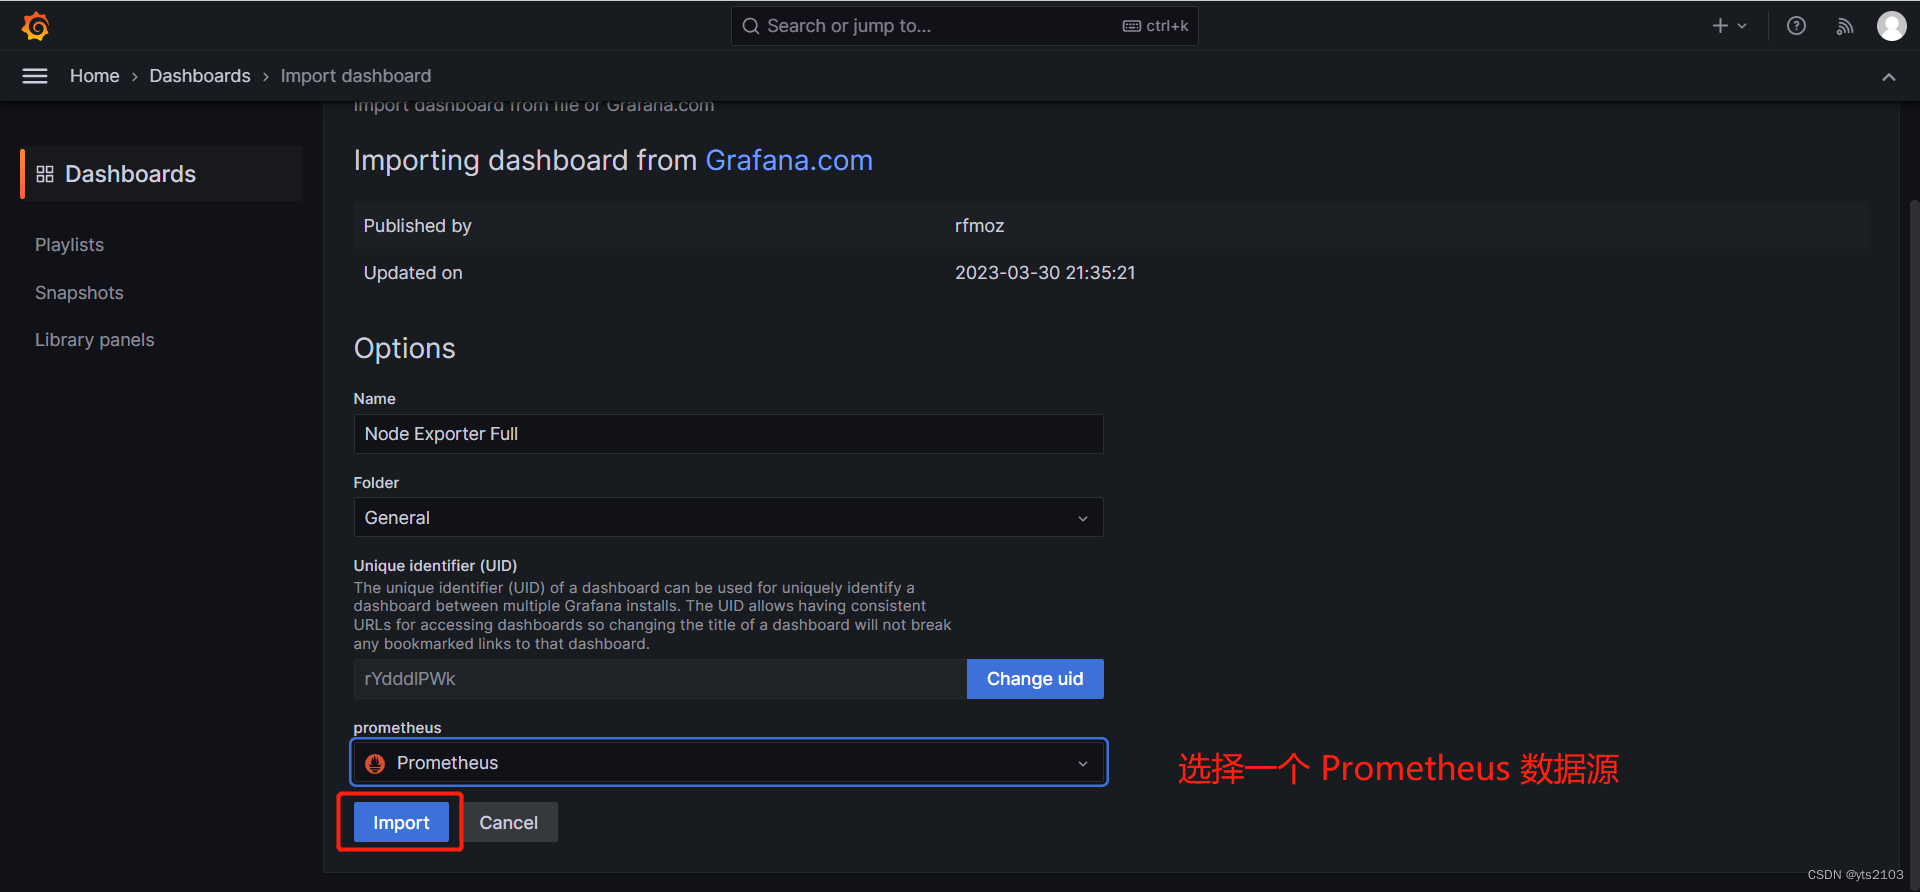
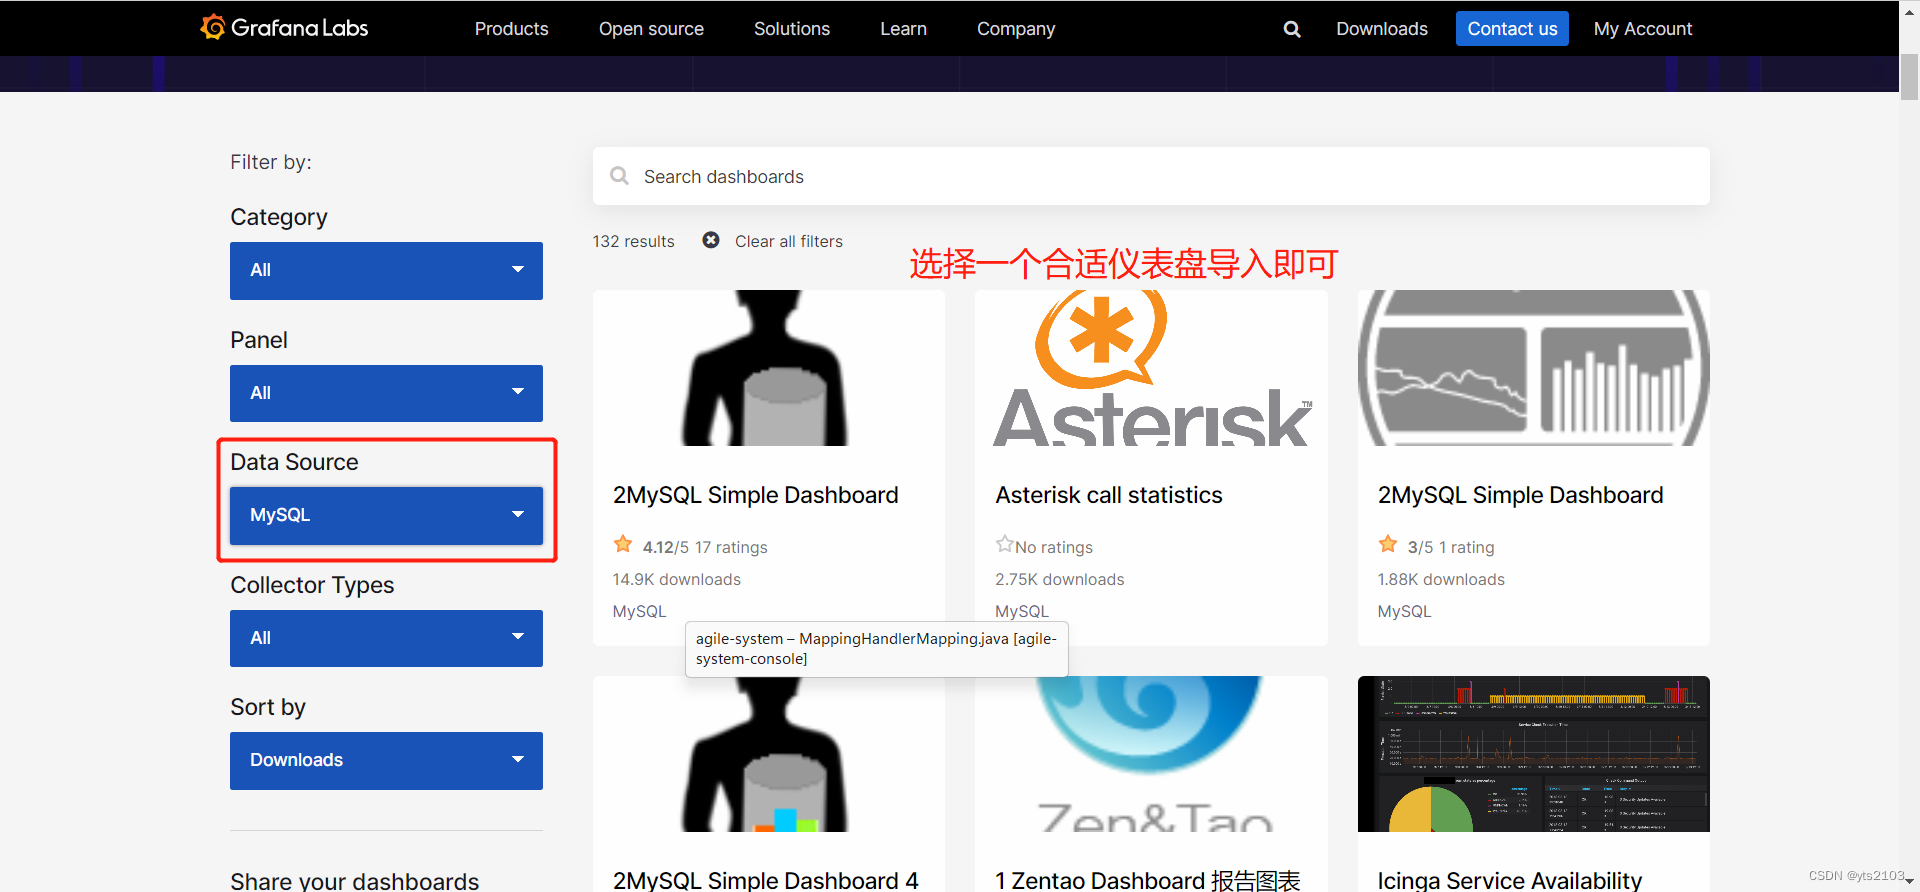
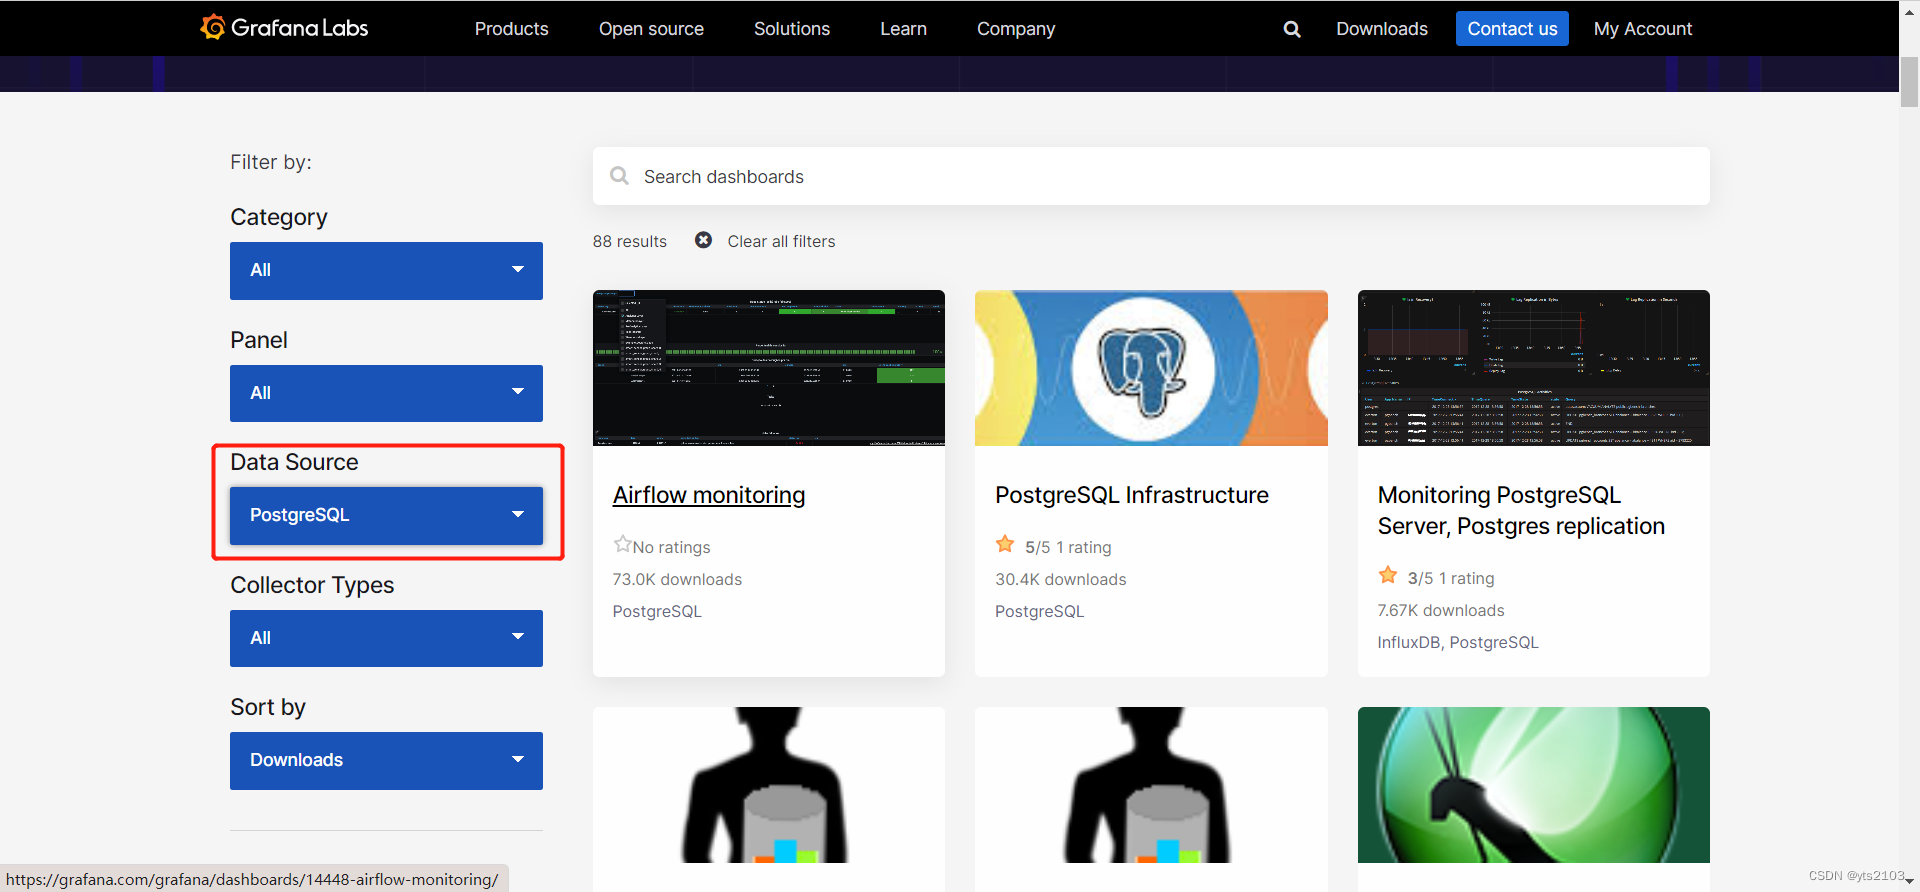
https://grafana.com/grafana/dashboards 选择合适的仪表盘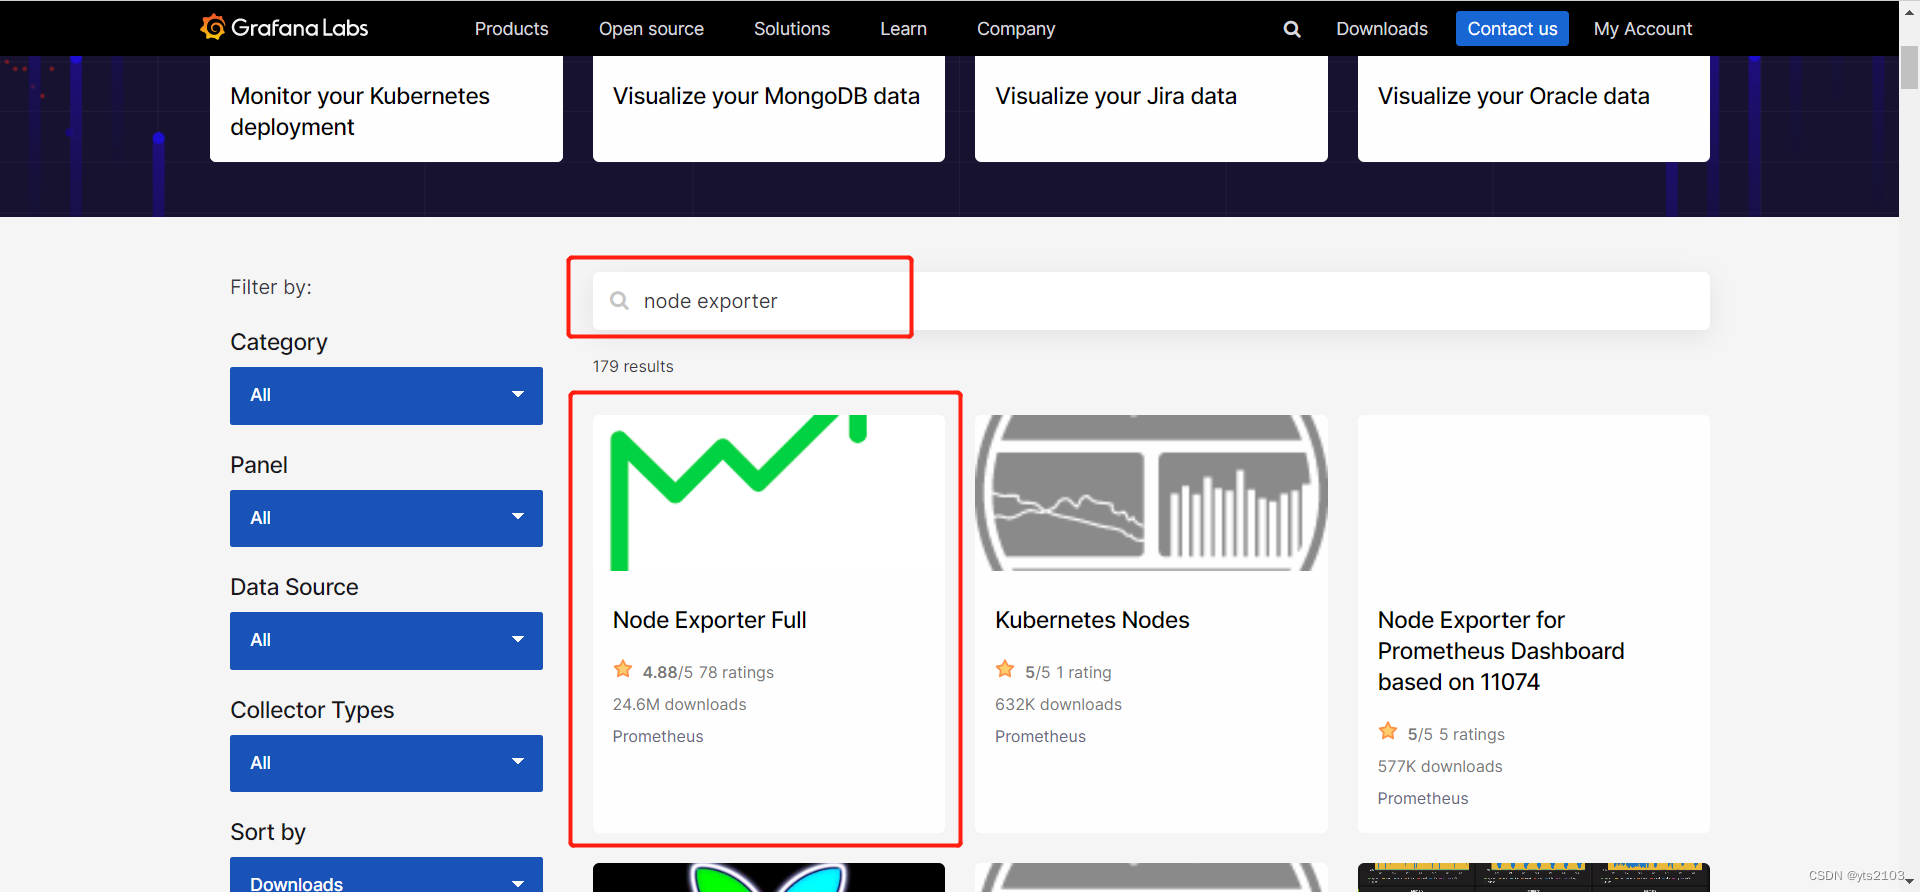
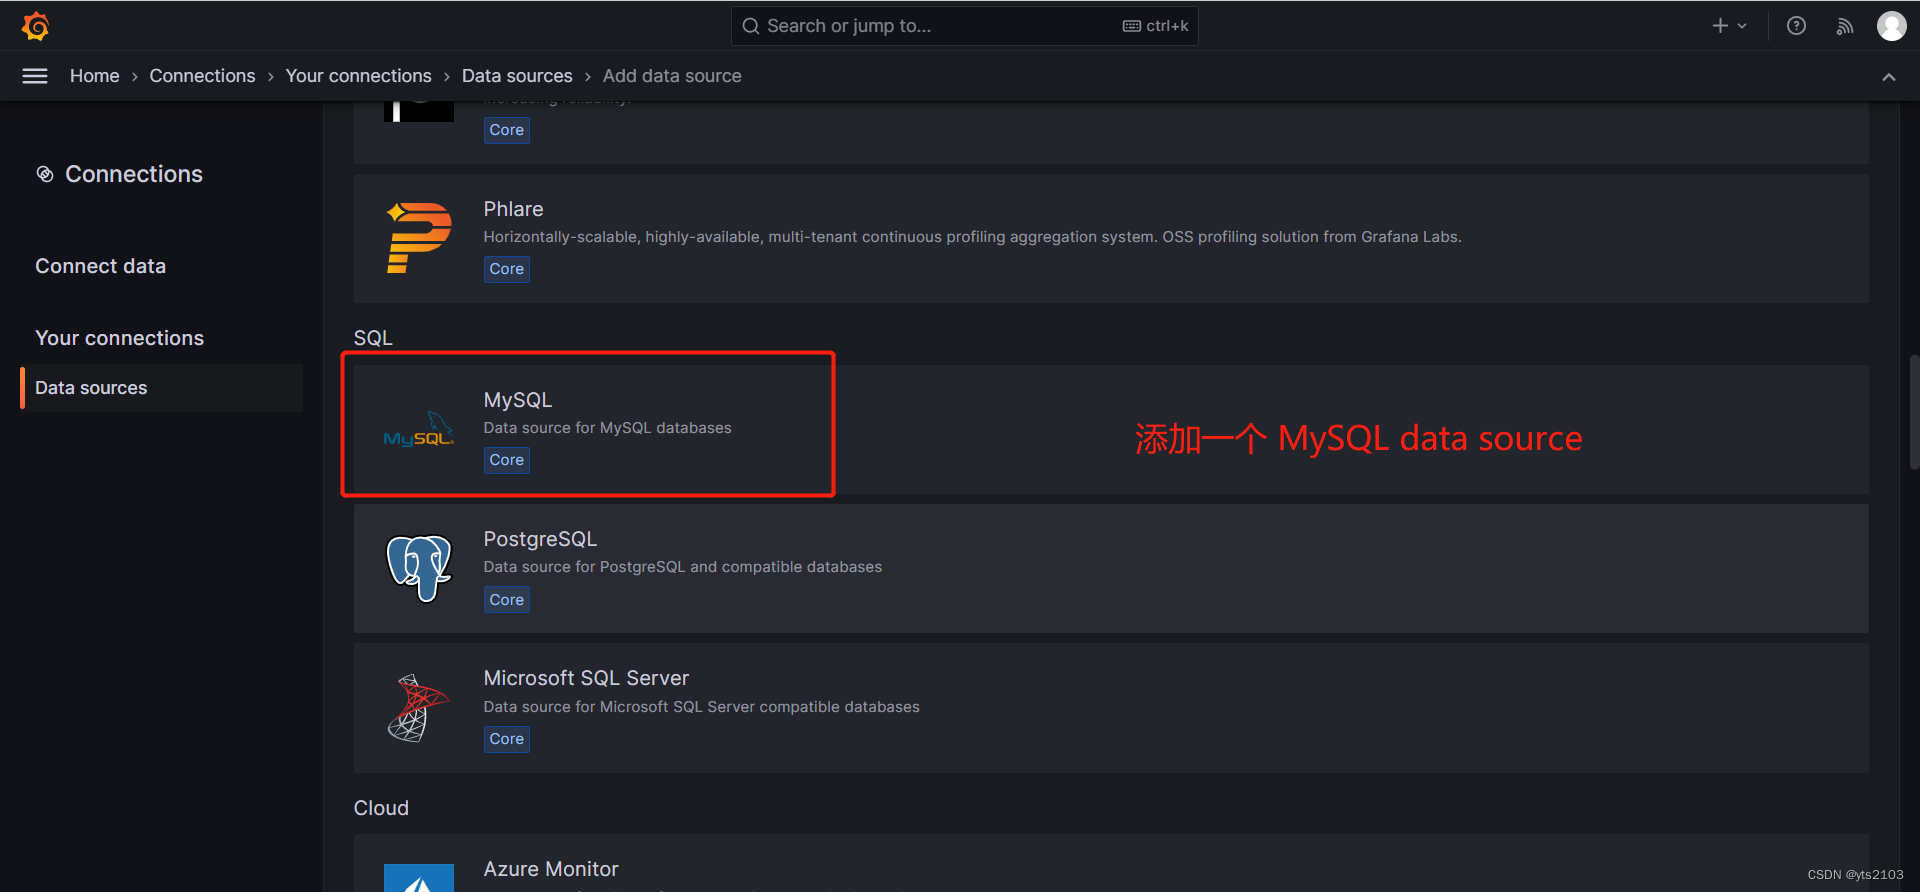
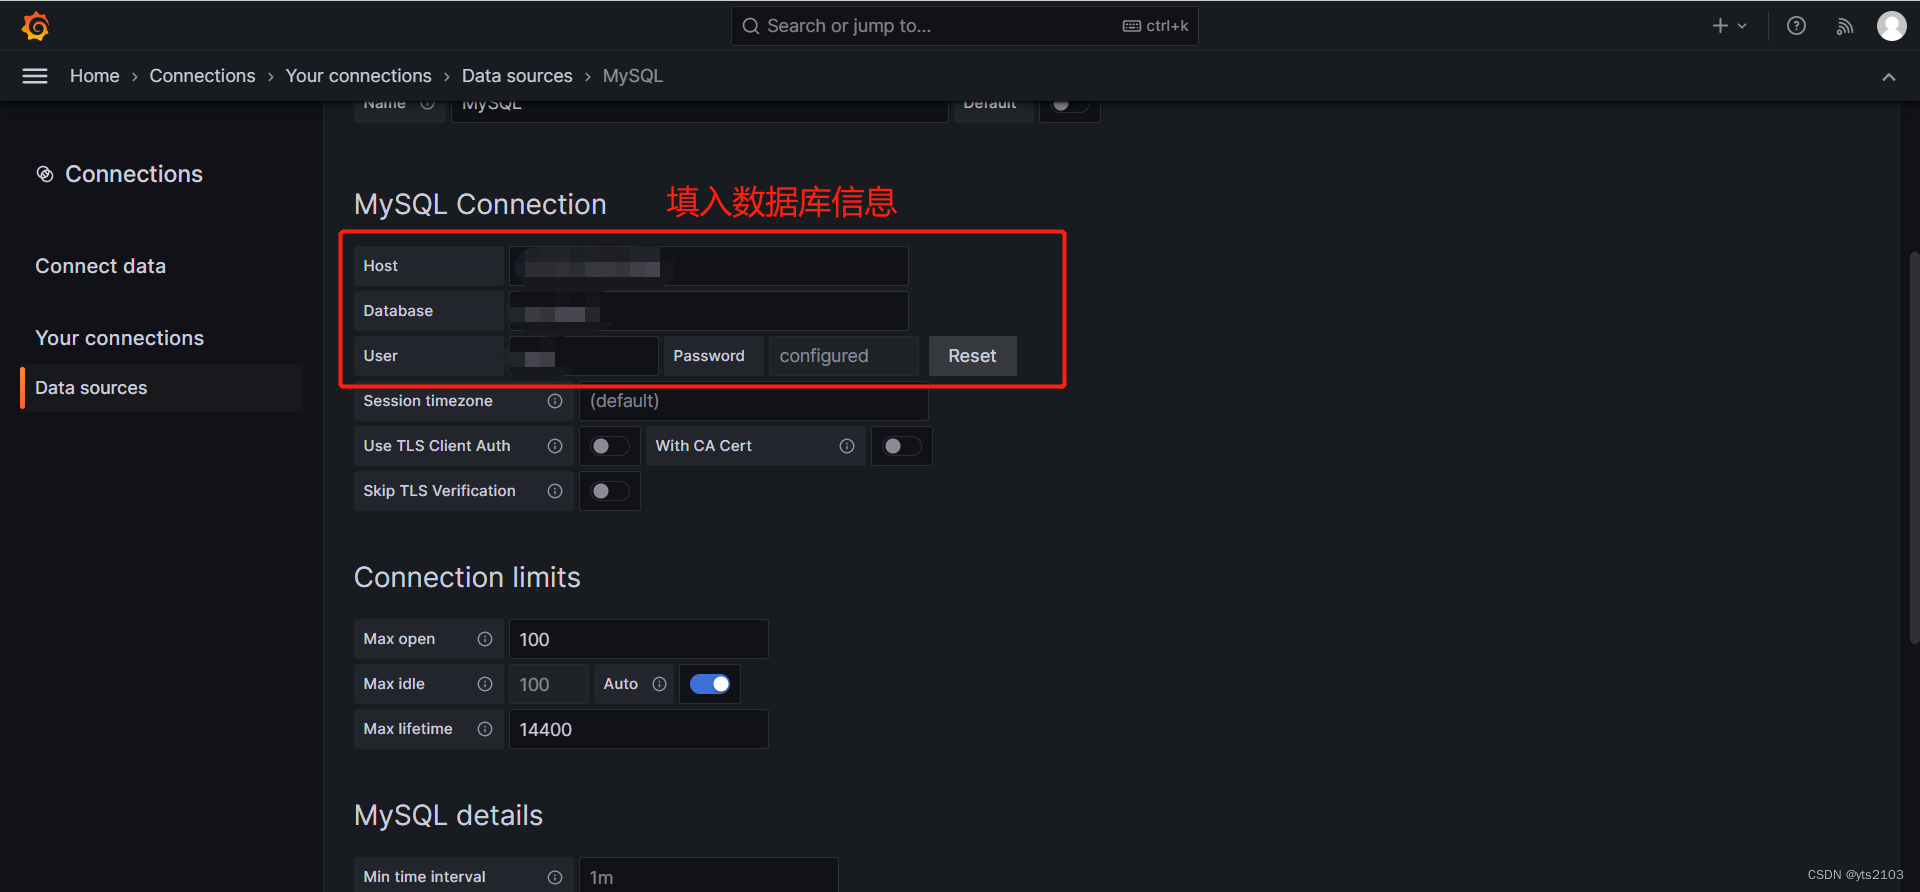
2、 MySQL
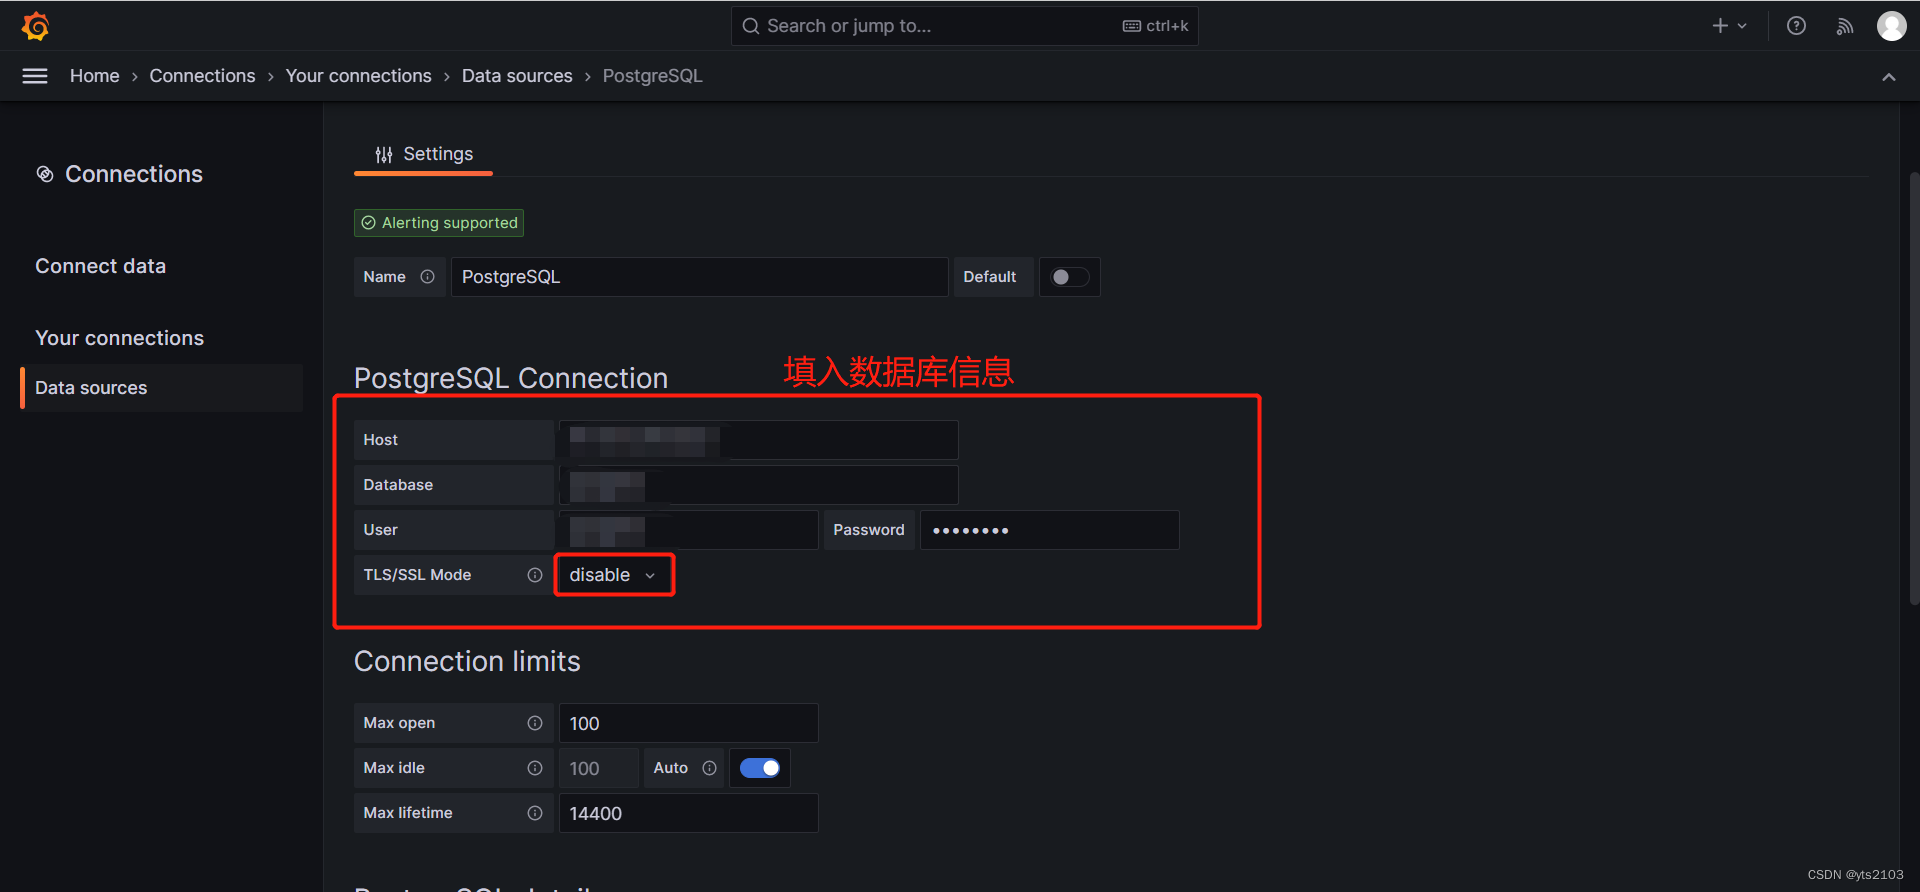
3、PostgreSQL
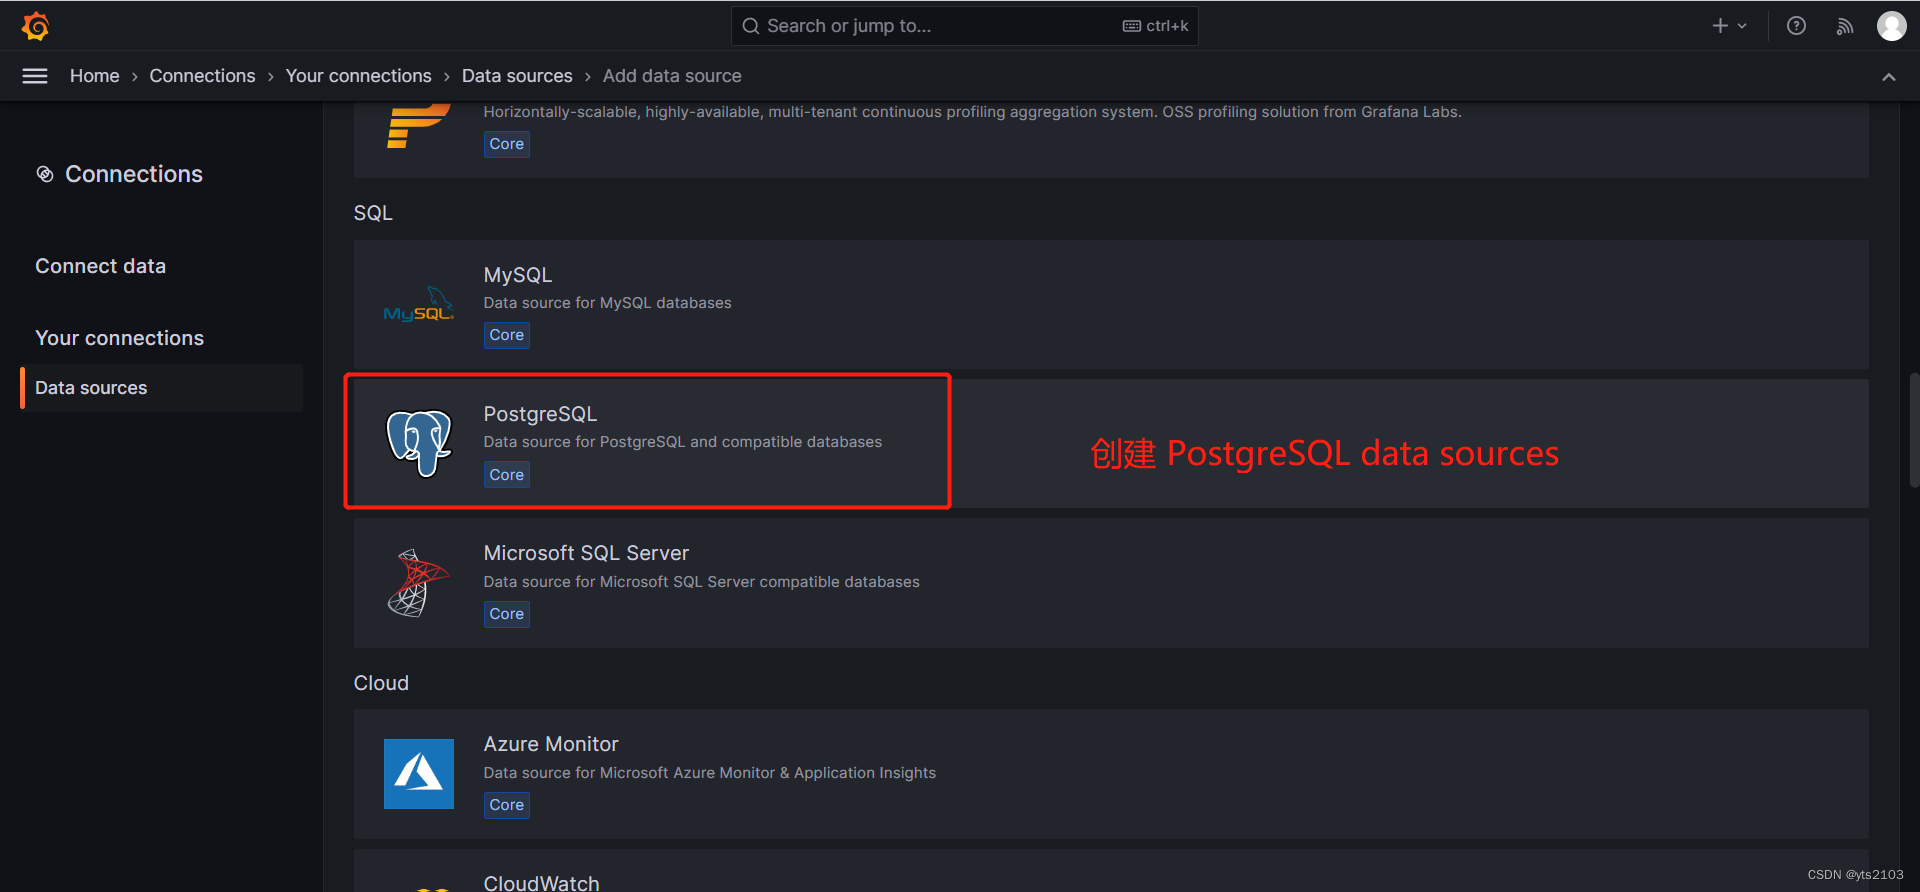


 3591
3591

 被折叠的 条评论
为什么被折叠?
被折叠的 条评论
为什么被折叠?
 到【灌水乐园】发言


