


文章目录
grafana
安装参考 https://grafana.com/grafana/download?pg=get&platform=linux&plcmt=selfmanaged-box1-cta1
快速开始 https://grafana.com/docs/grafana/latest/getting-started/getting-started/
安装
Red Hat, CentOs , RPM安装参考
# 下载安装
wget https://dl.grafana.com/oss/release/grafana-8.0.6-1.x86_64.rpm
sudo yum install grafana-8.0.6-1.x86_64.rpm

# 启动停止管理
sudo systemctl daemon-reload
sudo systemctl start grafana-server
sudo systemctl status grafana-server

# 将 Grafana 服务器配置为在引导时启动:
sudo systemctl enable grafana-server
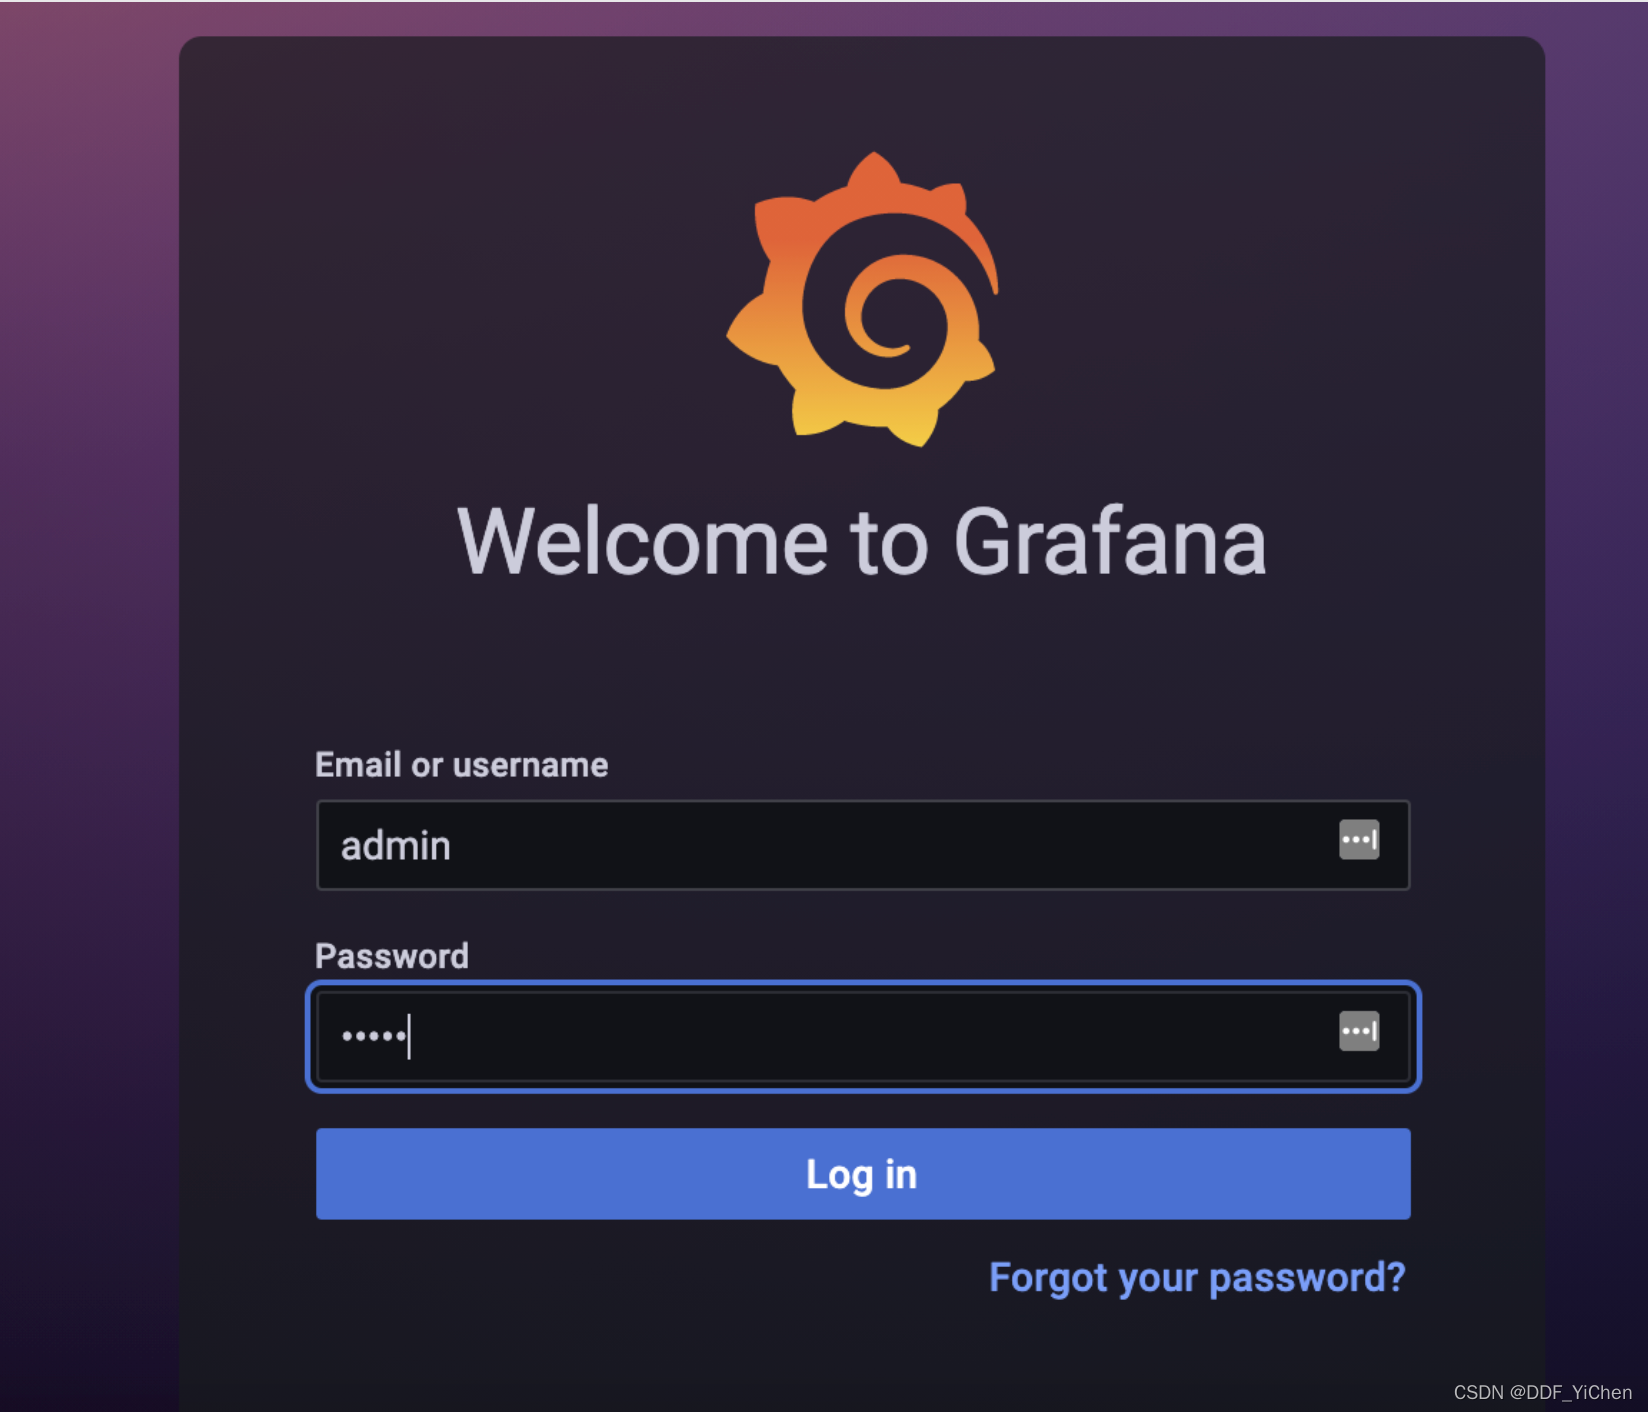
启动
默认使用3000端口, 用户名和密码默认admin,登陆后修改密码
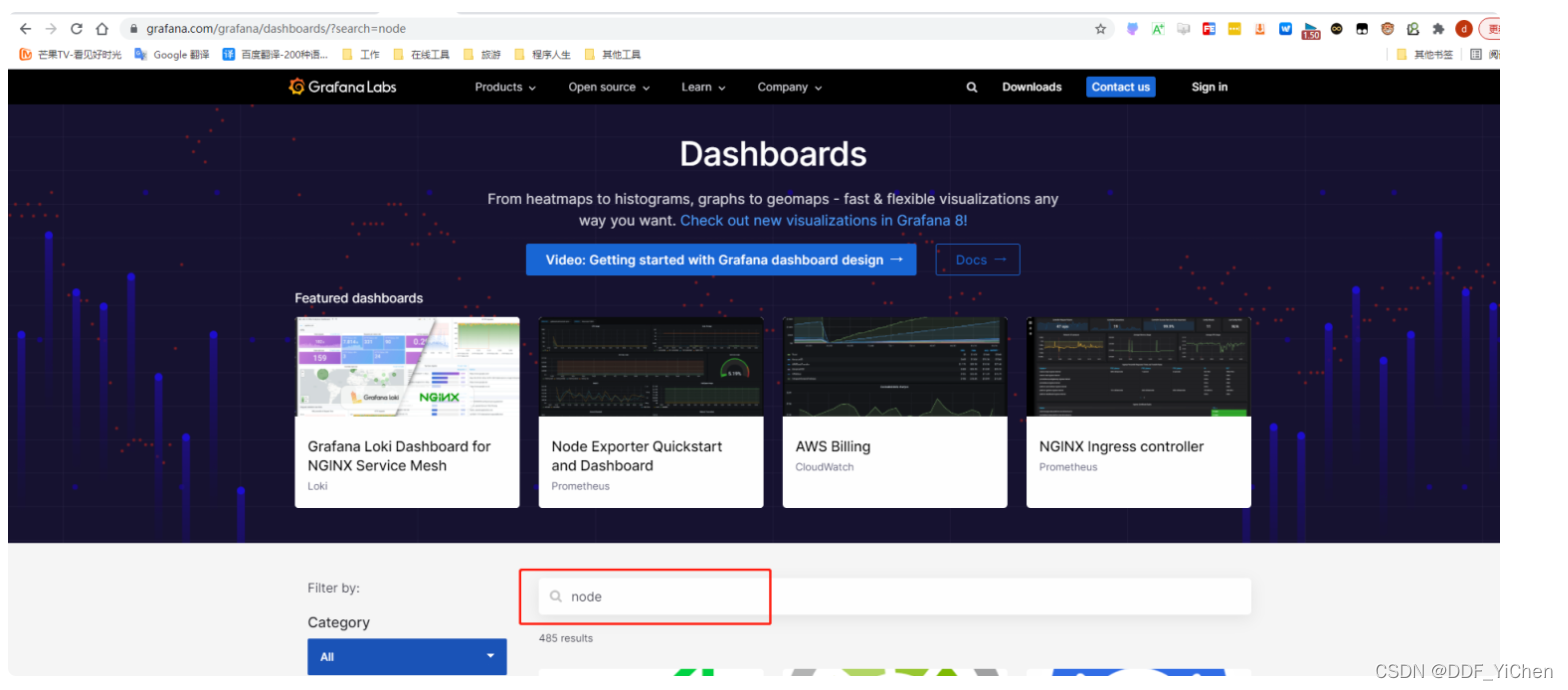
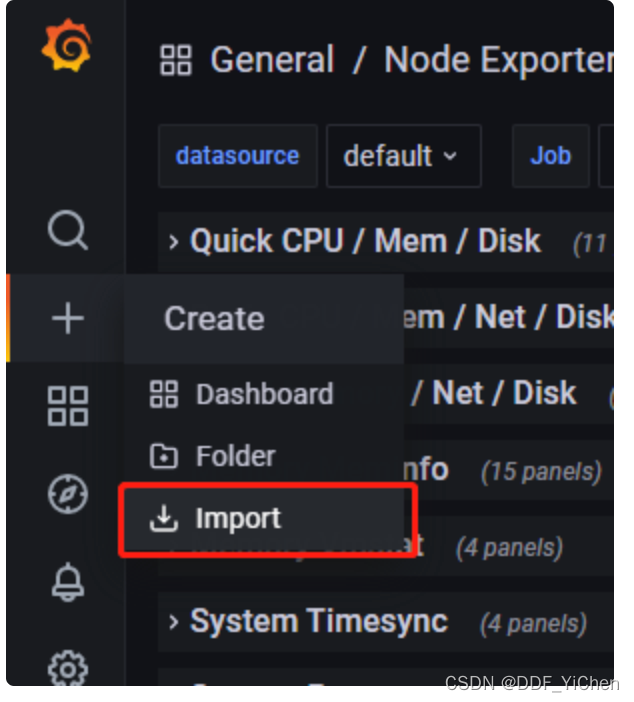
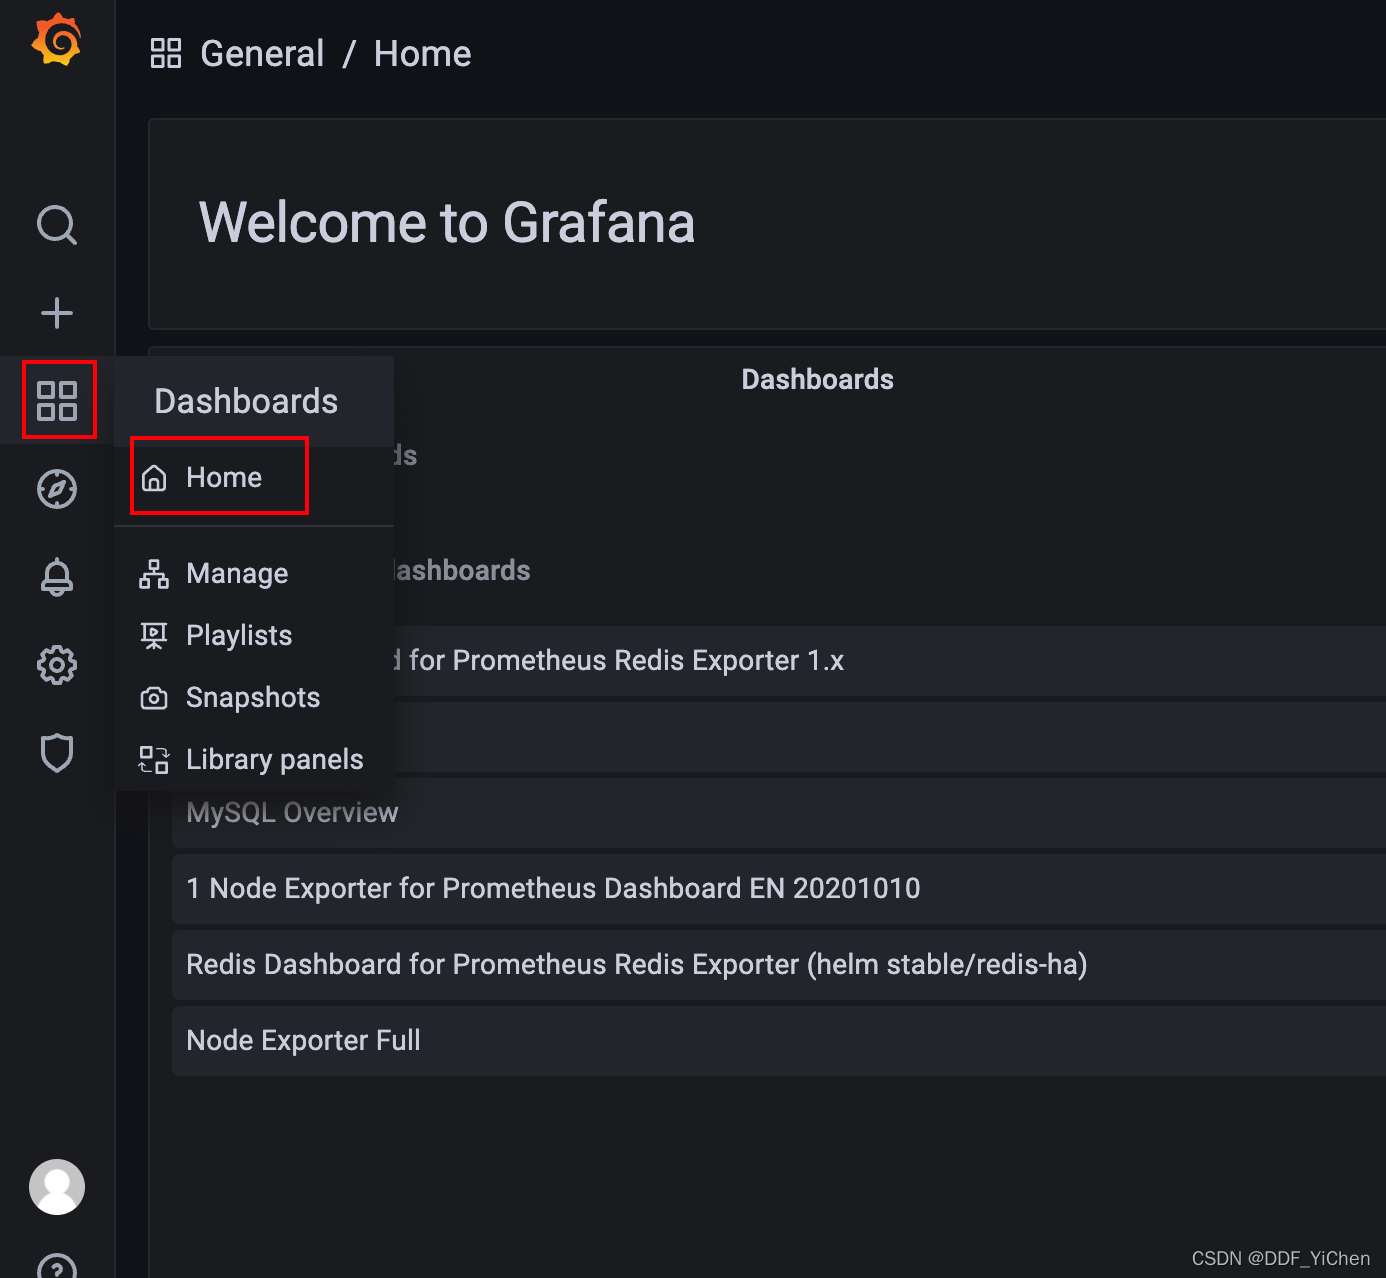
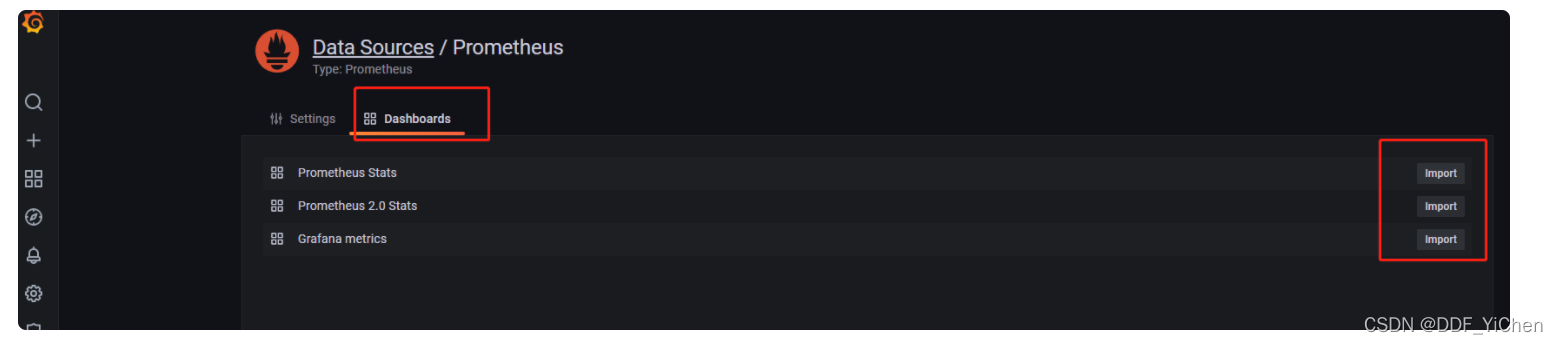
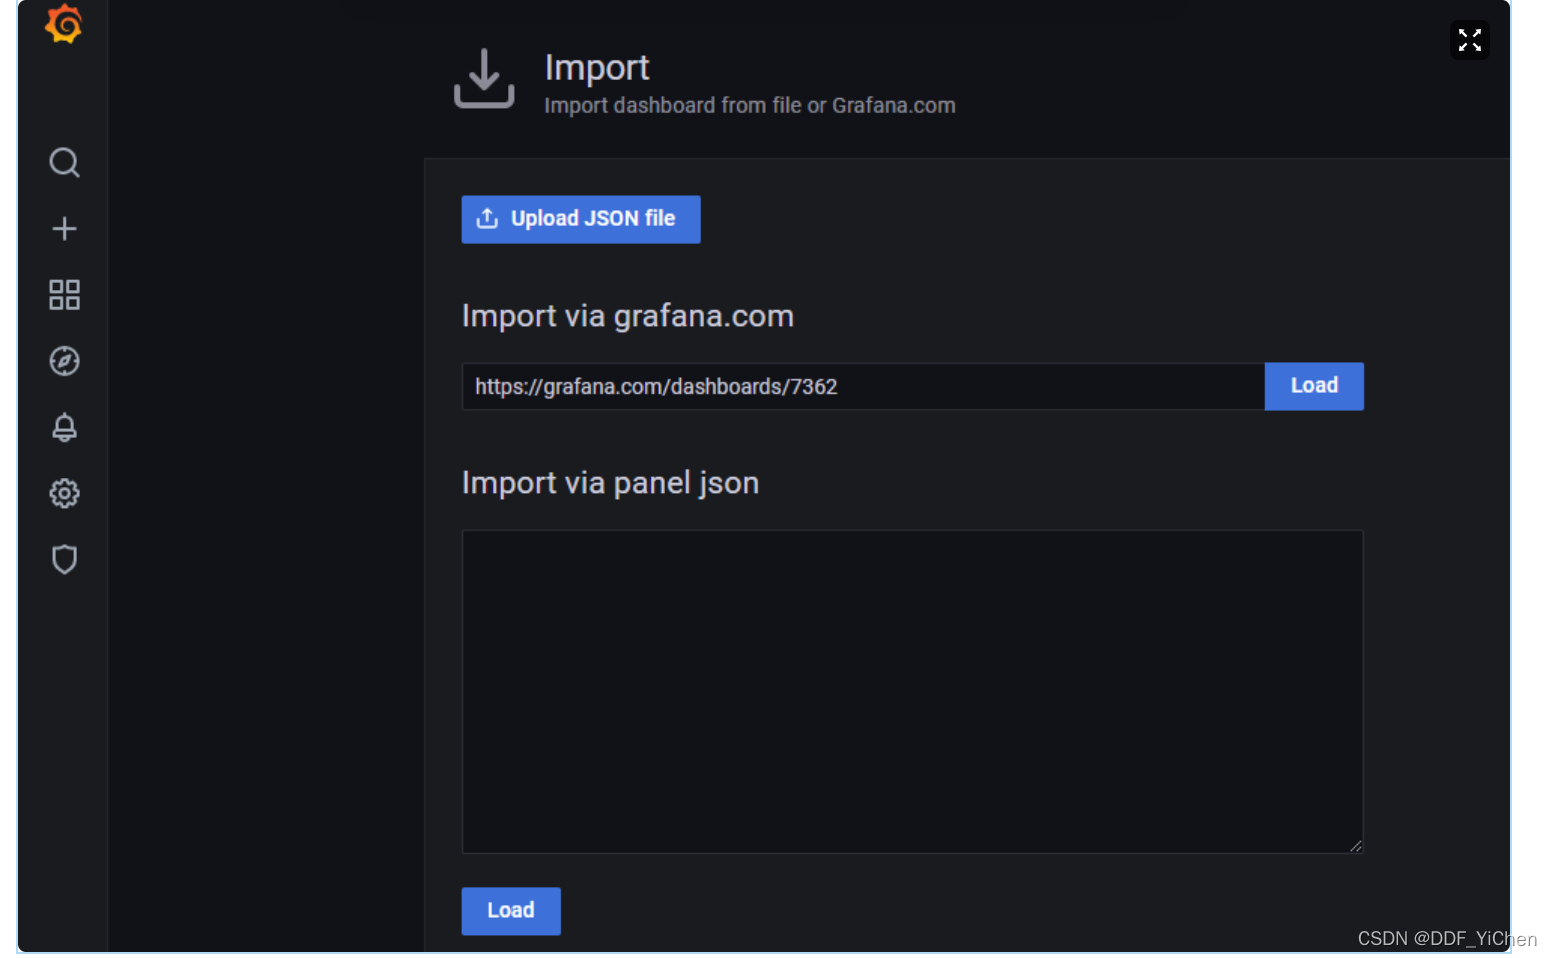
如何导入需要的dashboard
可以在线搜索需要的监控大盘,然后导入即可。

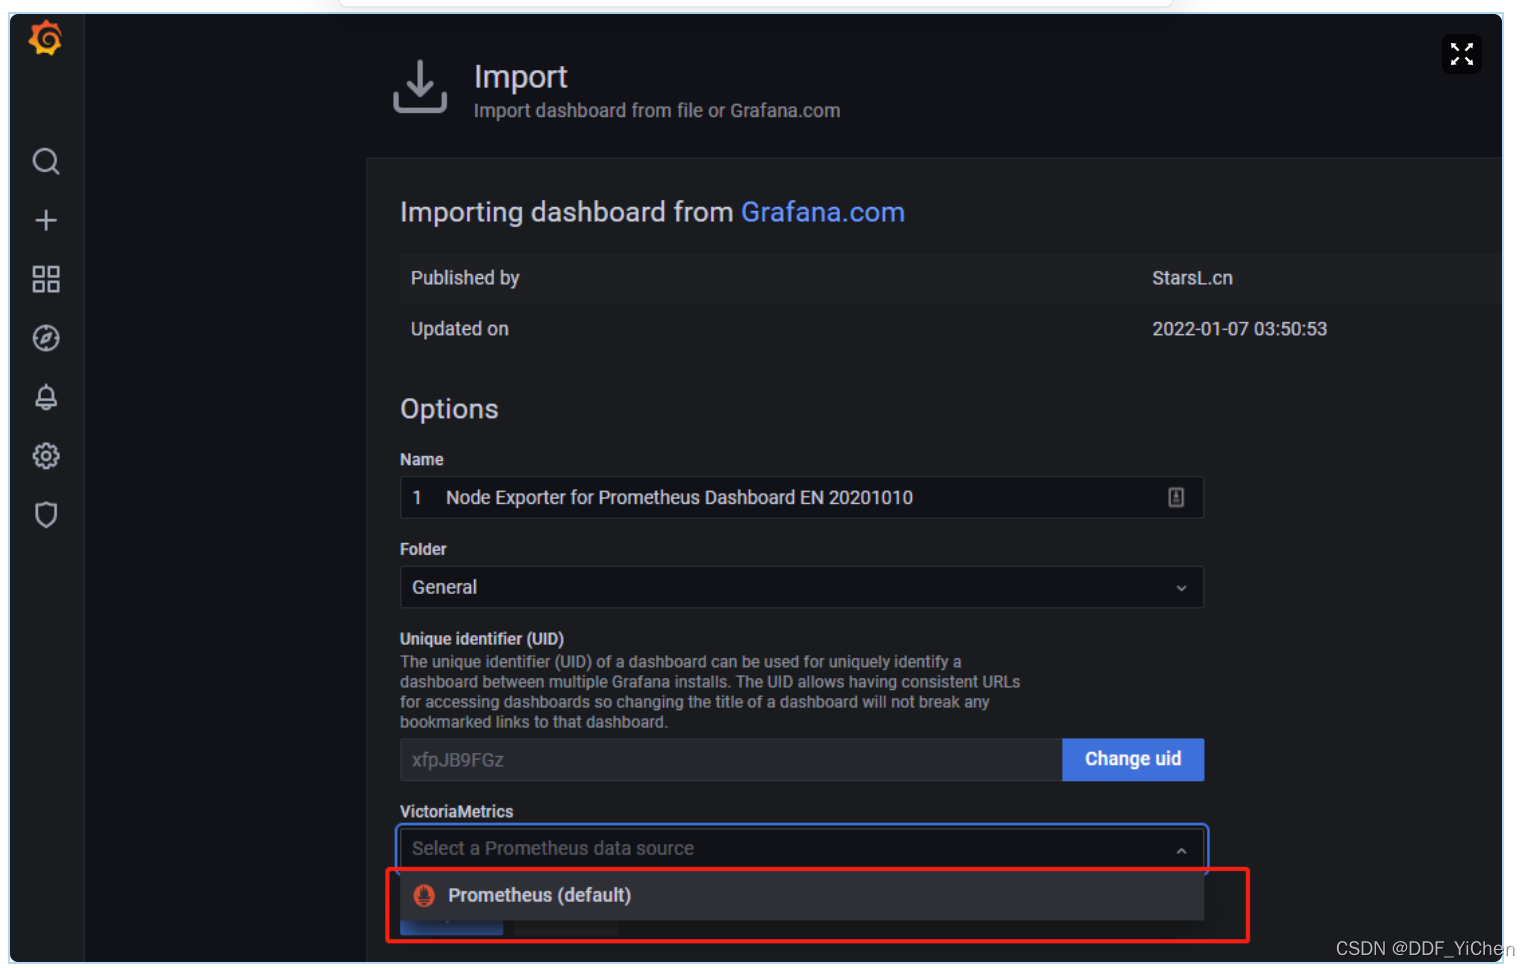
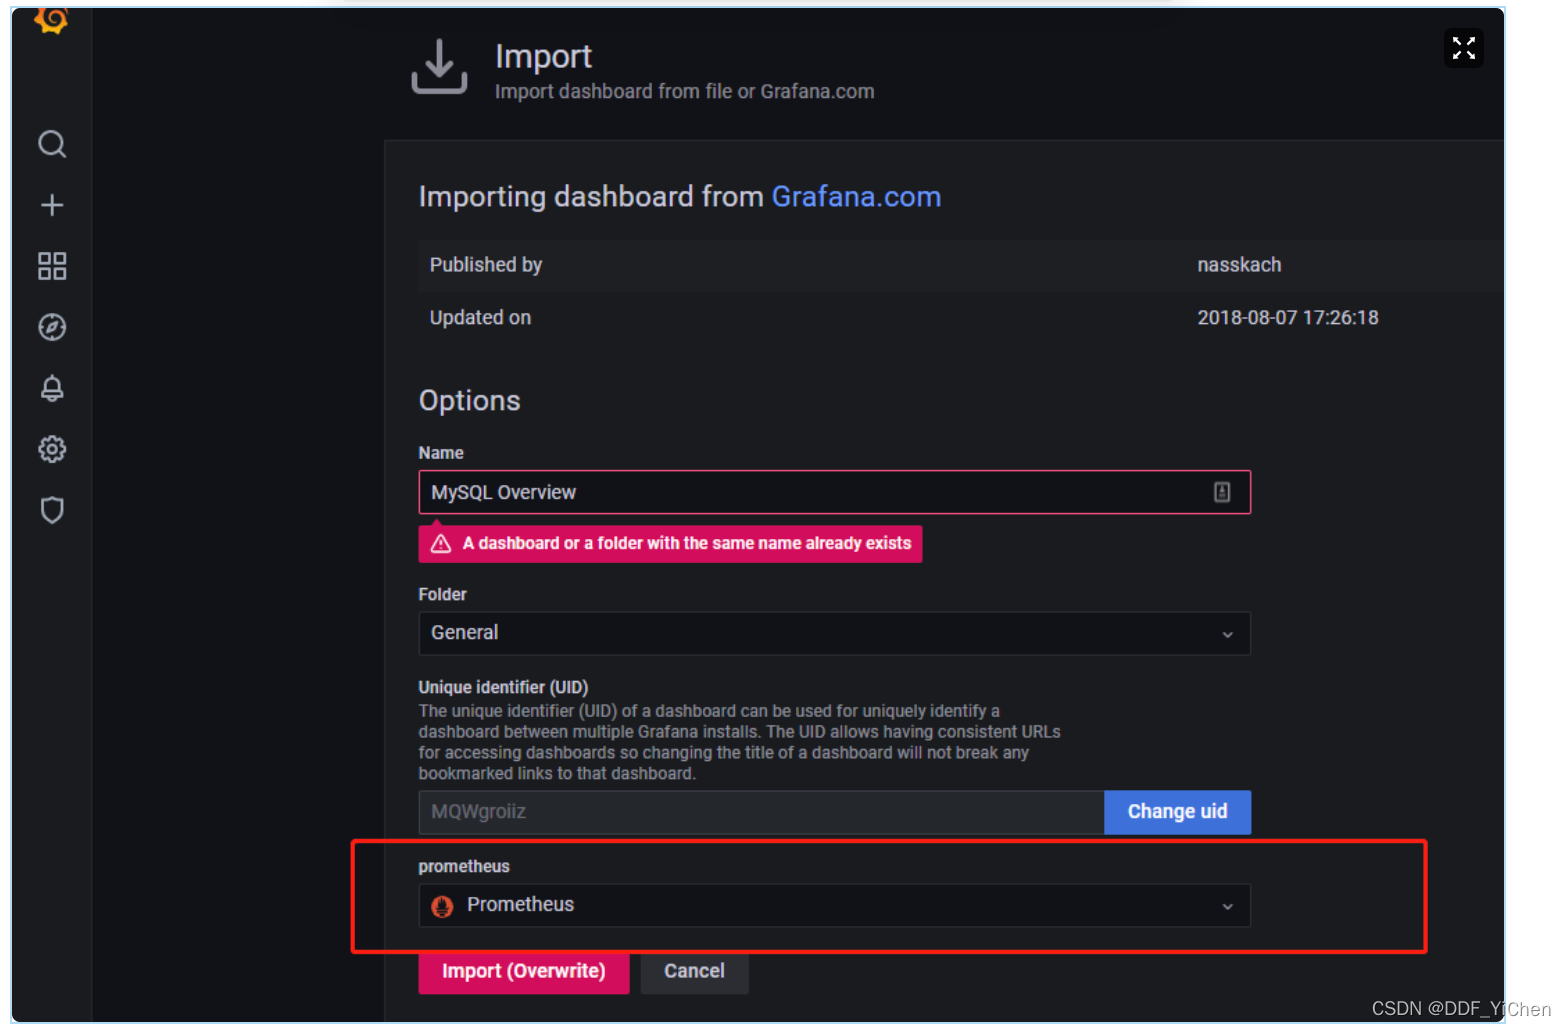
导入选择数据源,至于这个prometheus数据源怎么出来的,后面介绍,因为后面加监控都必须加监控大盘,这里提前说怎么搜索添加大盘
这样一个大盘就添加好了,然后回到dashboard主页就能看到新添加的dashboard了
prometheus
安装
到下载页面下载对应平台和版本的压缩包
mkdir -p /opt/promutheus
cd /opt/promutheus
# 配合github的加速插件获取下载的加速地址
wget https://github.91chi.fun//https://github.com//prometheus/prometheus/releases/download/v2.33.5/prometheus-2.33.5.linux-amd64.tar.gz
tar -zxvf prometheus-2.33.5.linux-amd64.tar.gz
cd prometheus-2.33.5.linux-amd64/
# 后台启动
nohup ./prometheus &
为了方便管理进程,使用supervisor来管理prometheus进程的配置文件,不使用的话用上面的命令启动也行
; 这个是注释标识
[program:prometheus]; 进程名
command=/opt/prometheus/prometheus-2.33.5.linux-amd64/./prometheus
; 生成子进程时的工作目录
directory=/opt/prometheus/prometheus-2.33.5.linux-amd64/
; 自动重启
autostart=true
autorestart=true
; 用哪个用户启动
; user=
; 日志文件
stdout_logfile=/opt/prometheus/prometheus-2.33.5.linux-amd64/prometheus.log
; 重定向错误日志到stdout
redirect_stderr=true
; 日志级别
loglevel=info
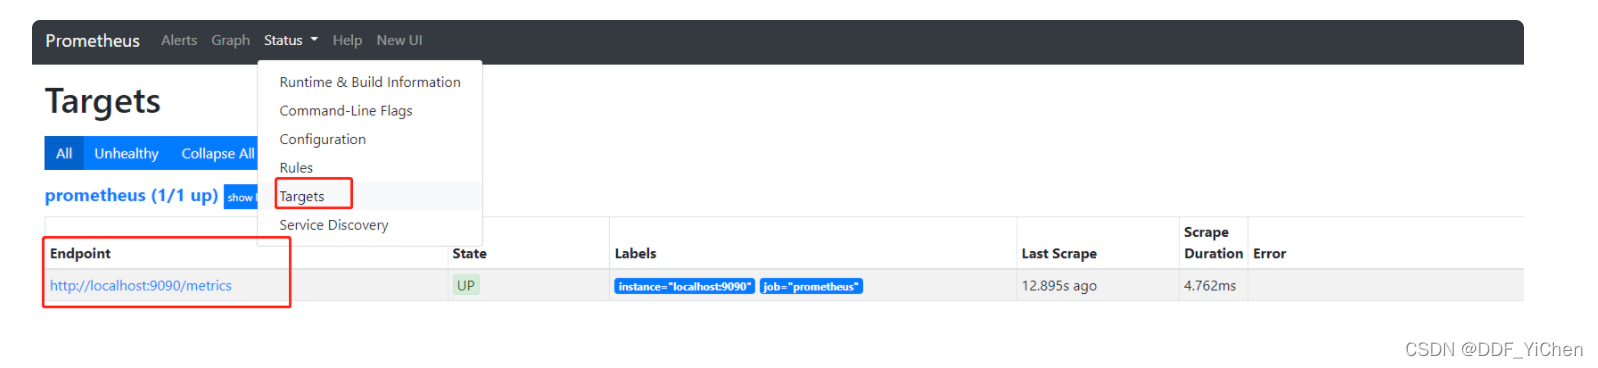
访问http://localhost:9090/ 进入到默认界面
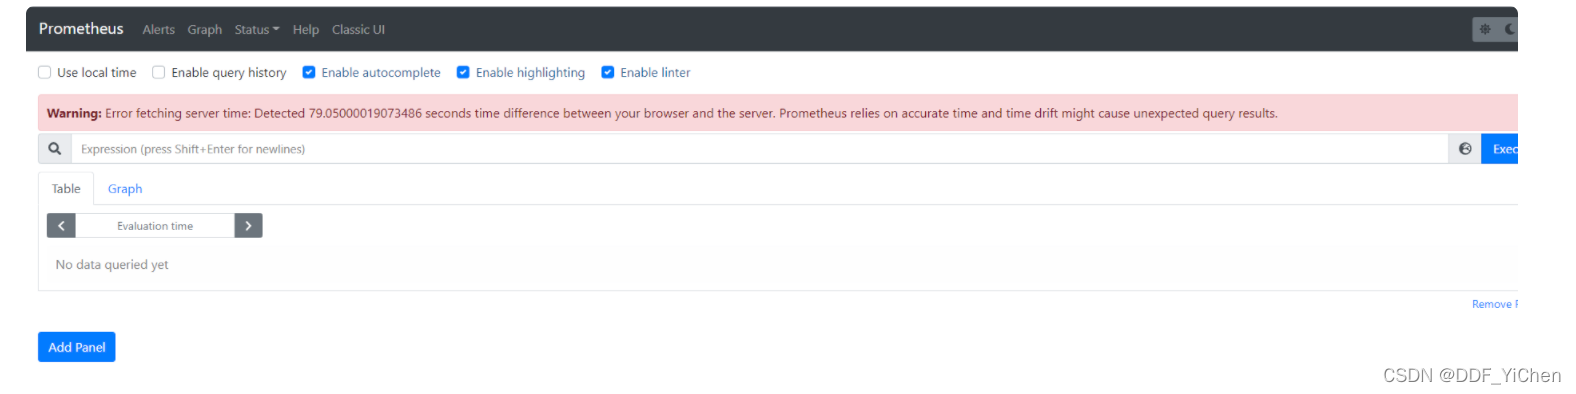
访问http://localhost:9090/metrics 查看所有监控指标,后面添加的exporter都可以在此查看
集成grafana
在grafana界面中添加prometheus的datasource,填写上面的访问地址localhost:9090, 其他默认即可。<br /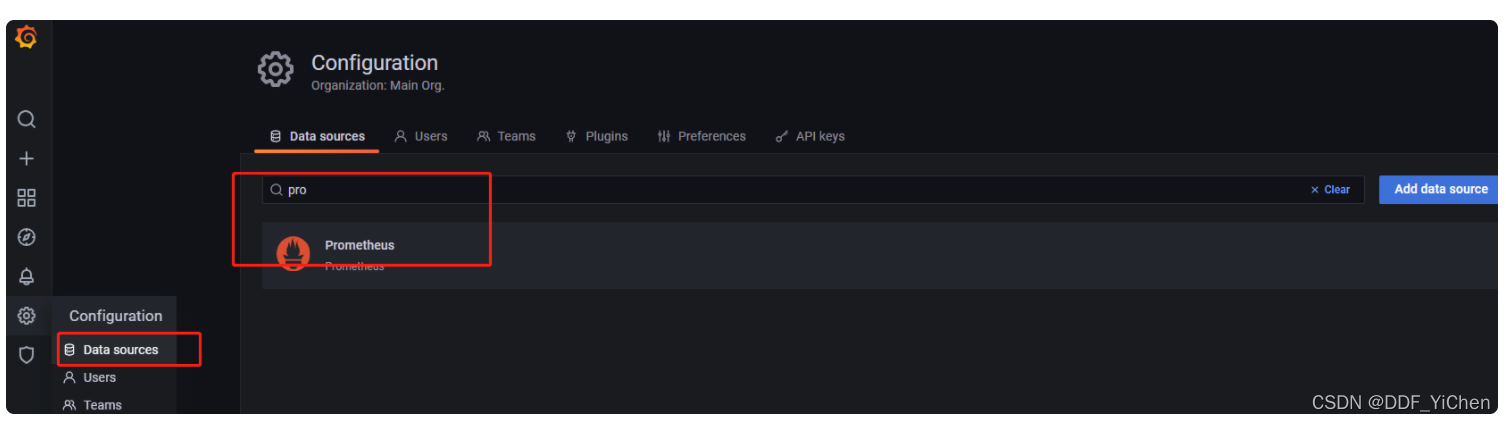
切换到Dashboards界面,导入prometheus的监控大盘
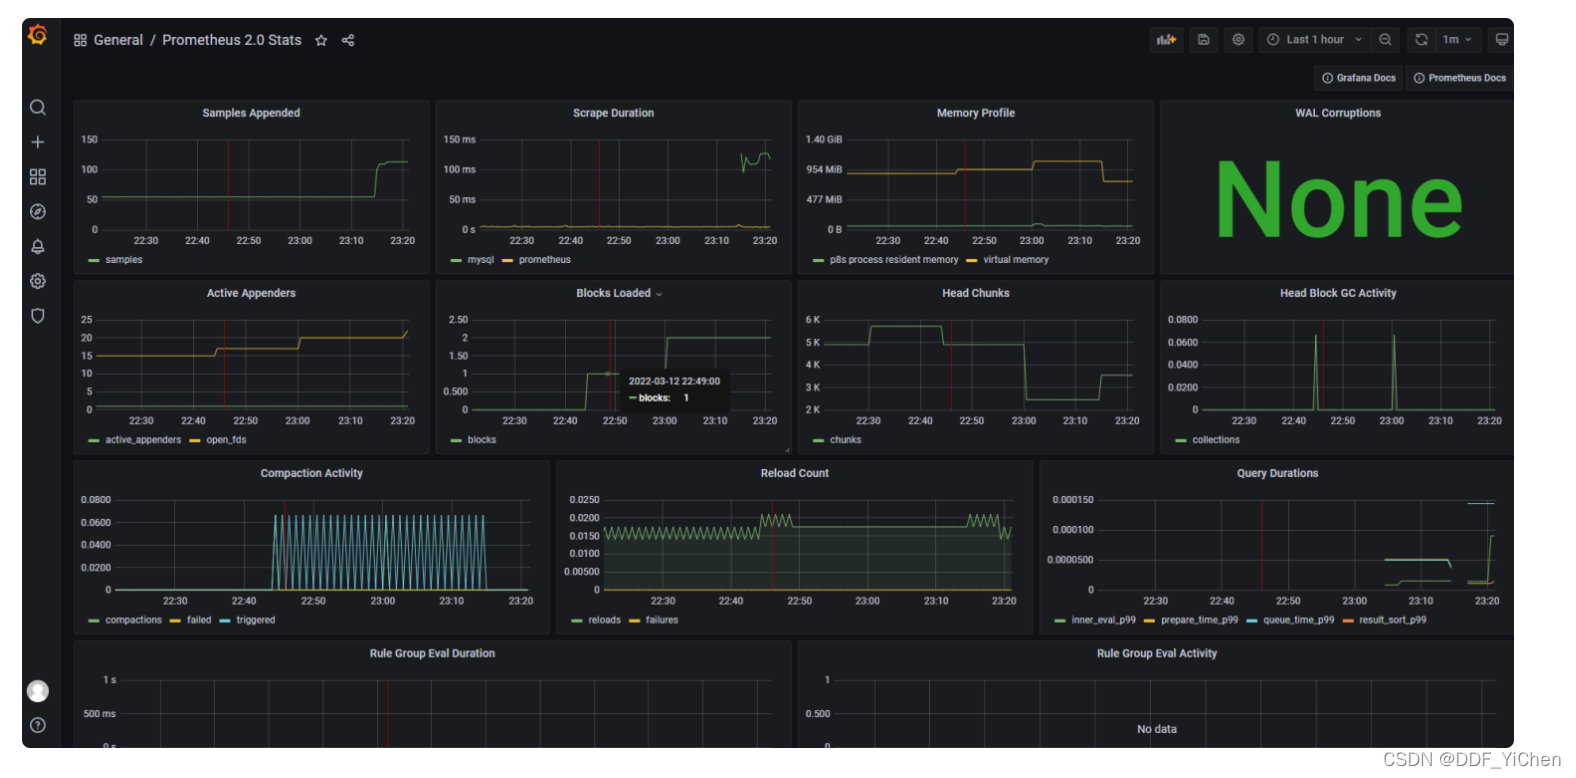
然后看到一个特别好看但是不知道干啥用的界面, 到这里prometheus的数据源就添加完成了,后续所有使用的exporter都会将数据拉取到这个数据源里
Exporter
exporter使用Pull的方式将指定监控资源的指标拉取到prometheus数据源中
。
还有一种push的方式,未去了解。
mysqld_exporter
安装配置
mkdir -p /opt/prometheus/exporter
cd /opt/prometheus/exporter
# 配合github的加速插件获取下载的加速地址
wget https://github.91chi.fun//https://github.com//prometheus/mysqld_exporter/releases/download/v0.14.0/mysqld_exporter-0.14.0.linux-amd64.tar.gz
tar -zxvf mysqld_exporter-0.14.0.linux-amd64.tar.gz
创建账号
CREATE USER 'exporter'@'%' IDENTIFIED BY 'password' WITH MAX_USER_CONNECTIONS 3;
GRANT PROCESS, REPLICATION CLIENT, SELECT ON *.* TO 'exporter'@'%';
- 使用环境变量方式配置一下数据库连接认证信息并启动 Exporter
export DATA_SOURCE_NAME='exporter:password@(localhost:3306)/'
cd /opt/prometheus/exporter/mysqld_exporter-0.14.0.linux-amd64
nohup ./mysqld_exporter &
- 使用配置文件,在当前机器
~/.my.cnf配置文件中增加配置信息,注意修改自己实际情况参数。注意这个.my.cnf在exporter所在机器创建就行,和mysql实际自己的配置文件my.cnf没有一点关系
[client]
   host=106.75.227.xxx
   port=3306
   user=exporter
   password=xxxxx
使用supervisor来管理进程的配置文件
; 这个是注释标识
[program:mysqld_exporter]; 进程名
command=/opt/prometheus/exporter/mysqld_exporter-0.14.0.linux-amd64/./mysqld_exporter
; 生成子进程时的工作目录
directory=/opt/prometheus/exporter/mysqld_exporter-0.14.0.linux-amd64/
; 自动重启
autostart=true
autorestart=true
; 用哪个用户启动
; user=
; 日志文件
stdout_logfile=/opt/prometheus/exporter/mysqld_exporter-0.14.0.linux-amd64/mysqld_exporter.log
; 重定向错误日志到stdout
redirect_stderr=true
; 日志级别
loglevel=info
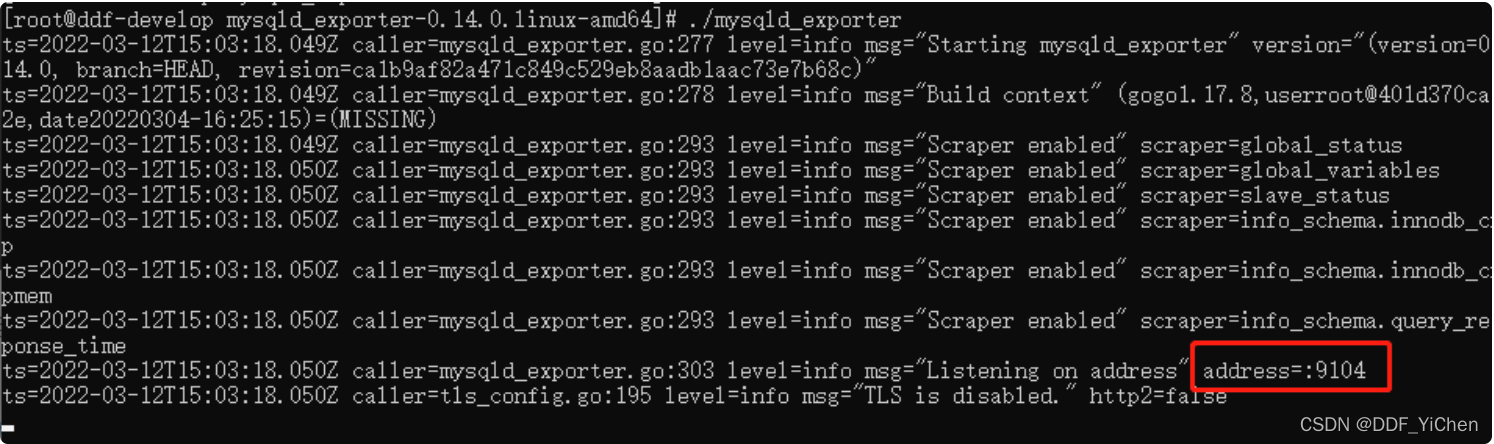
export启动成功后,注意控制台输出,默认端口是9104, 访问localhost:9104/metrics 即可查看mysql相关指标
修改Prometheus的配置文件prometheus.yml 增加 mysql 相关 exporter job
cd /opt/prometheus/prometheus-2.33.5.linux-amd64
vim prometheus.yml
alerting:
  alertmanagers:
    - static_configs:
        - targets:
          # - alertmanager:9093

# Load rules once and periodically evaluate them according to the global 'evaluation_interval'.
rule_files:
  # - "first_rules.yml"
  # - "second_rules.yml"

# A scrape configuration containing exactly one endpoint to scrape:
# Here it's Prometheus itself.
scrape_configs:
  # The job name is added as a label `job=<job_name>` to any timeseries scraped from this config.
  - job_name: "prometheus"

    # metrics_path defaults to '/metrics'
    # scheme defaults to 'http'.

    static_configs:
      - targets: ["localhost:9090"]

  # 增加抓取mysql指标的exporter
  - job_name: 'mysql'
    static_configs:
     - targets: ['localhost:9104']
       labels:
          instance: mysql # 这个会在grafana中显示用
杀掉prometheus的进程,然后重新启动, 进入prometheus的web界面,再次选择targets, 可以看到新加的mysql端点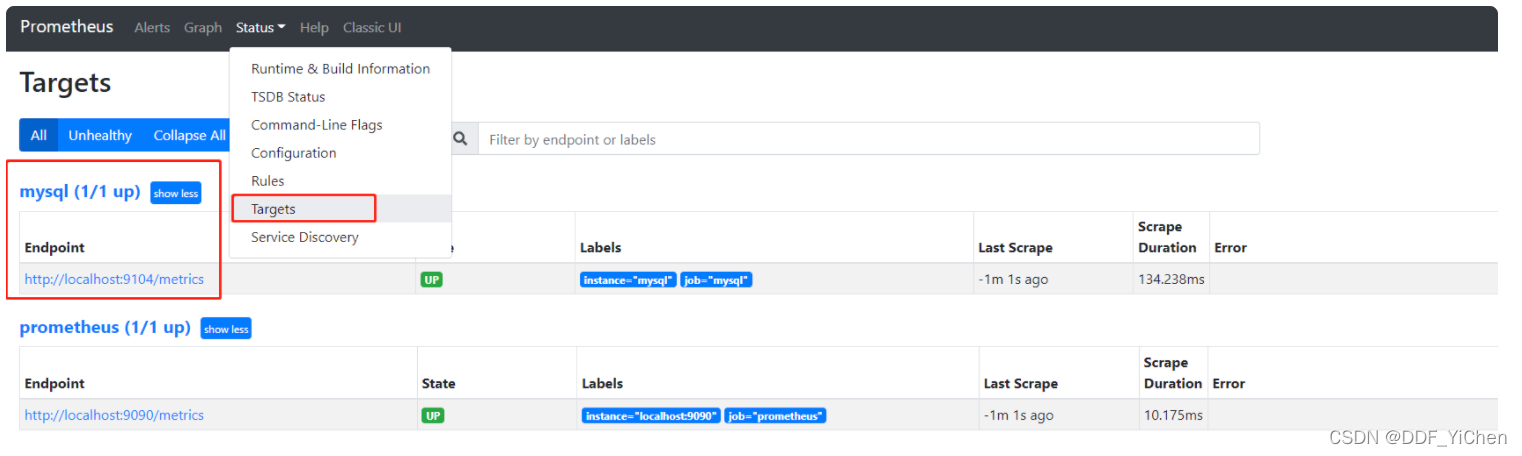
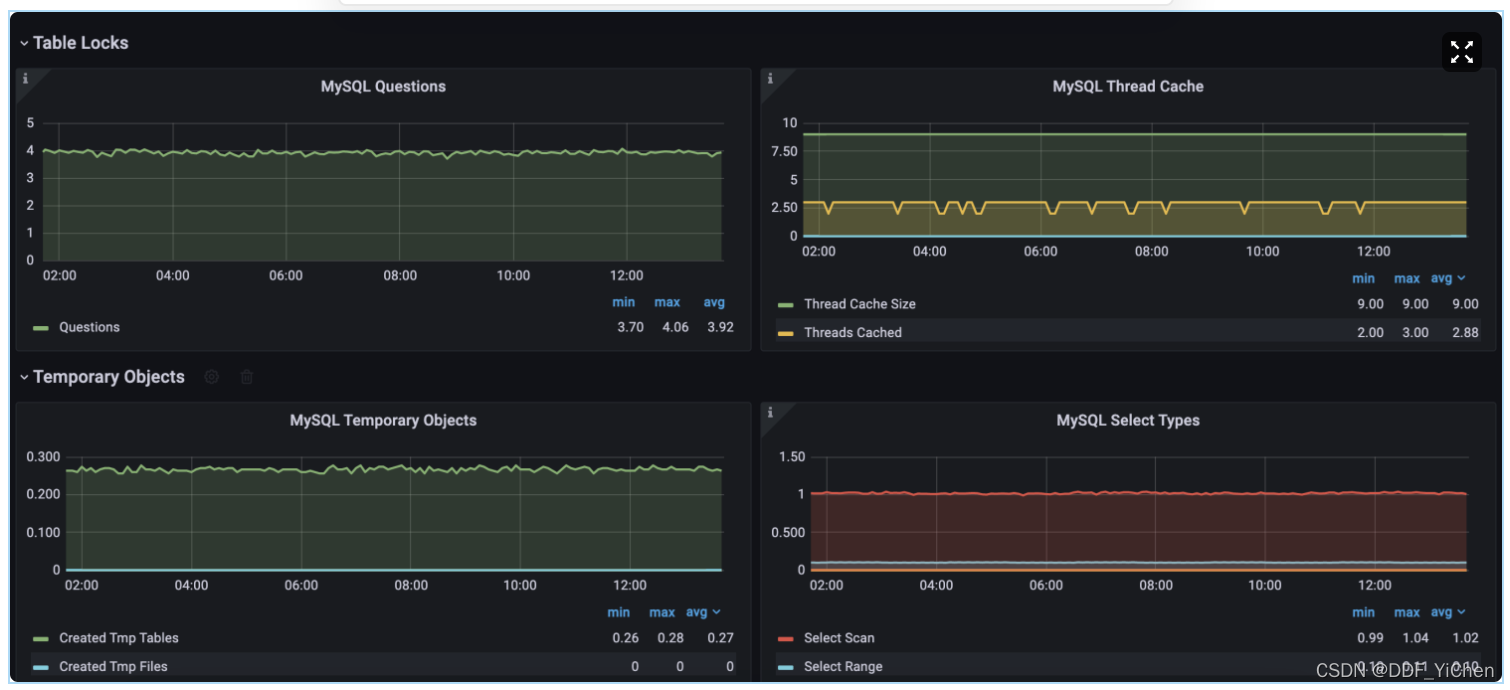
然后导入mysql的监控大盘, 可以自己再grafana官网搜索自己需要的,这里选择的是https://grafana.com/dashboards/7362
效果图如下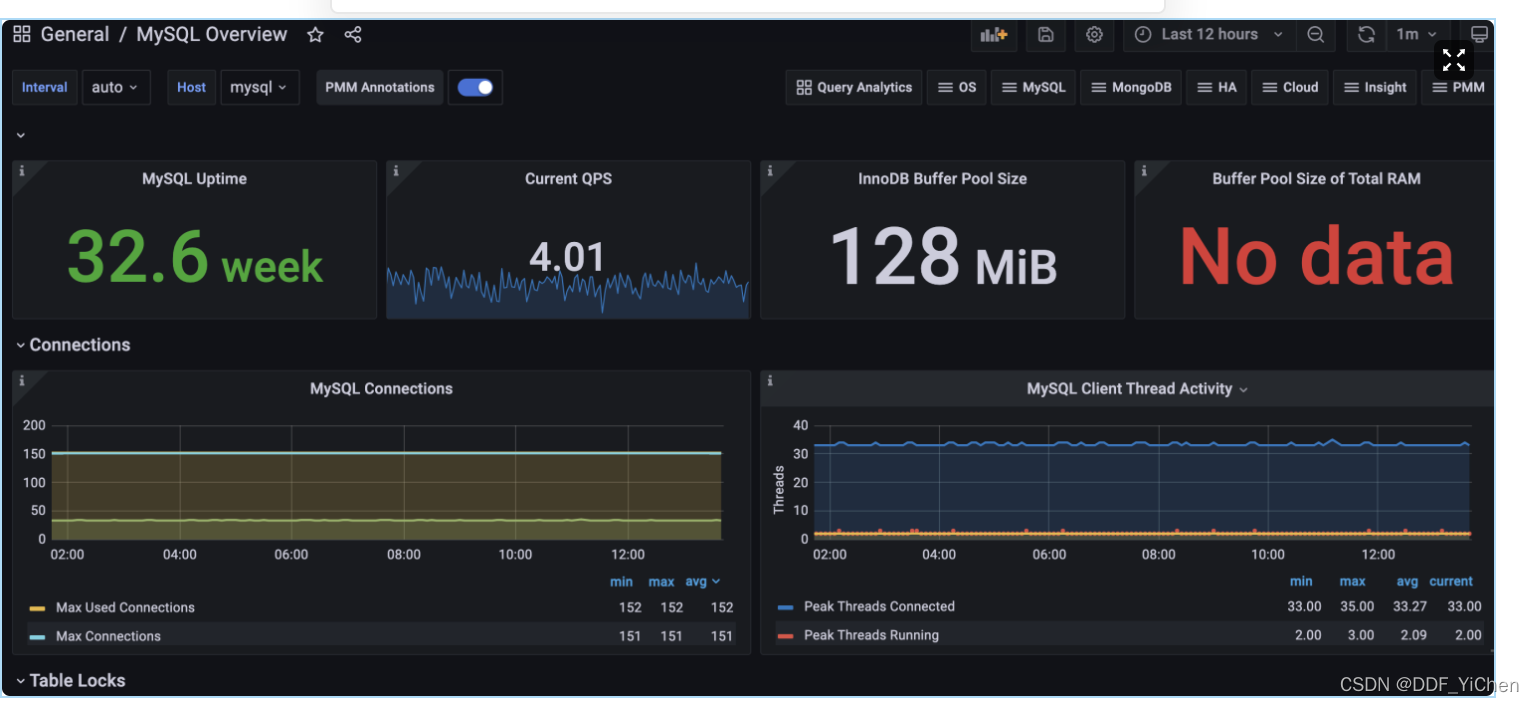
node_exporter
监控主机
mkdir -p /opt/prometheus/exporter/
# 通过加速插件获得的下载地址
wget https://github.91chi.fun//https://github.com//prometheus/node_exporter/releases/download/v1.3.1/node_exporter-1.3.1.linux-amd64.tar.gz
tar -zxvf node_exporter-1.3.1.linux-amd64.tar.gz
cd node_exporter-1.3.1.linux-amd64
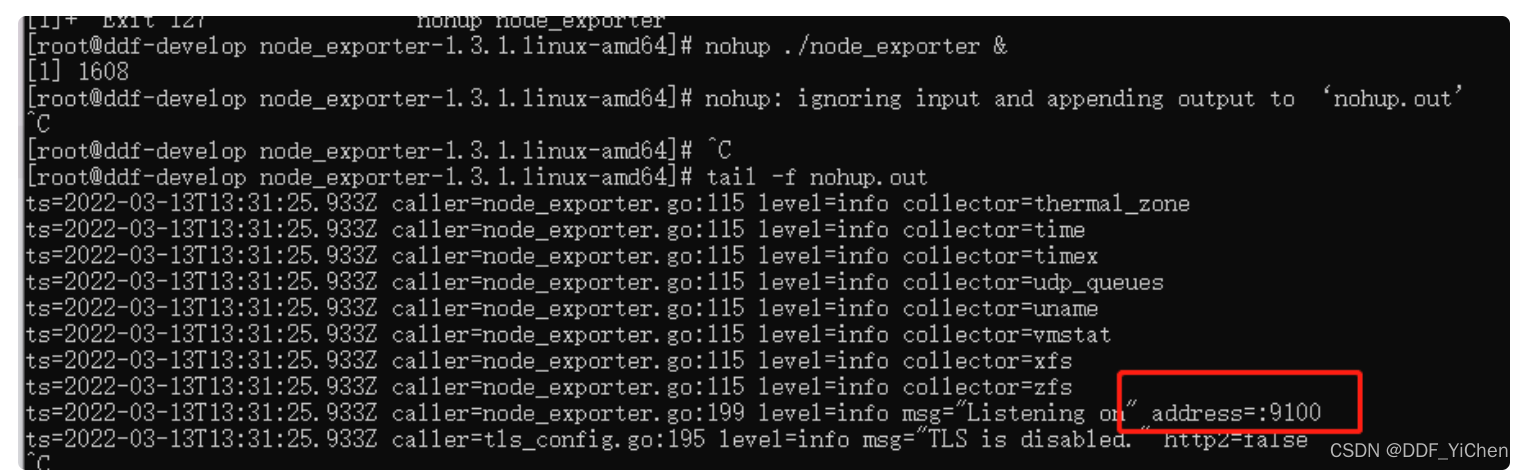
nohup ./node_exporter &
使用supervisor来管理进程的配置文件
; 这个是注释标识
[program:node_exporter]; 进程名
command=/opt/prometheus/exporter/node_exporter-1.3.1.linux-amd64/./node_exporter
; 生成子进程时的工作目录
directory=/opt/prometheus/exporter/node_exporter-1.3.1.linux-amd64/
; 自动重启
autostart=true
autorestart=true
; 用哪个用户启动
; user=
; 日志文件
stdout_logfile=/opt/prometheus/exporter/node_exporter-1.3.1.linux-amd64/node_exporter.log
; 重定向错误日志到stdout
redirect_stderr=true
; 日志级别
loglevel=info
修改Prometheus的配置文件prometheus.yml 增加 mysql 相关 exporter job
# A scrape configuration containing exactly one endpoint to scrape:
# Here it's Prometheus itself.
scrape_configs:
  # 增加抓取主机指标的exporter
  - job_name: 'host'
    static_configs:
      - targets: ['localhost:9100']
        labels:
          instance: host
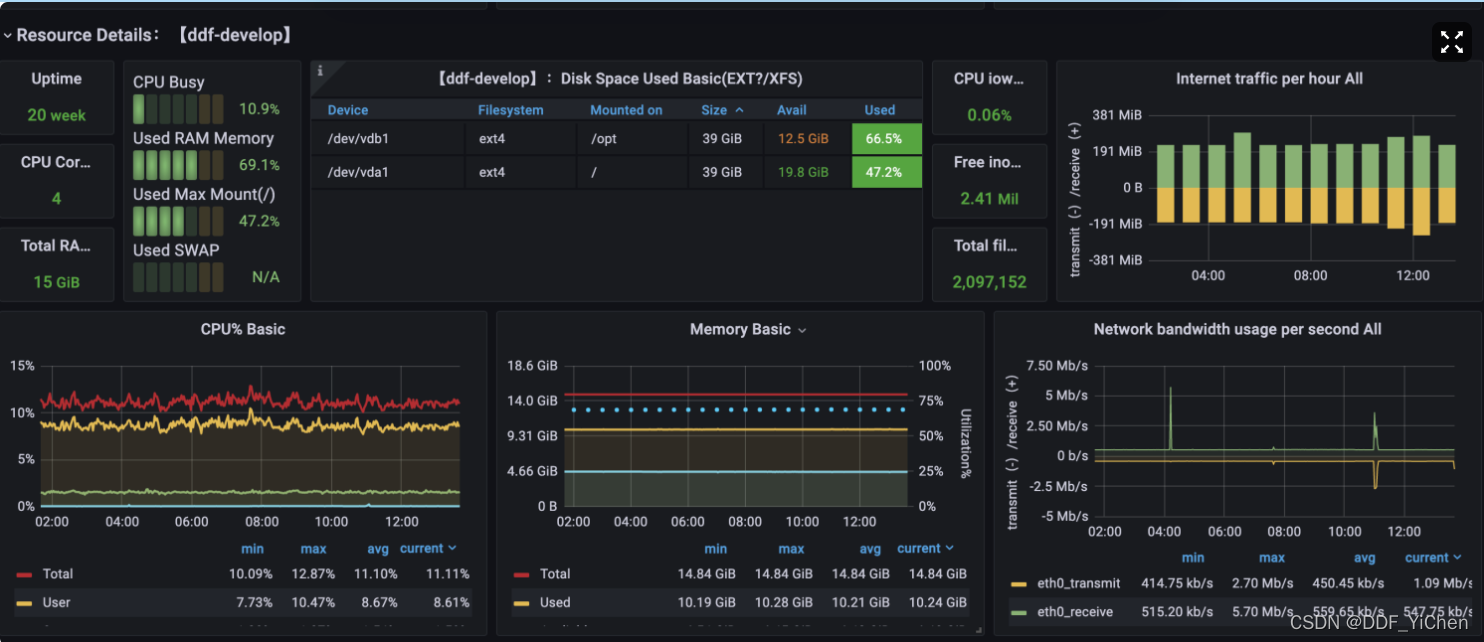
导入grafana监控大盘https://grafana.com/grafana/dashboards/1860
效果图如下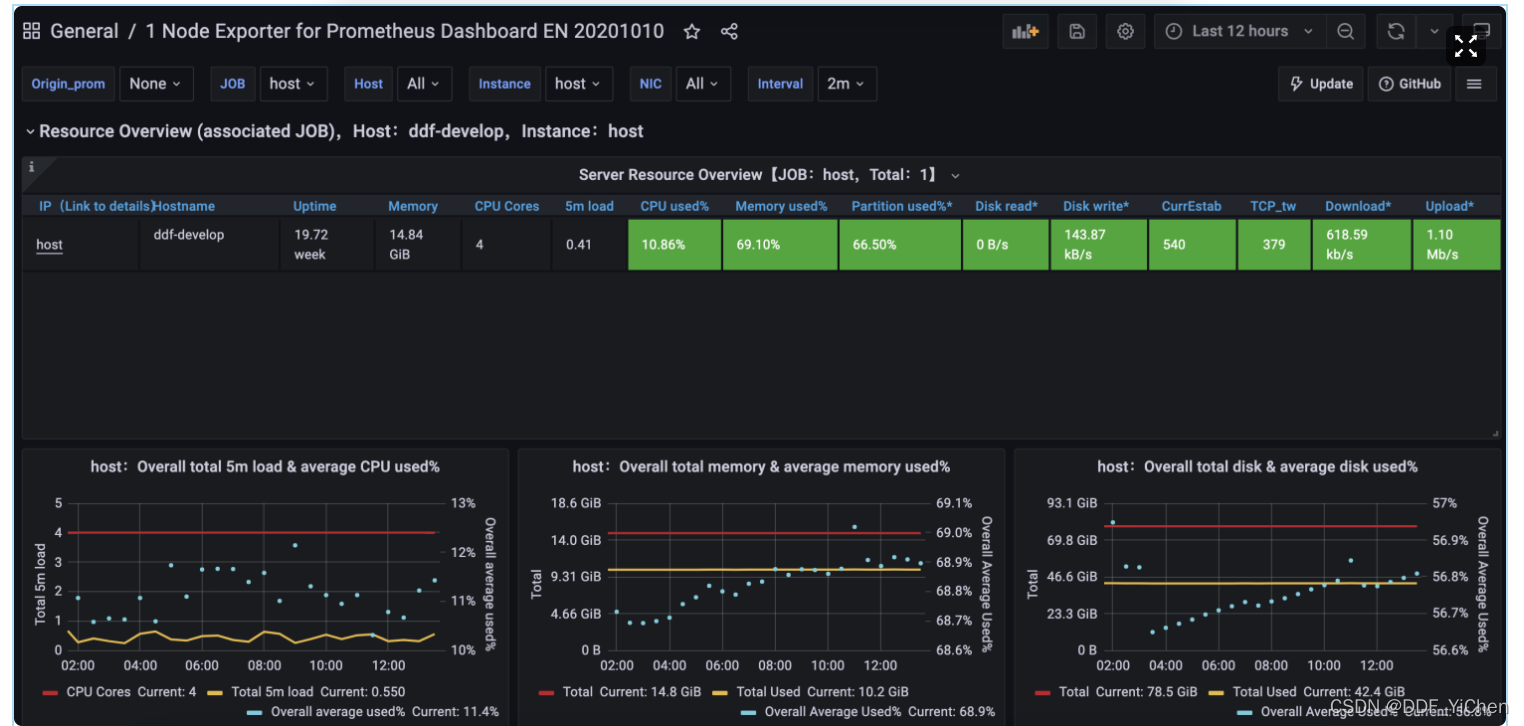
redis_exporter
mkdir -p /opt/prometheus/exporter/
# 通过加速地址下载
wget https://github.com/oliver006/redis_exporter/releases/download/v1.36.0/redis_exporter-v1.36.0.linux-amd64.tar.gz
tar -zxvf redis_exporter-v1.36.0.linux-amd64.tar.gz
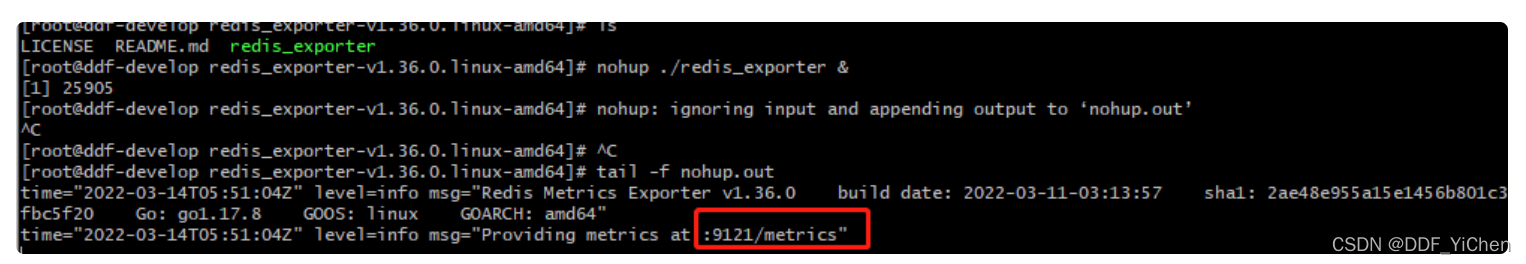
cd redis_exporter-v1.36.0.linux-amd64/
# 后台启动
nohup ./redis_exporter --redis.password=123456 &
使用supervistor管理进程
[program:redis_exporter]; redis_exporter
command=/opt/prometheus/exporter/redis_exporter-v1.36.0.linux-amd64/./redis_exporter --redis.password=redis密码
; 自动重启
autostart=true
autorestart=true
; 日志文件
stdout_logfile=/opt/prometheus/exporter/redis_exporter-v1.36.0.linux-amd64/redis_exporter.log
; 重定向错误日志到stdout
redirect_stderr=true
; 日志级别
loglevel=info
配置prometheus.yml
如下是支持监控多个redis主机的配置, 密码必须为同一个,配置在export的启动命令上,通过--redis.password指定,如果密码不一致,只能配置多个exporter了, 这个从README中抄的,还是有一点没有看懂,仅供参考
# A scrape configuration containing exactly one endpoint to scrape:
# Here it's Prometheus itself.
scrape_configs:
  # 增加抓取redis指标的exporter
  - job_name: 'redis'
    static_configs:
       - targets:
          - redis://localhost:6379
    metrics_path: /scrape
    relabel_configs:
      - source_labels: [__address__]
        target_label: __param_target
      - source_labels: [__param_target]
        target_label: instance
      - target_label: __address__
        replacement: localhost:9121

  ## config for scraping the exporter itself
  - job_name: 'redis_exporter'
    static_configs:
      - targets:
        - localhost:9121
      labels:
          instance: redis
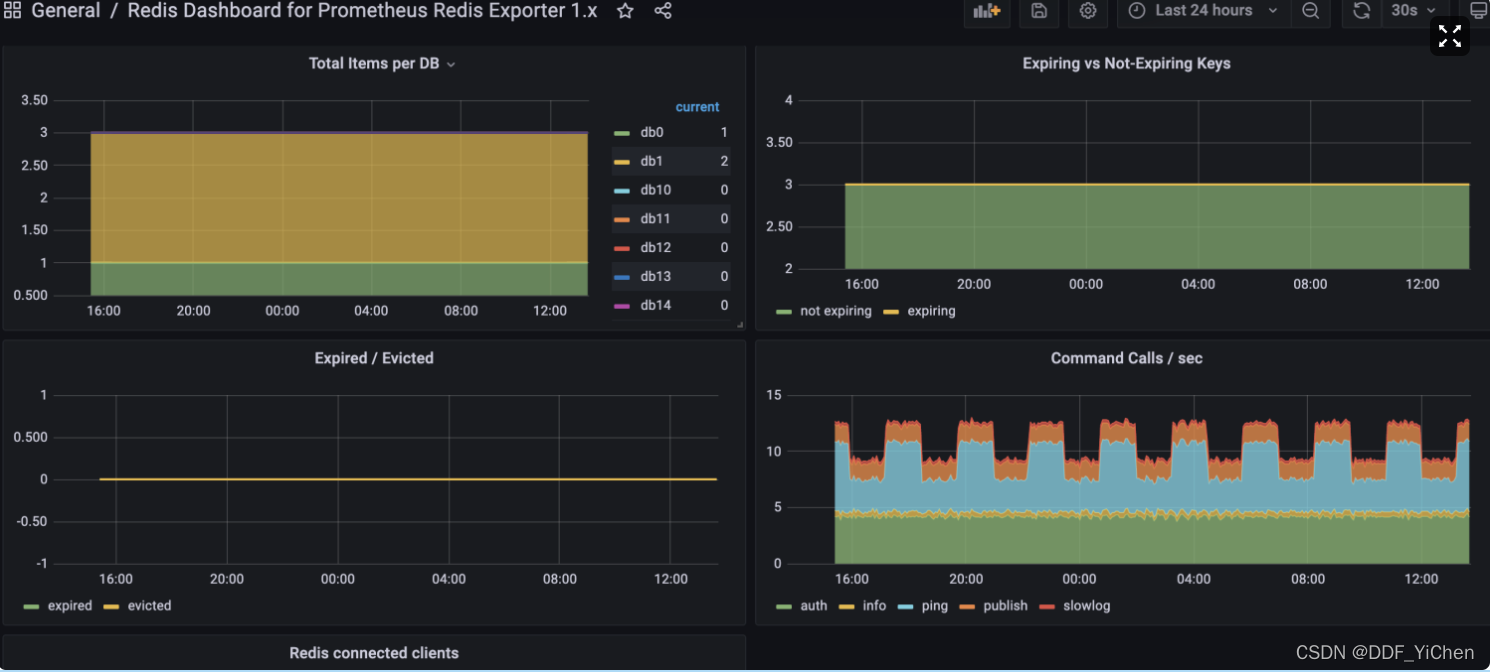
在grafana中导入监控大盘, https://grafana.com/grafana/dashboards/763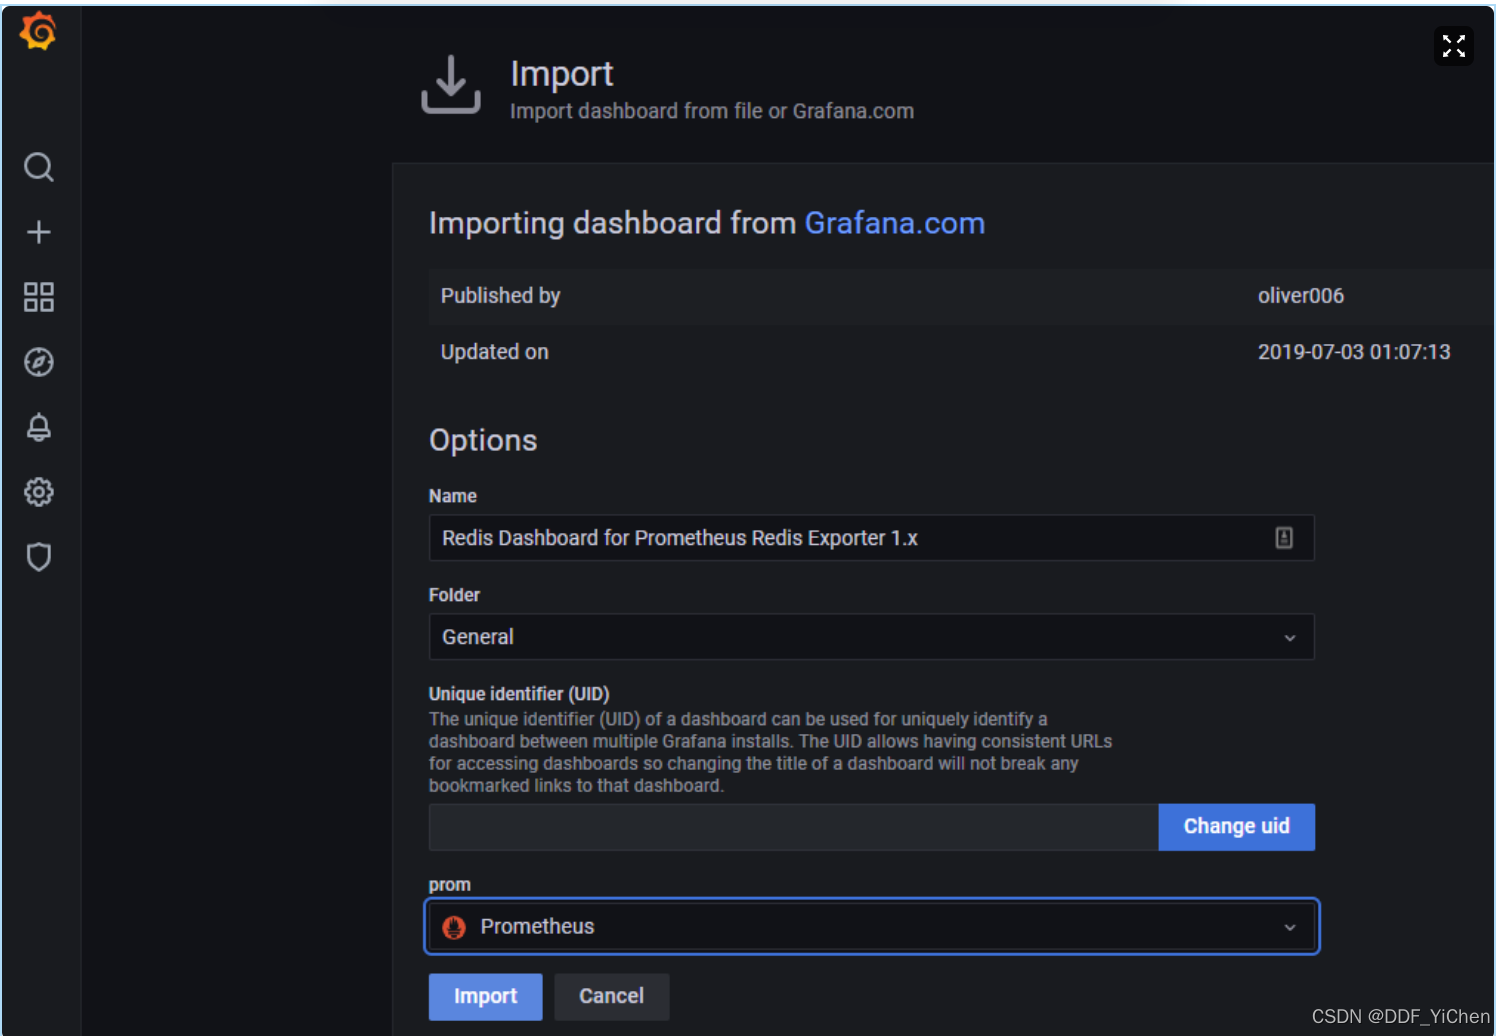
效果图如下
拿不到内存占用,不知道为啥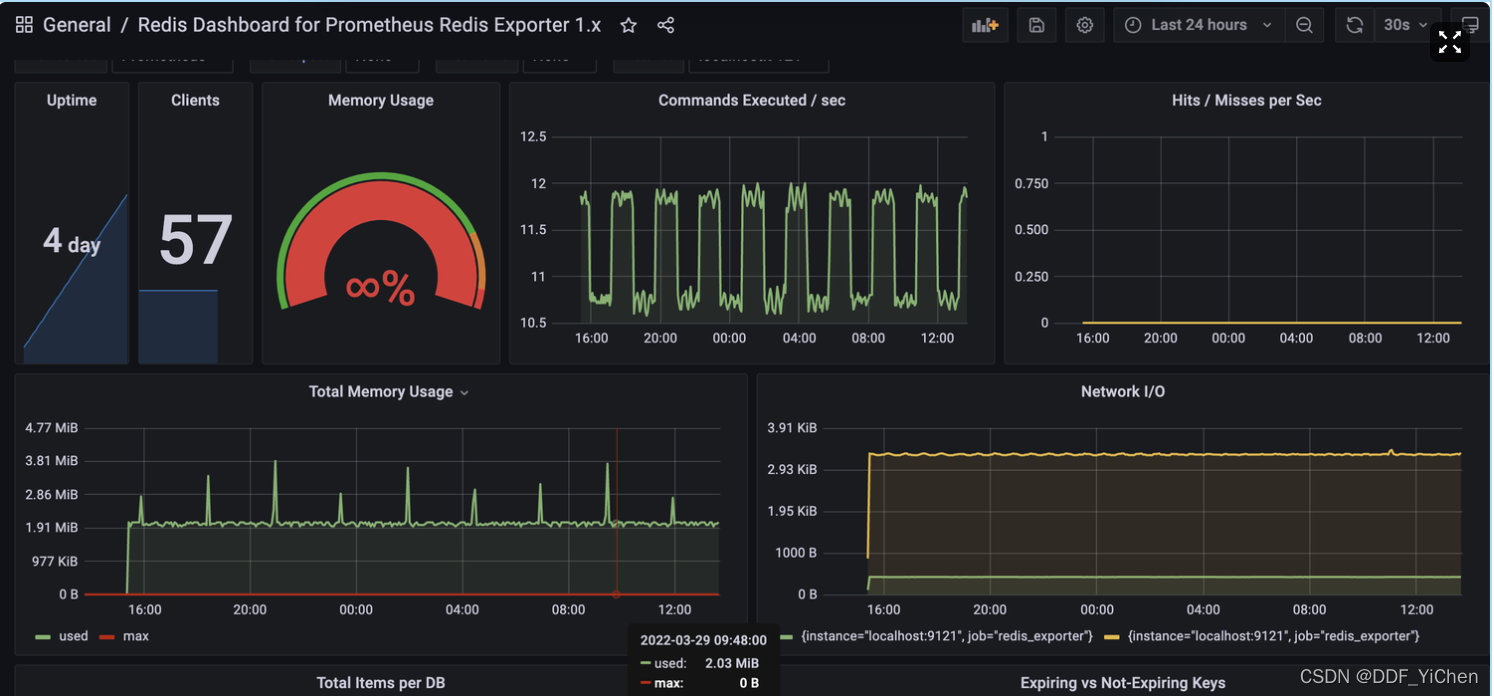


 1788
1788

 被折叠的 条评论
为什么被折叠?
被折叠的 条评论
为什么被折叠?
 到【灌水乐园】发言


