


 本文主要讲述了作者在使用ExpReport类生成包含温湿度曲线图的PDF报告过程中遇到的问题,如控制图例位置和隐藏x轴标签,以及如何设置图表样式和数据展示。
个人重点关注的是生成曲线图的部分,浪费了我很多时间
chart.Legend.Position = LegendPosition.Top;
控制图形的显示位置,这个地方好像必须要选一个位置,否则会内容显示不全,我开始用的LegendPosition.None,他就显示不了那几条线的颜色和名称说明文字。为了搞出这个效果浪费了我一天时间。
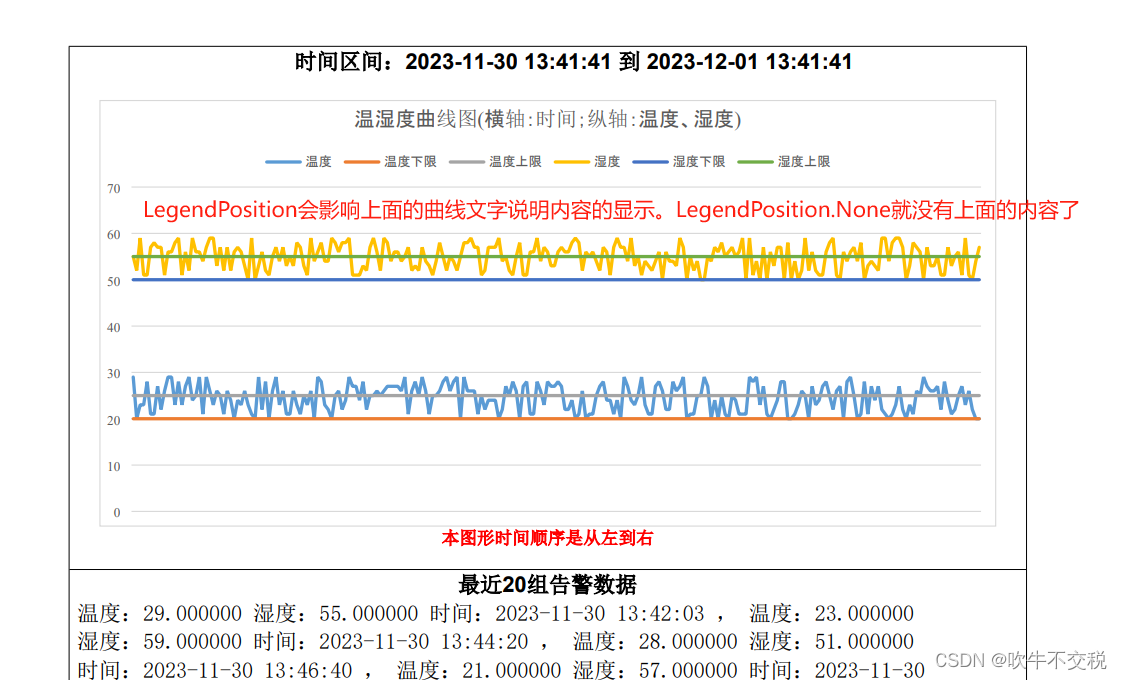
xAxis.Hidden = true;//隐藏x轴标签
public class ExpReport
{
    //IWebHostEnvironment _webHostEnvironment;

    //public ExpReport(IWebHostEnvironment webHostEnvironment)
    //{
    //    _webHostEnvironment = webHostEnvironment;
    //}

    public static string ReportChartPdf(List<TahmCJ_wdDto> Listdto, ExpReportDto ReportDto)
    {
        try
        {
            IConfiguration myconfiguration = new ConfigurationBuilder().SetBasePath(Directory.GetCurrentDirectory()).AddJsonFile("appsettings.json").Build();

            Document doc = new Document();

            DocumentBuilder builder = new DocumentBuilder(doc);

            builder.PageSetup.Orientation = Orientation.Portrait;

            //var parentPath = AppContext.BaseDirectory.ToString()+@"\wwwroot\";
            var parentPath = Path.Combine(IOCProvider.GetService<IHostEnvironment>().ContentRootPath,"wwwroot");
            //
            string strReportFileUrl = myconfiguration["Report:ReportFileUrl"].ToString();
            string dateDir = DateTime.Now.Date.ToString("yyyyMMdd");
            string saveFileStr = "温湿度曲线报表_" + DateTime.Now.Date.ToString("yyyyMMddHHmmss") + new Random().Next(1, 1000).ToString() + ".docx";
            // 你用path


            string strSavePath = Path.Combine(parentPath, strReportFileUrl, dateDir);
            FolderAndFile.FolderCreate(strSavePath);

            strSavePath = Path.Combine(strSavePath, saveFileStr);


            string strCompanyLogo = myconfiguration["Report:CompanyLogo"].ToString();
            string Logpicurl =  Path.Combine(parentPath, strCompanyLogo);


            string ComLogoWidth = myconfiguration["Report:CompanyLogoWidth"].ToString();
            string ComLogoHeight = myconfiguration["Report:CompanyLogoHeight"].ToString();
            //Logpicurl = FolderAndFile.SetImageSize(float.Parse(ComLogoWidth), float.Parse(ComLogoHeight), Logpicurl, "");


            string RepImageWidth = myconfiguration["Report:ReportImageWidth"].ToString();
            string RepImageHeight = myconfiguration["Report:ReportImageHeight"].ToString();


            ReportDto.LogoPicUrl = Logpicurl;
            ReportDto.aveWD = Math.Round((decimal)Listdto.Average(x => x.wd1), 1).ToString("0.0");
            ReportDto.aveSD = Math.Round((decimal)Listdto.Average(x => x.sd1), 1).ToString("0.0");
            ReportDto.highWD = Listdto.Max(x => (decimal)x.wd1).ToString("0.0");
            ReportDto.highSD = Listdto.Max(x => (decimal)x.sd1).ToString("0.0");
            ReportDto.lowWD = Listdto.Min(x => (decimal)x.wd1).ToString("0.0");
            ReportDto.lowSD = Listdto.Min(x => (decimal)x.sd1).ToString("0.0");
            ReportDto.WDLimit = ((decimal)Listdto[0].wdlowLimit).ToString("0.0") + "--" + ((decimal)Listdto[0].wdHghLimit).ToString("0.0");
            ReportDto.SDLimit = ((decimal)Listdto[0].sdLowLimit).ToString("0.0") + "--" + ((decimal)Listdto[0].sdHghLimit).ToString("0.0");
            var alarmList = Listdto.Select(x => new { x.wd1, x.sd1, x.dt }).Where(x => x.wd1 < ((decimal)Listdto[0].wdlowLimit) || x.wd1 > ((decimal)Listdto[0].wdHghLimit)
最低0.47元/天 解锁文章


 1067
1067

 被折叠的 条评论
为什么被折叠?
被折叠的 条评论
为什么被折叠?
 到【灌水乐园】发言


