let myChart = echarts.init(document.getElementById("main"));
			var option = {
				tooltip: {
					trigger: 'axis',
					axisPointer: {
						type: 'shadow'
					},

				},
				legend: {
					x:'right',      //可设定图例在左、右、居中
					y:'top',     //可设定图例在上、下、居中
					padding:[25,10,0,0],   //可设定图例[距上方距离,距右方距离,距下方距离,距左方距离]
					show:true,
					//legend横向显示
					orient:'horizontal',

					//设置图片的大小
					itemWidth:20,
					itemHeight:20,
					// 自定义legend图片
					data:[
						{

							name:'有害',
							textStyle:{
								fontSize:14,
								color:'#1DFCF4',
								icon: "circle",
							},
							icon:`image://${require("../../assets/youhai@2x.png")}`//格式为'image://+icon文件地址',其中image::后的//不能省略
						},
						{
							name:'金属',
							textStyle:{
								fontSize:14,
								color:'#F0872B',

							},
							icon:'circle',
							icon:`image://${require("../../assets/jinshu@2x.png")}`,//格式为'image://+icon文件地址',其中image::后的//不能省略

						},
						{
							name:'塑料',
							textStyle:{
								fontSize:14,
								color:'#F9E035',
							},
							icon:`image://${require("../../assets/suliao@2x.png")}`//格式为'image://+icon文件地址',其中image::后的//不能省略
						},
						{
							name:'橡胶',
							textStyle:{
								fontSize:14,
								color:'#01A0F8',
							},
							icon:`image://${require("../../assets/xiangjiao@2x.png")}`//格式为'image://+icon文件地址',其中image::后的//不能省略
						}

					]
				},
				xAxis: {
					type: 'category',
					data: ['21/7/01', '21/7/02', '21/7/03','21/7/04','21/7/05','21/7/06'],
					axisLabel: {
						show: true,
						textStyle: {

							color: '#BCF0FE'
						},
						// 文字斜着
						// rotate:45,
					},

					axisLine: {
						show: false
					},
					splitLine: {
						show: false
					},
					axisTick: { //x轴刻度线去掉
						show: false
					},
				},
				yAxis: {
					show: true,
					type: 'value',
					axisLabel: {
						formatter: '{value}',
						textStyle: {
							color: '#BCF0FE'
						}
					},
					axisLine: {
						show: false
					},
					splitLine: {
						show: true,
						lineStyle: {
							color: "#0E3C79",
						}
					},
					axisTick: { //y轴刻度线去掉
						show: false
					},
				},
				series: [
					{
						name: '有害',
						//柱子的宽度
						barWidth: 8,
						data: [50, 105,100,5,44,66],
						itemStyle: {
							normal: {
								//设置柱子的圆角
								barBorderRadius: [18, 18, 0, 0],
								//设置柱子的渐变颜色
								color: new echarts.graphic.LinearGradient(0, 0, 0, 1, [{
									offset: 0,
									color: '#00ECD6'
								}, {
									offset: 1,
									color: '#01A2F8'
								}]),
							}
						},
						type: 'bar'
					},
					{
						name: '金属',
						barWidth: 8,
						data: [100, 34.4,70,77,74,76],
						itemStyle: {
							normal: {
								barBorderRadius: [18, 18, 0, 0],
								color: new echarts.graphic.LinearGradient(0, 0, 0, 1, [{
									offset: 0,
									color: '#F5B257'
								}, {
									offset: 1,
									color: '#EE7A1C'
								}]),
							}
						},
						type: 'bar'
					},
					{
						name: '塑料',
						barWidth: 8,
						data: [110, 38,100,25,64,46],
						itemStyle: {
							normal: {
								barBorderRadius: [18, 18, 0, 0],
								color: new echarts.graphic.LinearGradient(0, 0, 0, 1, [{
									offset: 0,
									color: '#F5B257'
								}, {
									offset: 1,
									color: '#FFF6B7'
								}]),
							}
						},
						type: 'bar'
					},
					{
						name: '橡胶',
						barWidth: 8,
						data: [10, 88,57,50,104,36],
						itemStyle: {
							normal: {
								barBorderRadius: [18, 18, 0, 0],
								color: new echarts.graphic.LinearGradient(0, 0, 0, 1, [{
									offset: 0,
									color: '#0097FE'
								}, {
									offset: 1,
									color: '#1338F8'
								}]),
							}
						},
						type: 'bar'
					},

				],
				//调整内边的距离
				grid: {
					x: 50,
					y: 85,
					x2: 10,
					y2: 35
				},
			};
			// 使用刚指定的配置项和数据显示图表。
			myChart.setOption(option);


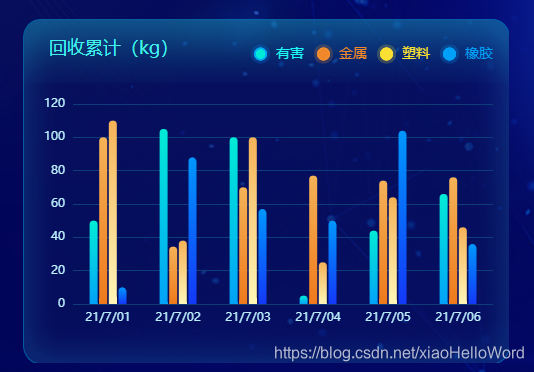
 本文详细介绍了如何使用Echarts库创建一个带有自定义图例(包括图标和文字样式)以及渐变色柱状图的图表。内容涵盖图例的位置、样式、图片引用,以及x轴和y轴的配置,展示了如何通过LinearGradient实现柱状图颜色的平滑过渡,增强图表的视觉效果。


 2582
2582

 被折叠的 条评论
为什么被折叠?
被折叠的 条评论
为什么被折叠?
 到【灌水乐园】发言


