


 本文详细介绍如何在ECharts中优化轴标签的显示效果,包括垂直显示、倾斜显示及省略过长标签的方法,适用于处理大量数据时的文字展示问题。
垂直显示:
let option = {
	xAxis:{
		//文字样式
		axisLabel: {
             show: true,
             textStyle: {
                color: '#595C61'
             },
             formatter:function(value){
				return value.split("").join("\n");
			 }
        }
	}
}
倾斜显示:
let option = {
	xAxis:{
		//文字样式
		axisLabel: {
             show: true,
             textStyle: {
                color: '#595C61'
             },
             rotate:45
        }
	}
}
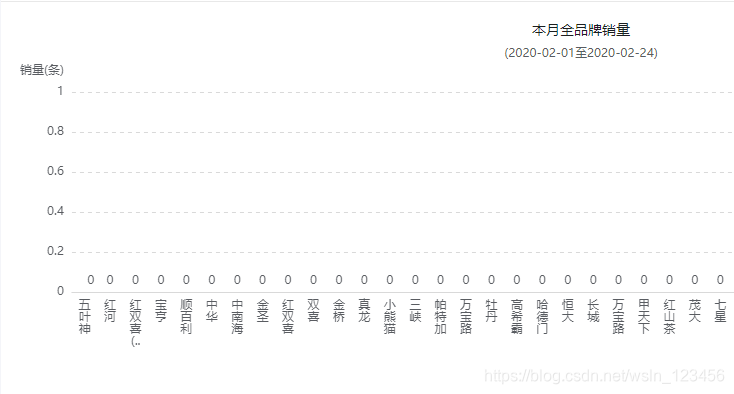
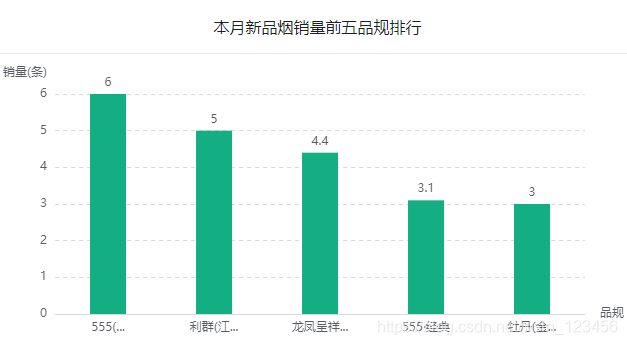
省略显示:
let option = {
	xAxis:{
		//文字样式
		axisLabel: {
             show: true,
             textStyle: {
                color: '#595C61'
             },
             formatter:function(value){
				 if(value.length > 6){
                        return `${value.slice(0,4)}...`;
                 }
                 return value;
			 }
        }
	}
}


 964
964

 被折叠的 条评论
为什么被折叠?
被折叠的 条评论
为什么被折叠?
 到【灌水乐园】发言


