


1. 简介
Highcharts图表控件是目前使用最为广泛的图表控件 ,是纯JS图表库。
主要特性如下:
- 兼容性:兼容当今所有的浏览器,包括iPhone、IE和火狐等等;
- 易用性:无需要特殊的开发技能,只需要设置一下选项就可以制作适合自己的图表;
- 跨语言:不管是PHP、Asp.net还是Java都可以使用,它只需要三个文件:一个是Highcharts的核心文件highcharts.js,还有a canvas emulator for IE和Jquery类库或者MooTools类库;
- 时间轴:可以精确到毫秒;
- 费用:对个人用户完全免费;
- 组成:纯JS,无BS;
- 支持图表:支持大部分的图表类型:直线图,曲线图、区域图、区域曲线图、柱状图、饼装图、散布图;
- 提示功能:鼠标移动到图表的某一点上有提示信息;
- 放大功能:选中图表部分放大,近距离观察图表;
2. 环境配置
1. 下载Highcharts
Highcharts 官网:http://www.highcharts.com
2. 解压Highcharts
3. 下载jQuery
jQuery官网: http://jquery.com/
4. 将用到的文件放到工程的js目录下
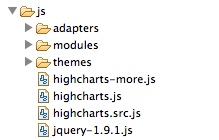
- highcharts.js是主要的js文件
- themes是样式文件夹,主要有深蓝、深绿、灰色、网格四种样式风格。
- modules文件夹下主要包含一个图表图片到出的格式js,有png、jpg、及svg格式。
- adapters下有mootools和prototype适配器
MooTools是一个简洁,模块化,面向对象的开源JavaScript web应用框架。
它为web开发者提供了一个跨浏览器js解决方案。在处理js css html时 候。它提供了一个比普通js更面向对象的document API。
ProtoType是一个跟MooTools类似的js框架。
5. 开始使用
6. 源码展示
01 | <!DOCTYPE HTML> |
02 | <html> |
03 | <head> |
04 | <meta http-equiv="Content-Type" content="text/html; charset=utf-8"> |
05 | <title>Highcharts Example</title> |
06 |
07 | <script type="text/javascript" src="http://ajax.googleapis.com/ajax/libs/jquery/1.8.2/jquery.min.js"></script> |
08 | <script type="text/javascript"> |
09 | $(function () { |
10 | $('#container').highcharts({ |
11 | data: { |
12 | table: document.getElementById('datatable') |
13 | }, |
14 | chart: { |
15 | type: 'column' |
16 | }, |
17 | title: { |
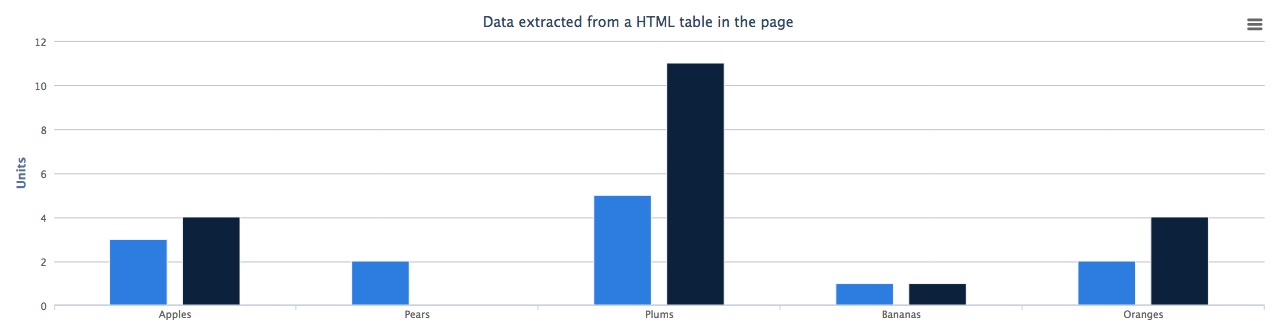
18 | text: 'Data extracted from a HTML table in the page' |
19 | }, |
20 | yAxis: { |
21 | allowDecimals: false, |
22 | title: { |
23 | text: 'Units' |
24 | } |
25 | }, |
26 | tooltip: { |
27 | formatter: function() { |
28 | return '<b>'+ this.series.name +'</b><br/>'+ |
29 | this.y +' '+ this.x.toLowerCase(); |
30 | } |
31 | } |
32 | }); |
33 | }); |
34 | </script> |
35 | </head> |
36 | <body> |
37 | <script src="../../js/highcharts.js"></script> |
38 | <script src="../../js/modules/data.js"></script> |
39 | <script src="../../js/modules/exporting.js"></script> |
40 |
41 | <div id="container" style="min-width: 400px; height: 400px; margin: 0 auto"></div> |
42 |
43 | <table id="datatable"> |
44 | <thead> |
45 | <tr> |
46 | <th></th> |
47 | <th>Jane</th> |
48 | <th>John</th> |
49 | </tr> |
50 | </thead> |
51 | <tbody> |
52 | <tr> |
53 | <th>Apples</th> |
54 | <td>3</td> |
55 | <td>4</td> |
56 | </tr> |
57 | <tr> |
58 | <th>Pears</th> |
59 | <td>2</td> |
60 | <td>0</td> |
61 | </tr> |
62 | <tr> |
63 | <th>Plums</th> |
64 | <td>5</td> |
65 | <td>11</td> |
66 | </tr> |
67 | <tr> |
68 | <th>Bananas</th> |
69 | <td>1</td> |
70 | <td>1</td> |
71 | </tr> |
72 | <tr> |
73 | <th>Oranges</th> |
74 | <td>2</td> |
75 | <td>4</td> |
76 | </tr> |
77 | </tbody> |
78 | </table> |
79 | </body> |
80 | </html> |
7. Highcharts常用的最核心的参数选项
Chart:图表区选项
Chart图表区选项用于设置图表区相关属性。
| 参数 | 描述 | 默认值 |
| backgroundColor | 设置图表区背景色 | #FFFFFF |
| borderWidth | 设置图表边框宽度 | 0 |
| borderRadius | 设置图表边框圆角角度 | 5 |
| renderTo | 图表放置的容器,一般在html中放置一个DIV,获取DIV的id属性值 | null |
| defaultSeriesType | 默认图表类型line, spline, area, areaspline, column, bar, pie , scatter | 0 |
| width | 图表宽度,默认根据图表容器自适应宽度 | null |
| height | 图表高度,默认根据图表容器自适应高度 | null |
| margin | 设置图表与其他元素之间的间距,数组,如[0,0,0,0] | [null] |
| plotBackgroundColor | 主图表区背景色,即X轴与Y轴围成的区域的背景色 | null |
| plotBorderColor | 主图表区边框的颜色,即X轴与Y轴围成的区域的边框颜色 | null |
| plotBorderWidth | 主图表区边框的宽度 | 0 |
| shadow | 是否设置阴影,需要设置背景色backgroundColor。 | false |
| reflow | 是否自使用图表区域高度和宽度,如果没有设置width和height时,会自适应大小。 | true |
| zoomType | 拖动鼠标进行缩放,沿x轴或y轴进行缩放,可以设置为:’x',’y',’xy’ | ” |
| events | 事件回调,支持addSeries方法,click方法,load方法,selection方法等的回调函数。 |
|
Color:颜色选项
Color颜色选项用于设置图表的颜色方案。
| 参数 | 描述 | 默认值 |
| color | 用于展示图表,折线/柱状/饼状等图的颜色,数组形式。 | array |
Highcharts已经默认提供了多种颜色方案,当要显示的图形多于颜色种类时,多出的图形会自动从第一种颜色方案开始选取。自定义颜色方案的方法:
Highcharts.setOptions({
colors: ['#058DC7', '#50B432', '#ED561B', '#DDDF00', '#24CBE5', '#64E572', '#FF9655',
'#FFF263', '#6AF9C4']
});
Title:标题选项
Title标题选项用于设置图表的标题相关属性。
| 参数 | 描述 | 默认值 |
| text | 标题文本内容。 | Chart title |
| align | 水平对齐方式。 | center |
| verticalAlign | 垂直对齐方式。 | top |
| margin | 标题与副标题之间或者主图表区间的间距。 | 15 |
| floating | 是否浮动,如果为true,则标题可以偏离主图表区,可配合x,y属性使用。 | false |
| style | 设置CSS样式。 | {color: ‘#3E576F’, fontSize: ’16px’} |
Subtitle:副标题选项
副标题提供的属性选项与标题title大致相同,可参照上述标题选项,值得一提的是副标题的text选项默认为”,即空的,所以默认情况下副标题不显示。
xAxis:X轴选项
X轴选项用于设置图表X轴相关属性。
| 参数 | 描述 | 默认值 |
| categories | 设置X轴分类名称,数组,例如:categories: ['Apples', 'Bananas', 'Oranges'] | [] |
| title | X轴名称,支持text、enabled、align、rotation、style等属性 |
|
| labels | 设置X轴各分类名称的样式style,格式formatter,角度rotation等。 | array |
| max | X轴最大值(categories为空时),如果为null,则最大值会根据X轴数据自动匹配一个最大值。 | null |
| min | X轴最小值(categories为空时),如果为null,则最小值会根据X轴数据自动匹配一个最小值。 | array |
| gridLineColor | 网格(竖线)颜色 | #C0C0C0 |
| gridLineWidth | 网格(竖线)宽度 | 1 |
| lineColor | 基线颜色 | #C0D0E0 |
| lineWidth | 基线宽度 | 0 |
yAxis:Y轴选项
Y轴选项与上述xAxis选项基本一致,请参照上表中的参数设置,不再单独列出。
Series:数据列选项
数据列选项用于设置图表中要展示的数据相关的属性。
| 参数 | 描述 | 默认值 |
| data | 显示在图表中的数据列,可以为数组或者JSON格式的数据。如:data:[0, 5, 3, 5],或 data: [{name: 'Point 1',y: 0}, {name: 'Point 2',y: 5}] | ” |
| name | 显示数据列的名称。 | ” |
| type | 数据列类型,支持 area, areaspline, bar, column, line, pie, scatter or spline | line |
plotOptions:数据点选项
plotOptions用于设置图表中的数据点相关属性。plotOptions根据各种图表类型,其属性设置略微有些差异,现将常用选项列出来。
| 参数 | 描述 | 默认值 |
| enabled | 是否在数据点上直接显示数据 | false |
| allowPointSelect | 是否允许使用鼠标选中数据点 | false |
| formatter | 回调函数,格式化数据显示内容 | formatter: function() {return this.y;} |
Tooltip:数据点提示框
Tooltip用于设置当鼠标滑向数据点时显示的提示框信息。
| 参数 | 描述 | 默认值 |
| enabled | 是否显示提示框 | true |
| backgroundColor | 设置提示框的背景色 | rgba(255, 255, 255, .85) |
| borderColor | 提示框边框颜色,默认自动匹配数据列的颜色 | auto |
| borderRadius | 提示框圆角度 | 5 |
| shadow | 是否显示提示框阴影 | true |
| style | 设置提示框内容样式,如字体颜色等 | color:’#333′ |
| formatter | 回调函数,用于格式化输出提示框的显示内容。返回的内容支持html标签如:<b>, <strong>, <i>, <em>, <br/>, <span> | 2 |
Legend:图例选项
legend用于设置图例相关属性。
| 参数 | 描述 | 默认值 |
| layout | 显示形式,支持水平horizontal和垂直vertical | horizontal |
| align | 对齐方式。 | center |
| backgroundColor | 图例背景色。 | null |
| borderColor | 图例边框颜色。 | #909090 |
| borderRadius | 图例边框角度 | 5 |
| enabled | 是否显示图例 | true |
| floating | 是否可以浮动,配合x,y属性。 | false |
| shadow | 是否显示阴影 | false |
| style | 设置图例内容样式 | ” |
本文未列出来的选项设置请参照highcharts官网英文文档:http://www.highcharts.com/ref/
本文参考:http://blog.youkuaiyun.com/shimiso/article/details/8088951
订阅
微信搜索“毕小烦”或者扫描下面的二维码,即可订阅我的文章。

如果文章对你有帮助,请随手点个赞吧!
(完)


 2万+
2万+

 被折叠的 条评论
为什么被折叠?
被折叠的 条评论
为什么被折叠?
 到【灌水乐园】发言


