


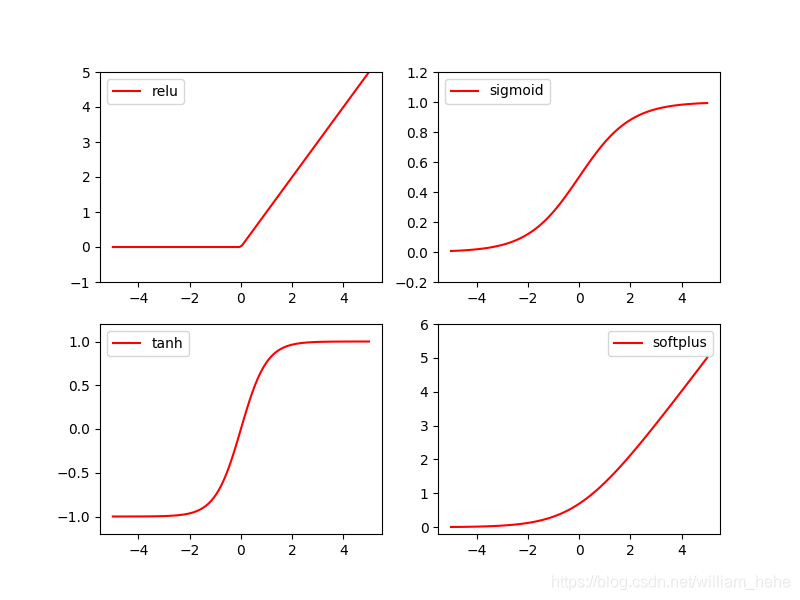
 本文通过使用TensorFlow、NumPy和Matplotlib等工具,对ReLU、Sigmoid、Tanh和Softplus四种常见激活函数进行了可视化,展示了它们在不同输入范围内的响应特性。
一、前言:
针对四种常用的激活函数进行可视化。
二、代码:
import tensorflow as tf
import numpy as np
import matplotlib.pyplot as plt

# fake data
x = np.linspace(-5, 5, 100)

# following are popular activation functions
y_relu = tf.nn.relu(x)
y_sigmoid = tf.nn.sigmoid(x)
y_tanh = tf.nn.tanh(x)
y_softplus = tf.nn.softplus(x)  # log( exp( features ) + 1)


# plt to visualize these activation function
plt.figure(1, figsize=(8, 6))
plt.subplot(221)
plt.plot(x, y_relu, c='red', label='relu')
plt.ylim((-1, 5))
plt.legend(loc='best')

plt.subplot(222)
plt.plot(x, y_sigmoid, c='red', label='sigmoid')
plt.ylim((-0.2, 1.2))
plt.legend(loc='best')

plt.subplot(223)
plt.plot(x, y_tanh, c='red', label='tanh')
plt.ylim((-1.2, 1.2))
plt.legend(loc='best')

plt.subplot(224)
plt.plot(x, y_softplus, c='red', label='softplus')
plt.ylim((-0.2, 6))
plt.legend(loc='best')

plt.show()
三、结果:


 1万+
1万+

 被折叠的 条评论
为什么被折叠?
被折叠的 条评论
为什么被折叠?
 到【灌水乐园】发言


