


1、安装导入Echarts
在项目终端中输入
npm install echarts --save2、按需引入Echarts
import * as echarts from 'echarts';3、下中国地图json文件
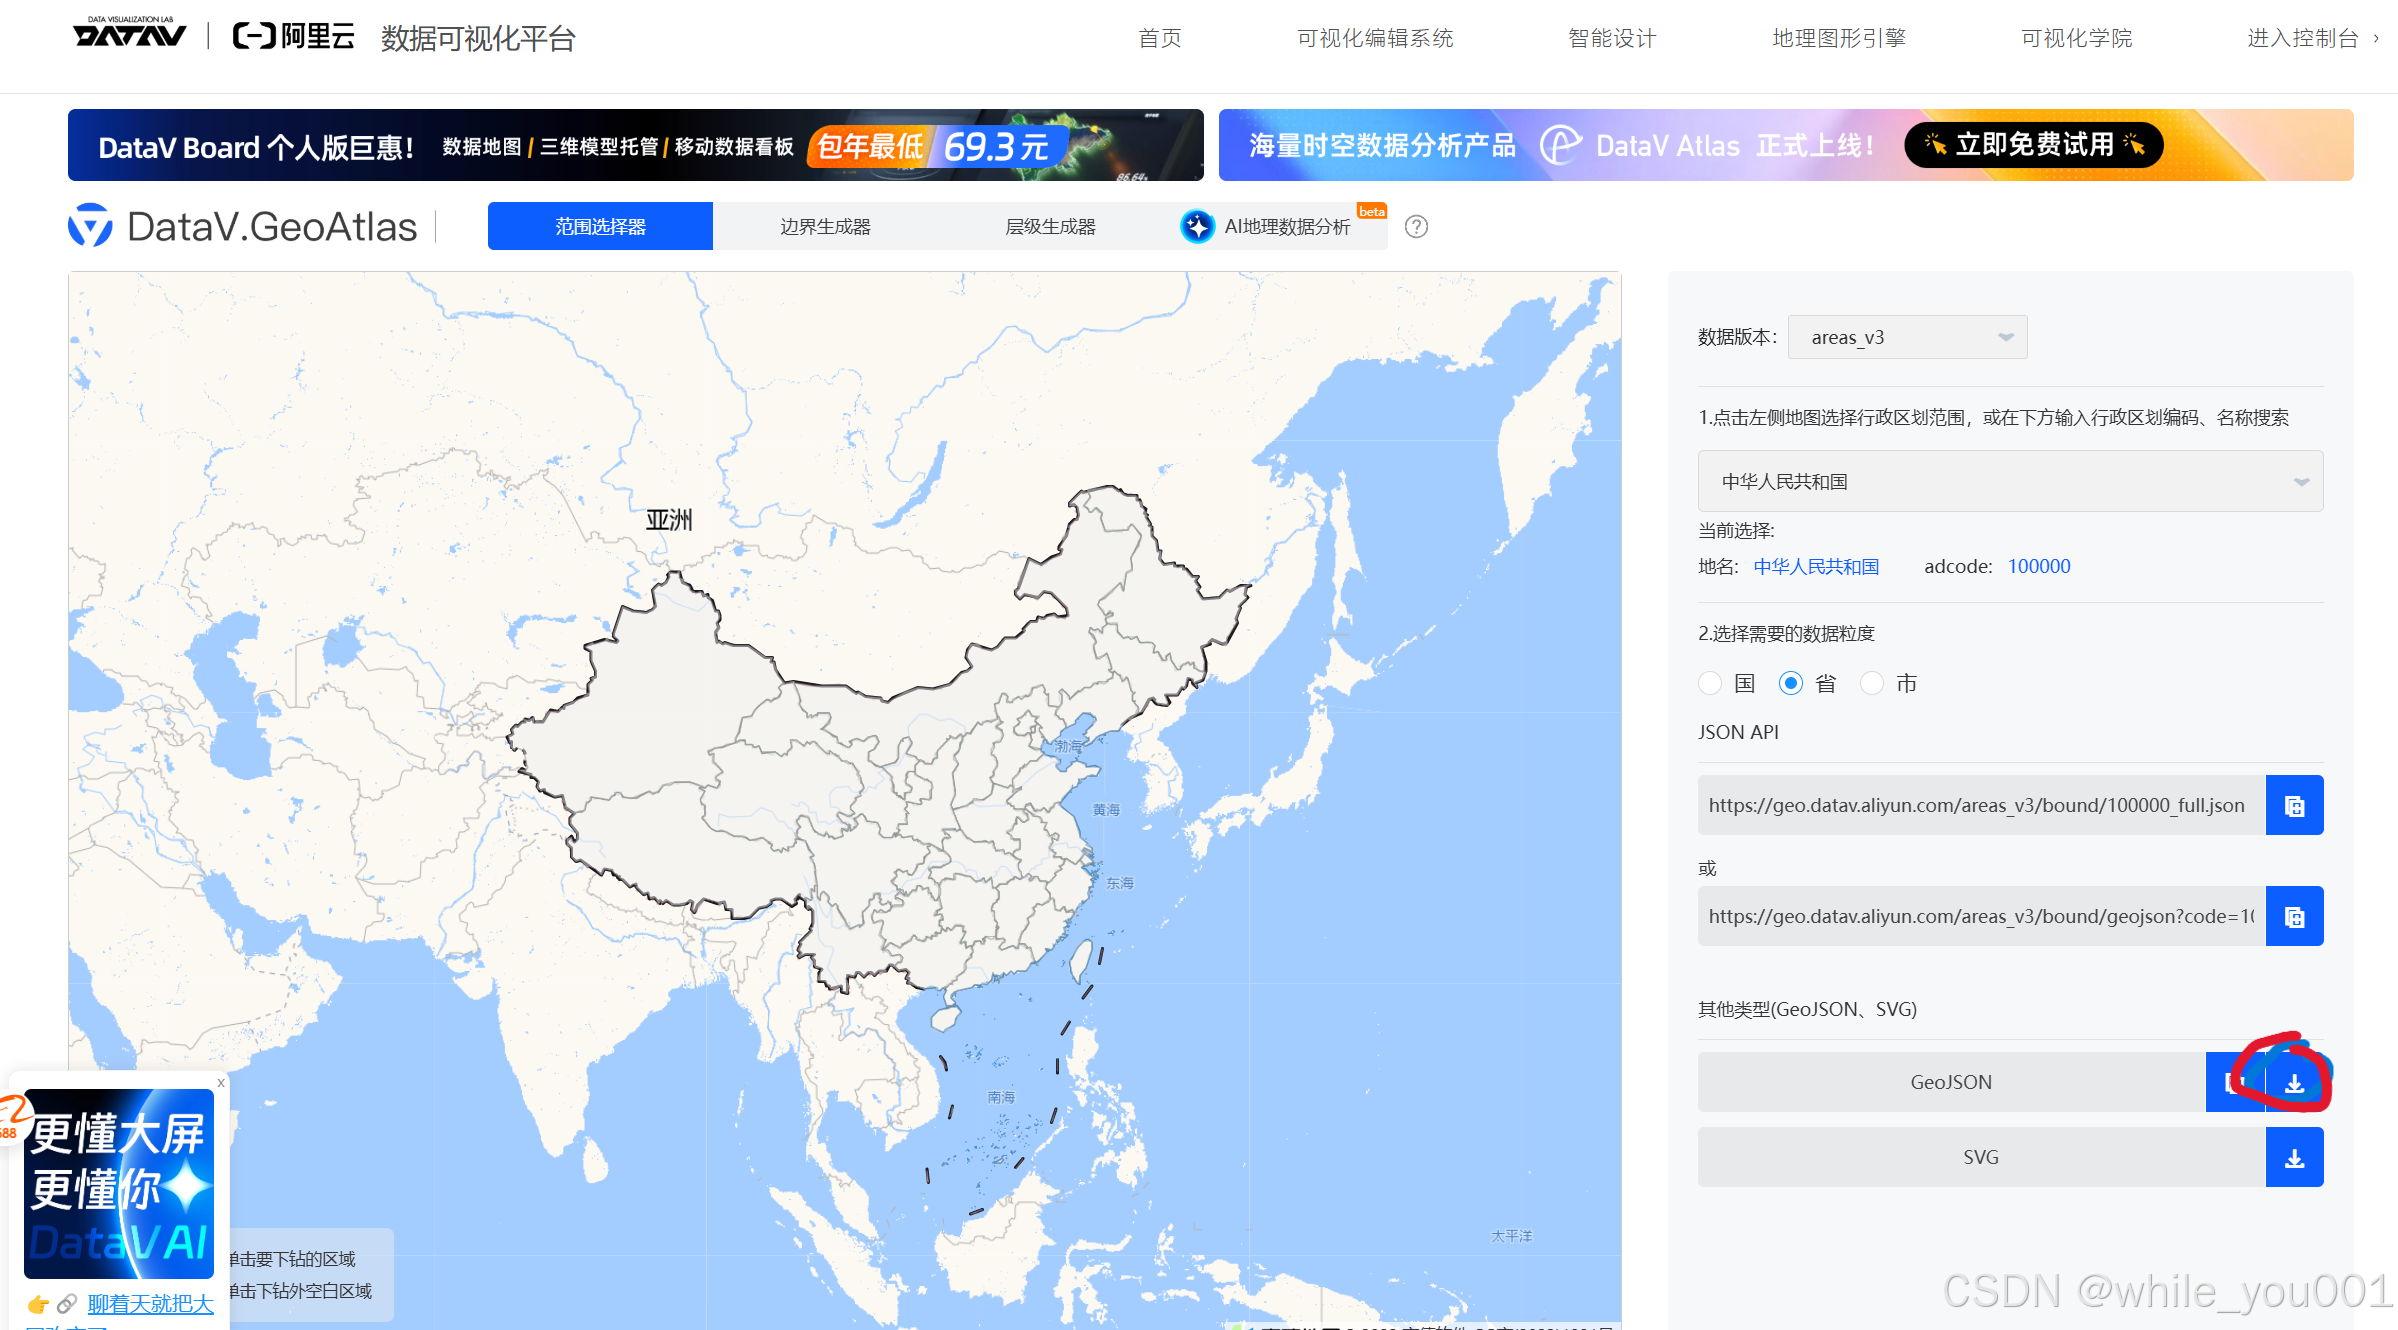
下载json文件,存入项目目录中
3、在页面使用以下代码
<script setup lang="ts">
import { ref, onMounted } from 'vue';
import * as echarts from 'echarts';
import geoJson from '../static/china.json';  // 直接导入 地图JSON 文件

//获取dom
const chartDom = ref(null);

onMounted(() => {
//初始化echarts
  const chart = echarts.init(chartDom.value);

//注册地图
  // 直接使用 geoJson 数据,不需要等待 axios 请求
  echarts.registerMap('china', geoJson);

//设置属性
  const option = {
    series: [{
      type: 'map',
      map: 'china',//跟上面对应
      zoom: 1.2,
      layoutCenter: ['50%', '60%'],
      layoutSize: '95%',
      data: [
        {name: '北京', value: 1696.6},
        {name: '上海', value: 1623.9},
        {name: '广东', value: 1104.0},
        {name: '四川', value: 1461.3},
        {name: '天津', value: 1407.8},
        {name: '江苏', value: 1082.5}
      ],
      itemStyle: {
        areaColor: '#f0f9ff',
        borderColor: 'rgba(24,144,255,0.4)',
        borderWidth: 1.5,
        shadowColor: 'rgba(0,0,0,0.1)',
        shadowBlur: 2,
        shadowOffsetY: 2
      },
      emphasis: {
        itemStyle: {
          areaColor: 'rgba(64,169,255,0.4)',
          borderColor: 'rgba(255,255,255,0.8)',
          borderWidth: 2
        }
      }
    }]
  };

  chart.setOption(option);
});
</script>

<template>
  <div class="chart-container">
    <div ref="chartDom" class="chart"></div>
  </div>
</template>


 476
476

 被折叠的 条评论
为什么被折叠?
被折叠的 条评论
为什么被折叠?
 到【灌水乐园】发言


