


 本文深入剖析矩阵乘法程序的性能瓶颈,利用perf和Intel VTune工具进行热点定位,揭示了前端和后端受限的原因,通过代码优化、循环展开等技术显著提升执行效率。
目录
一、概述
对应于
lecture-1-matrix-multiply-a-case-study
lecture-4-computer-architecture-and-performance-engineering
二、perf
- ‐e r[UMask:EventSelect]
- -e cpu/event=0x0e,umask=0x01,inv,cmask=0x01/
2.2 perf stat
用于查看程序整体性能,
Usage: perf stat [<options>] [<command>]
- -e, --event <event> event selector. use 'perf list' to list available events
- -p, --pid <pid> stat events on existing process id
- -t, --tid <tid> stat events on existing thread id
- -d, --detailed detailed run - start a lot of events
- -r N, --repeat <n> repeat command and print average + stddev (max: 100, forever: 0)
2.3 perf top
实时显示系统 / 进程的性能统计信息
- -e/-p/-t
- -C, --cpu <cpu> list of cpus to monitor
- -c, --count <n> event period to sample
- -E, --entries <n> display this many functions
- -d, --delay <n> number of seconds to delay between refreshes
- -k, --vmlinux <file> vmlinux pathname
- -K, --hide_kernel_symbols hide kernel symbols
- -U, --hide_user_symbols hide user symbols
2.4 perf annotate
指令级分析
2.5 perf record
记录一段时间内系统 / 进程的性能事件
Usage: perf record [<options>] [<command>]
- -e/-p/-t/-c
- -g enables call-graph recording
- -o, --output <file> output file name
- -u, --uid <user> user to profile
2.6 perf report
读取 perf record 生成的 perf.data 文件,并显示分析数据
perf report [-i <file> | --input=file]
- -d, --dsos <dso[,dso...]> only consider symbols in these dsos
- -i, --input <file> input file name
- -v, --verbose be more verbose (show symbol address, etc)
- -n, --show-nr-samples Show a column with the number of samples
- -S, --symbols <symbol[,symbol...]> only consider these symbols
- -U, --hide-unresolved Only display entries resolved to a symbol
三、intel vtune
内容较多,参见Performance Engineering of Software Systems (四) ——工具使用之二
四、case study——矩阵乘法
一个比较经典的程序优化,在很多课程都提到,本文程序对应于公开课 prj0,可以按照说明的文档运行。矩阵相乘核心逻辑:
int matrix_multiply_run(const matrix* A, const matrix* B, matrix* C)
{
  int i, j, k;

  for (i = 0; i < A->rows; i++) {
    for (j = 0; j < B->cols; j++) {
      for (k = 0; k < A->cols; k++) {
        C->values[i][j] += A->values[i][k] * B->values[k][j];
      }
    }
  }

  return 0;
}
优化级别-o0(原始程序make DEBUG=1),先用perf stat找下hotspot
 Performance counter stats for './matrix_multiply':

      12173.825981      task-clock (msec)         #    1.000 CPUs utilized
                32      context-switches          #    0.003 K/sec
                 0      cpu-migrations            #    0.000 K/sec
             3,131      page-faults               #    0.257 K/sec
    29,771,471,841      cycles                    #    2.446 GHz
    15,720,682,522      stalled-cycles-frontend   #   52.80% frontend cycles idle
    55,116,192,335      instructions              #    1.85  insn per cycle
                                                  #    0.29  stalled cycles per insn
     1,015,253,855      branches                  #   83.396 M/sec
         1,192,398      branch-misses             #    0.12% of all branches

      12.174698897 seconds time elapsed
程序运行时间12.17s,IPC=1.85,看起来不是内存的问题,显示hotspot在 stalled-cycles-frontend 52.80%这个结果和IPC结果一致。我们知道frontend bound的原因是可能在IF(L1 icache miss, iTLB miss),也可能是branch miss或者译码慢,上图显示branch-misses 为0.12%显然不是原因,那看下icache miss情况
perf stat -e iTLB-loads-misses,iTLB-loads  -e L1-icache-loads-misses,instructions ./matrix_multiply

Elapsed execution time: 12.198415 sec

 Performance counter stats for './matrix_multiply':

            28,394      iTLB-loads-misses         #  595.26% of all iTLB cache hits
             4,770      iTLB-loads
           208,254      L1-icache-loads-misses
    55,115,704,337      instructions

      12.221857999 seconds time elapsed
TIPS:我用的 E5-2640 基于IvyBridge,perflist中没有L1-icache-loads,我搜到【3】这个课程(一些notes很不错),在它的一次作业中http://web.eece.maine.edu/~vweaver/classes/ece571_2014f/ece571_hw4.pdf我发现:
(a) Measure and report the L1 instruction cache miss rate.
Use instructions:u and L1-icache-load-misses:u for the events.
他们用的机器是SandyBridge,好像也没有L1-icache-loads,作业中针对icache miss测量有一个问题写到:
For the L1-icache-misses event, the Linux kernel uses ICACHE:MISSES while PAPI uses L2_TRANS:CODE_RD Look at the intel vol3b developer manual. Look at the descriptions for these two events. Do these match the behavior you’d expect with L1-icache-misses? Do you think you get the same results using these two events?
我也不清楚有什么区别,既然他们用instructions这个代替L1-icache-loads,那我也姑且这么用吧,这里记录一下后续挖掘一下。没办法,性能调优的时候遇到问题总得找个说服自己的理由。按照这种测量方式icache miss很低
至于上述iTLB-loads-misses比iTLB-loads还大,我也不知道如何分析这个结果。
那么接下来如何分析呢?毕竟有一个指标无法解释,我先看了一下哪个语句耗时比较多(perf record + perf annotate):
         :	        C->values[i][j] += A->values[i][k] * B->values[k][j];
    0.12 :	  400ec6:       mov    -0x28(%rbp),%rax
    0.01 :	  400eca:       mov    0x8(%rax),%rax
    8.09 :	  400ece:       mov    -0x4(%rbp),%edx
    1.06 :	  400ed1:       movslq %edx,%rdx
    0.16 :	  400ed4:       shl    $0x3,%rdx
    0.01 :	  400ed8:       add    %rdx,%rax
    6.04 :	  400edb:       mov    (%rax),%rax
    0.66 :	  400ede:       mov    -0x8(%rbp),%edx
    0.19 :	  400ee1:       movslq %edx,%rdx
    0.00 :	  400ee4:       shl    $0x2,%rdx
    5.56 :	  400ee8:       add    %rax,%rdx
    0.66 :	  400eeb:       mov    -0x28(%rbp),%rax
    0.09 :	  400eef:       mov    0x8(%rax),%rax
    0.00 :	  400ef3:       mov    -0x4(%rbp),%ecx
    5.19 :	  400ef6:       movslq %ecx,%rcx
    0.79 :	  400ef9:       shl    $0x3,%rcx
    0.13 :	  400efd:       add    %rcx,%rax
    0.03 :	  400f00:       mov    (%rax),%rax
    5.44 :	  400f03:       mov    -0x8(%rbp),%ecx
    0.81 :	  400f06:       movslq %ecx,%rcx
    0.12 :	  400f09:       shl    $0x2,%rcx
    0.01 :	  400f0d:       add    %rcx,%rax
    9.66 :	  400f10:       mov    (%rax),%ecx
    0.62 :	  400f12:       mov    -0x18(%rbp),%rax
    0.01 :	  400f16:       mov    0x8(%rax),%rax
    0.00 :	  400f1a:       mov    -0x4(%rbp),%esi
    6.68 :	  400f1d:       movslq %esi,%rsi
    0.29 :	  400f20:       shl    $0x3,%rsi
    0.01 :	  400f24:       add    %rsi,%rax
    0.00 :	  400f27:       mov    (%rax),%rax
    6.04 :	  400f2a:       mov    -0xc(%rbp),%esi
    0.16 :	  400f2d:       movslq %esi,%rsi
    0.00 :	  400f30:       shl    $0x2,%rsi
    0.01 :	  400f34:       add    %rsi,%rax
    6.20 :	  400f37:       mov    (%rax),%esi
    0.21 :	  400f39:       mov    -0x20(%rbp),%rax
    0.00 :	  400f3d:       mov    0x8(%rax),%rax
    0.00 :	  400f41:       mov    -0xc(%rbp),%edi
    7.17 :	  400f44:       movslq %edi,%rdi
    0.21 :	  400f47:       shl    $0x3,%rdi
    0.00 :	  400f4b:       add    %rdi,%rax
    0.03 :	  400f4e:       mov    (%rax),%rax
    6.11 :	  400f51:       mov    -0x8(%rbp),%edi
    0.09 :	  400f54:       movslq %edi,%rdi
    0.00 :	  400f57:       shl    $0x2,%rdi
    0.03 :	  400f5b:       add    %rdi,%rax
    7.87 :	  400f5e:       mov    (%rax),%eax
    2.54 :	  400f60:       imul   %esi,%eax
    1.83 :	  400f63:       add    %ecx,%eax
    2.05 :	  400f65:       mov    %eax,(%rdx)
由于是o0,翻译的代码很原始,也和我们所料 C->values[i][j] += A->values[i][k] * B->values[k][j];这句代码占了很大一部分,上述代码分别计算 C->values[i][j] A->values[i][k] B->values[k][j] 并将他们加起来。另外就是这个C语句看到翻译的指令数非常多,比较耗时的指令有一些符号扩展的汇编指令,我们可以通过将循环变量i,j,k改成unsigned long避免。这样修改完成后再看一下:
[root@localhost matrix_multiply]# perf stat ./matrix_multiply
 Performance counter stats for './matrix_multiply':

      11991.752951      task-clock (msec)         #    1.000 CPUs utilized
                33      context-switches          #    0.003 K/sec
                 0      cpu-migrations            #    0.000 K/sec
             3,131      page-faults               #    0.261 K/sec
    28,623,436,554      cycles                    #    2.387 GHz
    16,565,912,968      stalled-cycles-frontend   #   57.88% frontend cycles idle
    48,117,925,442      instructions              #    1.68  insn per cycle
                                                  #    0.34  stalled cycles per insn
     1,015,235,495      branches                  #   84.661 M/sec
         1,191,762      branch-misses             #    0.12% of all branches

      11.993037012 seconds time elapsed
运行时间只有小幅降低,stalled-cycles-frontend还有所升高,这时候再看一下汇编代码:
         :	        C->values[i][j] += A->values[i][k] * B->values[k][j];
   11.01 :	  400ecd:       mov    0x8(%rax),%rax

    7.04 :	  400eea:       mov    -0x38(%rbp),%rax

   10.59 :	  400f15:       mov    -0x8(%rbp),%rsi

    8.19 :	  400f30:       mov    -0x30(%rbp),%rax

    6.19 :	  400f40:       add    %rdi,%rax

    6.50 :	  400f4e:       add    %rdi,%rax
    4.18 :	  400f51:       mov    (%rax),%eax
    2.50 :	  400f53:       imul   %esi,%eax
    2.07 :	  400f56:       add    %ecx,%eax
    3.32 :	  400f58:       mov    %eax,(%rdx)
只把耗时多的列出来了,可以看见从栈中取数据的指令消耗的较多的时间(A,B,C矩阵地址和i,j,k),明明问题显示frontend bound,为什么耗时的指令会表现在访问内存呢?
【2】中是对一个循环的分析和我们的情况比较类似,它也是看到了stalled-cycles-frontend很高,但是影响frontend的那些指标测量出来都不高(文中没有给出这些指标的结果,不知道和我这里情况相比如何)。作者先是分析了stalled-cycles-frontend的来源,通过:
more /sys/devices/cpu/events/stalled-cycles-frontend
event=0x0e,umask=0x01,inv,cmask=0x01
再通过intel手册3B 19.7
![]()
确认是UOPS_ISSUED.ANY这个指标,接下来作者通过自己的hack,测量了导致stall的指标,发现RESOURCE_STALLS.ANY计数和UOPS_ISSUED.ANY很接近,而resouce stall可以通过下图的事件进一步测量:
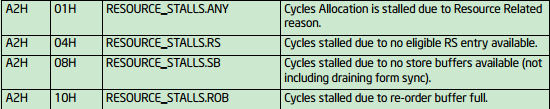
作者发现RESOURCE_STALLS.RS和RESOURCE_STALLS.ANY计数接近,说明导致stalled-cycles-frontend正是RESOURCE_STALLS.RS
最终作者的结论是:
可以发现在-O0编译条件下,CPU stall的原因仍然是由于Reservation Station没有可用资源导致的。
但是这个RS没有资源明明是endfront bound啊,是perf给错了原因了吗?
我们的矩阵乘法测量RESOURCE_STALLS.ANY和UOPS_ISSUED.ANY是相似的,但是去测量RS,SB,ROB都和RESOURCE_STALLS.ANY的值相差很远。
 Performance counter stats for './matrix_multiply':

    16,339,747,905      cpu/event=0x0e,umask=0x01,inv,cmask=0x01/
    16,169,392,859      cpu/event=0xa2,umask=0x01/
     1,567,045,235      cpu/event=0xa2,umask=0x04/
        18,976,264      cpu/event=0xa2,umask=0x08/
         2,876,878      cpu/event=0xa2,umask=0x10/

      11.611535574 seconds time elapsed
可以看到perf指示的stalled-cycles-frontend和RESOURCE_STALLS.ANY是接近的,但是按照手册测量其他resource stall完全不能反映stall的resource在哪?事情到这再次陷入难以自圆其说的地步。
我们用vtune试一下,看一下intel自家的产品怎么样:
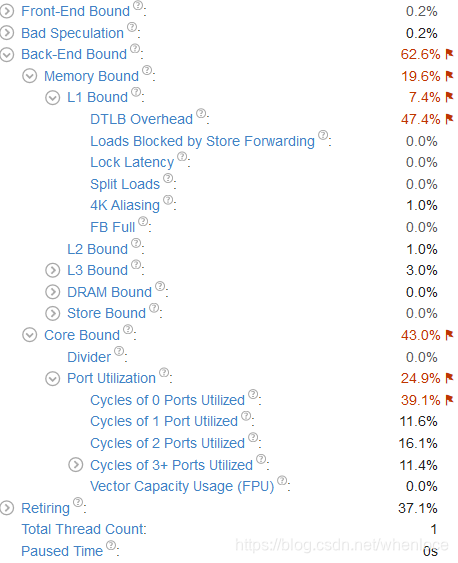
vtune根据自顶向下的方法将所有的指标都给出了,并将需要调优的标红,vtune指出瓶颈在back-end bound,我们先不去管它,看具体的指标,DTLB Overhead和Cycles of 0 Ports Utilized。前面说到Cycles of 0 Ports Utilized 一段时间内,所有port一个uops也不执行,可以由编译器动态调度提高指令并行性,我们试着将gcc优化等级由o0调整为o3。
程序运行时间降低为9.7s,性能得到提高
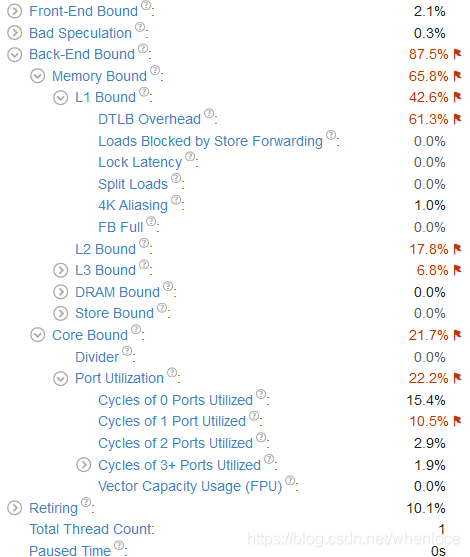
再看,此时Cycles of 1 Ports Utilized和L1 Bound中的DTLB_overhead,说明有L1 dcahe miss,我们回来看下perf统计
perf stat -e cycles,instructions -e L1-dcache-load-misses,L1-dcache-loads ./matrix_multiply

 Performance counter stats for './matrix_multiply':

    23,144,046,051      cycles                                                        (50.00%)
    10,086,518,752      instructions              #    0.44  insn per cycle
     1,322,477,777      L1-dcache-load-misses     #   32.84% of all L1-dcache hits
     4,027,373,682      L1-dcache-loads                                               (75.00%)

       9.553961833 seconds time elapsed
同之前相比一个重要的指标instruction数量从55,116,192,335降低为10,086,518,752,指令数降低了86.7%,这说明编译器为我们做了很有效的工作!事实上,现代处理器优化能力非常强,我们优化是信任编译器,尽量将代码写成使编译器能产生高效的代码形式,配合编译器的工作。
编译器优化后,可以看到IPC=0.44,这说明存在backend bound,一般就是memory bound(因为高优化级别下编译器提高了ILP,消除core bound,vtune统计也可以看到),在上图中,perf终于提供了没有令人困惑的数据——32.85% L1 dcache miss,这和lecture-4-computer-architecture-and-performance-engineering中的演示结果也是一样的,也和我们通过IPC分析是一致的。那么这个dcache miss如何解决呢我们分析下矩阵乘法的步骤,矩阵相乘A x B是用A每一个行向量i,乘以B中每一个列向量j,得到矩阵C中i行j列的元素C(i, j),知道了执行步骤,再来分析一下内存,本文矩阵存储类似于二维数组,因此A按行存/取是满足了空间局部性的,而B,C都是按列存取的,我们的矩阵元素是int,1024x1024的,那么如果按照列来存取的话,每次都会跳4K大小——刚好是一个页面大小,那么出现DTLB overhead就不足为奇了。那么如何改进呢,我们看一下代码,由于我们的数组的随机存储的,因此我们没有必要按照矩阵乘法的规则操作,在三趟循环中,只要保证每个矩阵都是按先行后列来依次访问,就能得到比较好的空间局部性,怎么修改呢?只要将循环中j和k所在的行互换就可以了,我们来验证一下这个想法。
修改后先用perf看一下:
perf stat -e cycles,instructions -e L1-dcache-load-misses,L1-dcache-loads ./matrix_multiply

     3,113,446,879      cycles
     8,046,096,783      instructions              #    2.58  insn per cycle
        64,013,257      L1-dcache-load-misses     #    1.59% of all L1-dcache hits    (75.02%)
     4,020,120,092      L1-dcache-loads                                               (74.96%)

       1.414174745 seconds time elapsed
执行时间1.41s,L1 dcache miss 也降为1.59%。再附一张此时的vtune的统计:
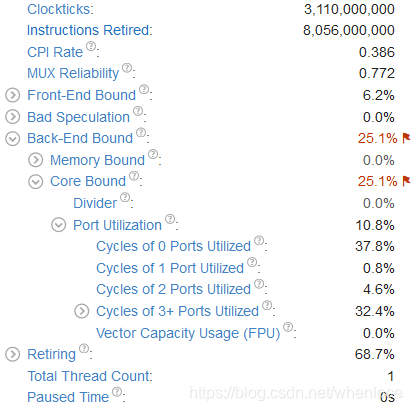
可以看到前面的指标都消除了,上面依然提示Core Bound,还又没有解决方法呢,我们先试着使用循环展开:
  for (i = 0; i < A->rows; i++) {
    for (k = 0; k < A->cols; k++) {
      for (j = 0; j < B->cols; j+=j+4) {
        C->values[i][j] += A->values[i][k] * B->values[k][j];
        C->values[i][j + 1] += A->values[i][k] * B->values[k][j + 1];
        C->values[i][j + 2] += A->values[i][k] * B->values[k][j + 2];
        C->values[i][j + 3] += A->values[i][k] * B->values[k][j + 3];
      }
    }
  }
Performance counter stats for './matrix_multiply':
878.638267 task-clock (msec) # 0.999 CPUs utilized
6 context-switches # 0.007 K/sec
1 cpu-migrations # 0.001 K/sec
3,129 page-faults # 0.004 M/sec
1,858,778,119 cycles # 2.116 GHz
353,663,839 stalled-cycles-frontend # 19.03% frontend cycles idle
4,547,721,126 instructions # 2.45 insn per cycle
# 0.08 stalled cycles per insn
256,831,666 branches # 292.306 M/sec
1,034,929 branch-misses # 0.40% of all branches
0.879095850 seconds time elapsed当然还有SIMD等优化方式,这里先不展开了。


 2056
2056

 被折叠的 条评论
为什么被折叠?
被折叠的 条评论
为什么被折叠?
 到【灌水乐园】发言


